Synergy among Genes and Genes-Environment on Coronary Artery Disease Risk and Prognosis
Article Information
Maria Isabel Mendonça1, Marina Santos2, Margarida Temtem2, Débora Sá2, Francisco Sousa2, Eva Henriques1, Sónia Freitas1, Sofia Borges1, Mariana Rodrigues1, Graça Guerra1, António Drumond2, Ana Célia Sousa1, Roberto Palma Reis3
1Centro de Investigação Dra. Maria Isabel Mendonça, Hospital Dr. Nélio Mendonça, SESARAM EPERAM, Avenida Luís de Camões, nº 57, 9004-514 Funchal, Portugal
2Serviço de Cardiologia, Hospital Dr. Nélio Mendonça, SESARAM EPERAM, Avenida Luís de Camões, nº 57, 9004-514 Funchal, Portugal
3NOVA Medical School, Faculdade de Ciências Médicas, Campo dos Mártires da Pátria 130, 1169-056 Lisboa, Portugal
*Corresponding author: Maria Isabel Mendonça, Centro de Investigação Dra. Maria Isabel Mendonça, Hospital Dr. Nélio Mendonça, SESARAM EPERAM, Avenida Luís de Camões, nº 57, 9004-514 Funchal, Portugal./p>
Received: 31 March 2023; Accepted: 10 April 2023; Published: 22 June 2023
Citation: Maria Isabel Mendonça, Marina Santos, Margarida Temtem, Débora Sá, Francisco Sousa, Eva Henriques, Sónia Freitas, Sofia Borges, Mariana Rodrigues, Graça Guerra, António Drumond, Ana Célia Sousa, Roberto Palma Reis. Synergy among genes and genes-environment on coronary artery disease risk and prognosis. Cardiology and Cardiovascular Medicine. 7 (2023): 218-228.
View / Download Pdf Share at FacebookAbstract
Introduction: Genetic and environmental factors contribute to predisposition to cardiovascular disease (CVD). Complex pathophysiological processes that may modulate this effect are unknown.
Objective: Evaluate whether genetic and environmental interactions may confer CAD susceptibility and assess CAD recurrence among patients prospectively followed up. Methods: A case-control study including 3161 participants, 1724 CAD patients (78.7% male) and 1437 controls (76.3% male) were followed prospectively (5.6±4.5 years). We evaluated the gene-gene interplay of 33 SNPs associated with CAD using the Multifactor Dimensionality Reduction (MDR) to estimate the best gene-gene model for CAD risk. Multivariate regression analysis confirmed the MDR method and evaluated the environmental impact on genetic risk. Kaplan-Meier assessed the survival curves, and Cox proportional regression analysis was performed with a hazard ratio (HR) for recurrent events.
Results: After MDR, the allelic interaction between TCF21 rs12190287 (GC) and APOE rs7412/rs429358 (ε3/ε4, ε4/ε4) was the best model with the highest likelihood for CAD, confirmed by the classic logistic regression (OR=1.99, 95%CI 1.39–2.87; p<0.0001). Additionally, the genetic interaction with environmental factors synergistically increases the individual’s propensity to CAD. Kaplan-Meier showed patients’ cumulative risk for events (HR) 70% higher in the risk model vs the nonrisk combination. After Cox regression, TCF21 and APOE combination were independently associated with CV events occurrence, with statistical significance (p=0.014).
Conclusions: Our findings identified two genetic loci with the best interaction for CAD risk. This combination should be further investigated to clarify the underlying mechanism of CAD susceptibility and better understand CAD pathophysiology providing personalized information for potential new therapies.
Keywords
Coronary Artery Disease; Genetic variants; Environmental factors; Multifactor Dimensionality Reduction (MDR) method; Cardiovascular events
Coronary Artery Disease articles; Genetic variants articles; Environmental factors articles; Multifactor Dimensionality Reduction (MDR) method articles; Cardiovascular events articles.
Article Details
1. Introduction
Current statistics from World Health Organization (WHO) show that cardiovascular disease (CVD) is a primary cause of death across the globe. Coronary Artery Disease (CAD), a common type of CVD, is a lethal illness that kills millions of individuals each year worldwide [1]. This disorder is multifactorial, resulting in the complex interplay of genetic, epigenetic, and environmental factors [2]. Even though the success of Genome-Wide Association Studies (GWAS), only a small number of genetic factors have been recognized with a genome-wide significance which explains a minor fraction of disease etiology. The affinity between complex diseases and multiple genes and their interactions is unknown. Whether a genetic effect works mainly through a complex mechanism involving numerous genes and environmental influences, the effect can be neglected when the gene is observed individually without possible interactions with other unknown factors. Exploring gene-gene and gene-environment interactions is essential to understanding the etiology of common complex diseases [3]. During the former years, numerous attempts have been made to include clinical decision-assist systems to predict CAD. These predictive models support clinicians and healthcare providers with individualized information to handle CAD and implement better and tailored treatments for their patients [4].
New statistical methods to detect nonlinear associations between variables emerged beyond logistic regression; new computational methods of machine learning and artificial intelligence to compute the CAD risk have been considered with great potential in gene-gene and gene-environment analysis. Logistic regression is the most frequently used to estimate the gene-gene interaction in genetic correlation studies [5-7]. Nevertheless, it faces a multicollinearity question when the Single Nucleotide Polymorphisms (SNPs) are in linkage disequilibrium (LD). Multicollinearity among independent variables will result in less reliable statistical inferences. Therefore, a considerable sample size is necessary to estimate logistic regression parameters to avoid problems modelling high-order interactions. To handle this issue, Ritchie et al. proposed a non-parametric and model-free method, multifactor dimensionality reduction (MDR) [8]. MDR has been extensively utilized to identify gene-gene interaction as it does not require any concepts of the genetic mode of inheritance [9-12]. Furthermore, it performs well for small trials and in the presence of LD. MDR analysis is focused on k-fold cross-validation (CV) to prevent overfitting issues, identify gene-gene synergy and display which combinations of genotypes are at high or low risk in the disease of concern.
In these circumstances, it is crucial to evaluate, with advanced statistical tools, the influence of genetics and conventional risk factors on the appearance and prognosis of CAD.
1.1 Objectives
In the present study, we propose to investigate the best model of genetic interactions for CAD risk using the MDR method. Then, we aim to validate these models using the classic logistic regression analysis and assess the genetic interaction with environmental factors. Finally, we intend to determine the CAD prognosis with the high and low-risk allelic combination from MDR analysis.
2. Methods
2.1 Study population
A case-control study included 3161 participants, 1724 CAD patients (78.7% male) and 1437 controls (76.3% male) with an extended prospective follow-up. Consecutive coronary patients were recruited from the Cardiology Department of Funchal Hospital Center (Madeira). All data were recorded in a regional quality clinical register (MADEIRA/GESTINTERNMENT) covering more than 90.0% spectrum of patients with acute coronary syndrome (ACS) and stable angina (SAP) that occurred in the Madeira Archipelago [13]. After stabilization and hospital discharge, only patients in the chronic phase are considered to enter the study. After inclusion, we collected the demographic, lifestyle and physical examination data by questionnaire survey and physical measurement. The questionnaire included available demographic and lifestyle information.
The controls were selected from the “normal” Madeira Archipelago population (without a known personal history of CVD), selected to be similar to CAD patients (cases) in terms of gender and age.
2.2 Follow-up and outcome evaluation
Patients with CAD (n=1724) were prospectively followed up from January 2001 to June 2022 (average 5.6±4.5 years) by physician investigators via a presential interview with a standard questionnaire previously defined [13]. All-cause vascular morbidity and mortality, we included recurring acute coronary syndrome (myocardial infarction and unstable angina), coronary revascularization (percutaneous or surgical coronary intervention) and readmission due to heart failure, ischemic stroke, and peripheral vascular disease.
Data on cardiovascular death was achieved from medical certificates and reports from family members.
All traditional and biochemical variables collected in this study were described elsewhere [14].
2.3 Genetic information
2.3.1 Selection of genetic variants for MDR
In the present study, we included 33 genetic variants previously associated with CAD by GWAS and already investigated by our group in the GENEMACOR study [13]. These SNPs are linked with inflammation, lipid and glycemic metabolism, oxidation, endothelial dysfunction, vascular remodelling and atherosclerosis progress. They were: PSRC1 rs599839, PCSK9 rs2114580, KIF6 rs20455, LPA rs3798220, ZNF259 rs964184, APOE rs7412/rs429358, ADIPOQ rs266729, IGF2BP2 rs4402960, PPARG rs1801282, SLC30A8 rs1326634, TCF7L2 rs7903146, TAS2R50 rs1376251, FTO rs8050136, MC4R rs17782313, HNF4A rs1884613, AGT rs699, AGT1R rs5186, ACE I/D rs4340, MTHFR rs1801131, MTHFR rs1801133, MTHFD1L rs6922269, PON1 rs705379, PON1 rs662, PON1 rs854560, MIA3 rs17465637, GJA4 rs618675, TCF21 rs12190287, PHACTR1 rs1332844, ZC3HC1 rs11556924, CDKN2B-AS1 rs1333049, CDKN2B-AS1 rs4977574, SMAD3 rs17228212 and ADAMTS7 rs3825807. All their genetic attributes, such as SNP identification (rs), nearest gene, chromosomal position, minor allelic frequency (MAF) and putative function, were recorded in a comprehensive table (Supplementary Table S1). In addition, it displays the OR (95% CI) found in our population’s most significant model (dominant, recessive, additive and allelic). Only LPA rs3798220 T>C was rejected for MDR analysis because it was inconsistent with Hardy–Weinberg equilibrium (p<0.002). The remaining 32 SNPs were used for gene-gene MDR interactions.
2.3.2 Genetic analysis
All participants’ genomic DNA was extracted from an 80 μL aliquot of whole blood collected in tubes containing EDTA using standard phenol/chloroform methodologies with ethanol precipitation. A TaqMan allelic discrimination assay for genotyping was performed using labelled probes and primers pre-established by the supplier (TaqMan SNP Genotyping Assays, Applied Biosystems). All reactions were done on an Applied Biosystems 7300 Real-Time PCR System, and genotypes were determined using the 7300 System SDS Software (Applied Biosystems, Foster City, USA).
2.4 Statistical analysis
2.4.1 Descriptive and comparative analysis
Continuous variables were defined as means (±SD) or medians (Min-Max), as appropriate. Categorical variables were determined as frequencies and proportions. We used the t-Student test (or Mann-Whitney) to compare continuous data and the χ2 test to compare categorical variables.
2.4.2 MDR model
The genotypes of each studied variant were grouped into wild-type (zero risk allele), heterozygous (one risk allele), and high-risk genotype (two risk alleles). Briefly, the MDR evaluates the maximum risk probability of gene-gene interaction and aggregates the total values for all individuals. Whether the average score is equal to or higher than a limit of 0, the identified genotype combination may be established as a high-risk model; on the other hand, if the score is lower than 0, it could be defined as a low-risk model. The score-built MDR method uses the data-reduction strategy reducing the dimensionality from multidimensional to one-dimensional. We intend to identify the gene-gene model combinations that exhibit the best relationship with the phenotype (CAD) from all potential genetic combinations. The test accuracy and cross-validation consistency get their maximum when proper multilocus models are achieved [15].
For genetic interaction models, we further assessed multivariate logistic regression analysis to confirm the best model identified by MDR. After adjustment for age, gender, and other conventional risk factors, multivariate logistic regression calculated which model best predicts the risk of CAD with a respective odds ratio (OR) and 95% confidence intervals (CI). Individuals at low genetic risk with beneficial environmental factors were the reference group for estimating gene–environment analysis. The significance of the multiplicative interaction between the genetic risk model and each unhealthy lifestyle factor (including hypertension, smoking and dyslipidemia) was determined by multivariate logistic regression of cumulative effects.
2.4.3 Survival analysis: Kaplan-Meier estimator and Cox proportional model
Kaplan-Meier estimator assessed the cumulative hazard rate of CV events among subjects carrying the combined risk alleles of TCF21 rs12190287 and APOE rs7412/rs429358, compared with the individual’s wild-type genotypes. In addition, we compared the event-free survival time of this genetic risk model with the participant’s wild-type allelic combination by the log-rank test.
The Cox proportional regression analysis with a respective hazard ratio (HR) for the relative risk of recurrent events was performed with the mentioned genetic risk model from MDR analysis adjusted to traditional cardiovascular risk factors.
All analyses were conducted with SPSS software (version 25.0, SPSS Inc). All corresponding P values are two-sided; p<0.05 was considered statistically significant.
3. Results
3.1 Basal Characteristics of the population (demographic, biochemical and clinical features)
Compared with controls, CAD patients had a significantly higher prevalence of all risk factors, namely physical inactivity, smoking, hypertension, dyslipidemia, diabetes, alcohol abuse, CV family history, BMI, triglycerides and creatinine clearance (CrCl) (all p<0.05) (Table 1). Total cholesterol, LDL and non-HDL presented higher levels in controls as patients were medicated with statins.
Table 1: Basal Characteristics of the Population
|
Variables |
Total (n=3161) |
CAD patients (n=1724) |
Controls (n=1437) |
P-value |
|
Age, years |
53.1 ± 7.8 |
53.3 ± 7.9 |
52.8 ± 7.8 |
0.062 |
|
Male sex, n (%) |
2454 (77.6) |
1357 (78.7) |
1097 (76.3) |
0.111 |
|
Physical inactivity, n (%) |
1699 (53.7) |
1080 (62.6) |
619 (43.1) |
<0.0001 |
|
Smoking status, n (%) |
1160 (36.7) |
818 (47.4) |
342 (23.8) |
<0.0001 |
|
Hypertension, n (%) |
1974 (62.4) |
1223 (70.9) |
751 (52.3) |
<0.0001 |
|
Dyslipidemia, n (%) |
2540 (80.4) |
1534 (89.0) |
1006 (70.0) |
<0.0001 |
|
Diabetes, n (%) |
782 (24.7) |
584 (33.9) |
198 (13.8) |
<0.0001 |
|
Alcohol abuse, n (%) |
478 (15.1) |
282 (16.4) |
196 (13.6) |
0.034 |
|
CV family history, n (%) |
601 (19.0) |
413 (24.0) |
188 (13.1) |
<0.0001 |
|
BMI, Kg/m2 |
28.4 ± 4.4 |
28.7 ± 4.4 |
28.1 ± 4.4 |
<0.0001 |
|
PWV, m/s |
8.5 ± 2.1 |
8.7 ± 2.4 |
8.3 ± 1.7 |
<0.0001 |
|
Total cholesterol, mg/dl |
192.0 (77.0 – 437.0) |
181.0 (77.0 – 437.0) |
204.0 (92.0 – 361.0) |
<0.0001 |
|
LDL cholesterol, mg/dl |
114.0 (9.6 – 598.0) |
106.2 (15.6 – 598.0) |
125.0 (9.6 – 582.0) |
<0.0001 |
|
HDL cholesterol, mg/dl |
45.0 (12.0 – 119.0) |
42.0 (18.2 – 115.8) |
49.0 (12.0 – 119.0) |
<0.0001 |
|
Non-HDL cholesterol |
147.0 (43.0 – 399.0) |
138.0 (50.0 – 399.0) |
154.9 (43.0 – 324.0) |
<0.0001 |
|
Triglycerides, mg/dl |
125.0 (4.9 – 2500.0) |
136.0 (10.2 – 2500.0) |
113.0 (4.9 – 1361.0) |
<0.0001 |
|
CrCl, n (%)* |
173 (5.5) |
126 (7.3) |
47 (3.3) |
<0.0001 |
CAD - Coronary artery disease; CV – Cardiovascular; BMI – Body mass index; PWV – Pulse wave velocity; LDL – Low-density lipoprotein; HDL – High-density lipoprotein; CrCl – Creatinine Clearance; *Cockroft-Gault<60 ml/min.; Continuous variables presented as mean ± SD or median (min-max). Statistically significant for p<0.05.
3.2 Gene-Gene interaction for CAD probability by MDR analysis
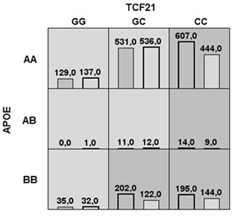
For CAD risk assessment, MDR performed all potential genotype combinations and recognized them as high- or low-risk, depending on the percentage of cases and controls in the population, testing the accuracy and consistency of the cross-validation (Fig. 1). The best model with all combinations is found when the maximum values are obtained.
Abbreviations: AA – ε2/ε2, ε3/ε3, ε2/ε3; AB – ε2/ε4; BB – ε3/ε4, ε4/ε4.
There were five low-risk (lighter grey) and four high-risk (darker grey) models of genotype combinations. The four high-risk genotypic combinations of TCF21 and APOE were CC+ ε2/ε2, ε2/ε3, ε3/ε3; CC+ ε2/ε4; CC+ ε3/ε4, ε4/ε4 and GC+ ε3/ε4, ε4/ε4. The five low-risk associations are: GG+ ε2/ε2, ε2/ε3, ε3/ε3; GC+ ε2/ε2, ε2/ε3, ε3/ε3; GG+ ε2/ε4; GC+ ε2/ε4 and GG+ ε3/ε4, ε4/ε4 (Fig. 1).
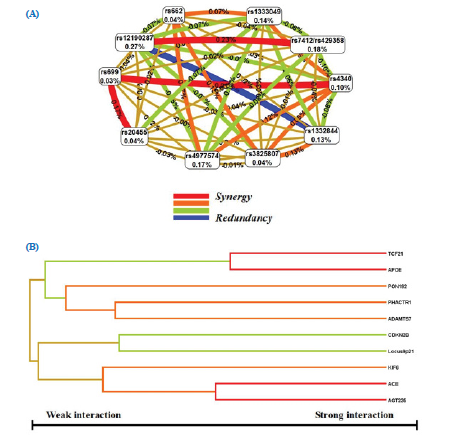
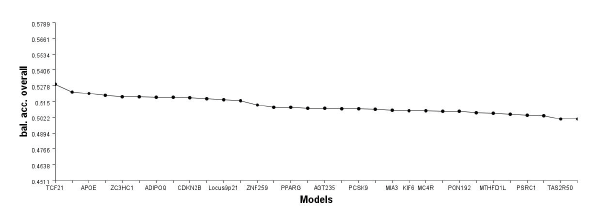
In our study, MDR determined that the two-locus interaction model, TCF21 rs12190287 plus APOE rs7412/rs429358, had high cross-validation consistency (with a score of 10/10) and balanced accuracy, sensitivity and specificity, which was determined to be the best two loci combination. This model was validated through 1000 permutations (Table 2 and Fig. 2 A, B and Fig. 3).
Table 2: Multilocus interactions to CAD susceptibility identified by MDR analysis
|
No. of loci |
Model |
Balanced accuracy |
CV consistency |
|
|
Training |
Testing |
|||
|
1 |
1 |
0.529 |
0.529 |
10/10 |
|
2 |
1, 2 |
0.548 |
0.548 |
10/10 |
|
3 |
1, 3, 2 |
0.558 |
0.513 |
03/10 |
|
4 |
1, 4, 5, 6 |
0.583 |
0.482 |
02/10 |
|
5 |
4, 7, 5, 6, 8 |
0.625 |
0.505 |
04/10 |
|
6 |
9, 10, 4, 7, 5, 6 |
0.689 |
0.499 |
03/10 |
1-TCF21 rs12190287; 2-APOE rs7412/rs429358; 3-CDKN2B-AS1 rs1333049; 4-CDKN2B-AS1 rs4977574; 5-ACE rs4340; 6-AGT rs699; 7- KIF6 rs20455; 8-PON1 rs662; 9-PHACTR1 rs1332844; 10-ADAMTS7 rs3825807.
(A)MDR Interaction Models. (B) MDR Dendrogram for SNP-SNP interaction.
3.3 Validation of genotypic models by traditional statistical methods
In order to validate the MDR method, we implemented a classic logistic regression analysis, after adjustment for conventional risk factors, regarding the CAD risk of all high and low-risk genotypes combinations used to obtain the best model (Table 3).
The interaction model with a more significant impact on CAD risk was TCF21 heterozygous genotype and APOE ε3/ε4, ε4/ε4 with an OR of approximately 2.0 (p<0.0001).
Table 3: Association between TCF21 rs12190287 and APOE rs7412/rs429358 variants through multivariate analysis
|
TCF21 rs12190287 |
APOE rs7412/rs429358 |
Cases (n=1724) |
Controls (n=1437) |
Odds ratio (95% CI) |
P value* |
|
GG |
AA |
129 (7.5) |
137 (9.5) |
Reference |
-- |
|
GG |
AB |
0 (0.0) |
1 (0.1) |
Undefined |
-- |
|
GG |
BB |
35 (2.0) |
32 (2.2) |
1.251 (0.695 – 2.254) |
0.455 |
|
GC |
AA |
531 (30.8) |
536 (37.3) |
1.185 (0.880 – 1.595) |
0.264 |
|
GC |
AB |
11 (0.6) |
12 (0.8) |
0.834 (0.319 – 2.176) |
0.71 |
|
GC |
BB |
202 (11.7) |
122 (8.5) |
1.994 (1.385 – 2.871) |
<0.0001 |
|
CC |
AA |
607 (35.2) |
444 (30.9) |
1.492 (1.108 – 2.008) |
0.008 |
|
CC |
AB |
14 (0.8) |
9 (0.6) |
2.099 (0.817 – 5.394) |
0.124 |
|
CC |
BB |
195 (11.3) |
144 (10.0) |
1.517 (1.063 – 2.166) |
0.022 |
|
GC+CC |
AB+BB |
422 (24.5) |
287 (20.0) |
1.324 (1.097 – 1.599) |
0.003 |
AA - ε2/ε2, ε3/ε3, ε2/ε3; AB – ε2/ε4; BB – ε3/ε4, ε4/ε4. *P values obtained by the logistic regression analysis after adjustment for conventional risk factors (gender, age, hypertension, diabetes, dyslipidemia, smoking habits, physical inactivity, obesity and alcohol abuse).
3.4 The combined impact of environmental and genetic factors on CAD risk
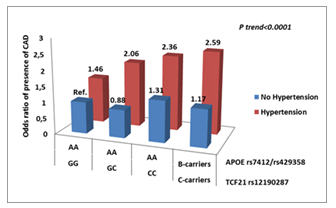
In this work, we intended to investigate whether environmental factors (including hypertension, smoking and dyslipidemia) could influence susceptibility to CAD in the population at high genetic risk.
After adjustment for conventional coronary risk factors and correction for multiple comparisons, we found that hypertension conferred a significantly higher risk for CAD, whatever the genetic risk profiles. Hypertensive subjects who carried the combined at-risk alleles of TCF21 rs12190287 and APOE rs7412/rs429358 had a remarkably increased risk for CAD (OR=2.59; 95%CI 1.54-4.35; p<0.0001) compared with those having wild-type genotypes and without hypertension. The reference group included individuals without hypertension and carrying wild-type genotypes of rs12190287 and rs7412/429358 (Fig. 4).
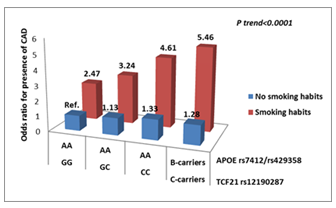
After adjusting for conventional coronary risk factors, smokers who carried the combined at-risk alleles TCF21 rs12190287 and APOE rs7412/rs429358 had a significantly increased risk for CAD (OR=5.46; 95%CI 3.12-9.55; p<0.0001). However, smoking increases the cardiovascular (CV) risk independently of the genetic profiles (Fig. 5).
Abbreviations: Ref, reference group. AA – wild-type genotype and BB - risk mutated genotype. AA – ε2/ε2, ε3/ε3, ε2/ε3; BB – ε3/ε4, ε4/ε4.
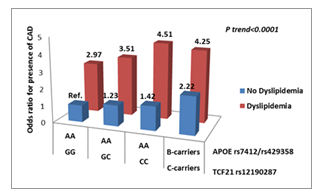
Furthermore, we were interested in studying the influence of this genetic combination with dyslipidemia on CAD susceptibility among people at high genetic risk. Results show dyslipidemia increases CAD risk (OR) in all genetic profiles (Fig. 6).
Abbreviations: Ref - reference group. AA – wild-type genotype and BB - risk mutated genotype. AA – ε2/ε2, ε3/ε3, ε2/ε3; BB – ε3/ε4, ε4/ε4.
3.5 Prognosis of Coronary Heart Disease Patients (Survival Analysis)
Over the follow-up, 714 cardiovascular events occurred in CAD patients, of which 290 were cardiovascular deaths.
3.5.1 Kaplan- Meier Estimator
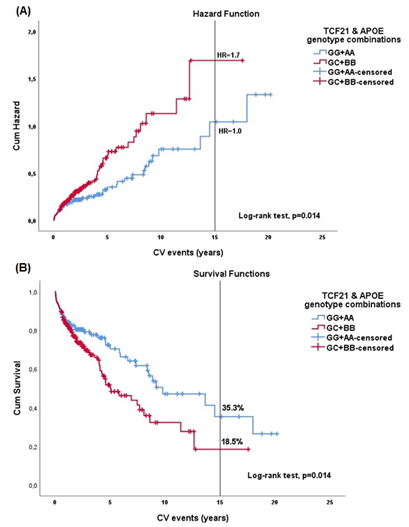
At fifteen years, Kaplan–Meier estimator showed a significantly higher cumulative hazard rate of cardiovascular events among subjects carrying the combined risk alleles of TCF21 rs12190287 and APOE rs7412/rs429358, compared with patients with the wild-type combination (Fig.7A). The cumulative hazard rate exposed the accumulated risk up to a specific time. In the context of CV events, the risk of recurrence (HR) at 15 years was 1.0 for the protector combination (GG+AA) and 1.7 for the risk interaction (GC+BB). The risk allele combination (GC+BB) was at higher risk over time, with statistical significance (p=0.014).
When we estimated the event-free survival time of individuals carrying the TCF21 plus APOE genotype risk model (GC+BB) compared to those holding the wild-type combination (GG+AA), the first showed an event-free survival time of 18.5%. The wild-type genotype association exhibited a survival probability of 35.3% at fifteen years (Fig.7B).
(A) Cumulative Hazard curves. The red line represents patients’ cumulative hazards with the combined risk alleles of TCF21 rs12190287 and APOE rs7412/rs429358 (GC+BB). The blue line is the cumulative hazards of patients with the combination’s wild-type (GG+AA).
(B) Cumulative Survival Curves. The red line represents patients’ cumulative survival probability with the combined risk alleles of TCF21 rs12190287 and APOE rs7412/rs429358 (GC+BB). The blue line is the cumulative survival probability of patients with the combination’s wild-type (GG+AA).
Log-rank p values were achieved from the Kaplan–Meier analysis.
3.5.2 Cox Regression Analysis
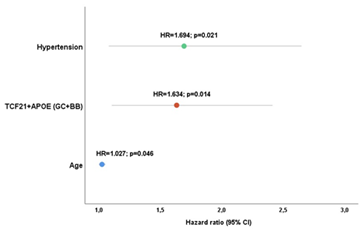
After Cox regression analysis, the individuals with GC+BB genotype combination presented a significantly higher risk of CV events development when compared with those with GG+AA combination (p=0.014). Also, the conventional risk factors independently associated with events recurrence were age and hypertension (p<0.05) (Fig. 8).
GC+BB - allelic risk combination. BB – ε3/ε4, ε4/ε4. *P values obtained by the Cox regression analysis after adjustment for conventional risk factors (gender, age, hypertension, diabetes, dyslipidemia, smoking habits, physical inactivity, obesity and alcohol abuse).
4. Discussion
Coronary artery disease is a complex multifactorial condition influenced by multiple genetic risk variants and lifetime contact with a hostile environment. Over the last two decades, a great effort has been made to recognize the genetic basis of coronary artery disease and other common complex cardiovascular diseases and comprehend how DNA variants connect with gene function. It has been a slow process due to its molecular mechanism complexity, and the benefit of its translation into clinical practice has not yet arrived [16-19]. To date, 321 loci were significantly associated with CAD in the post-GWAS Era; but this number will undoubtedly grow due to all the new innovative techniques. It is unclear which genes and environmental factors affect CAD risk [20].
The present study investigated the gene-gene interaction among 32 genetic variants in the susceptibility and prognosis of CAD in a Southern European population from the Madeira Archipelago. Based on allelic and genotypic inter-correlation analyses performed by the MDR method, we considered all the genetic interactions and their cumulative effect on the CAD risk and impact on the prognosis of patients. Additionally, we assessed the interaction between genes and environmental risk factors such as smoking, hypertension and dyslipidemia.
The gene-gene analyses with the MDR method disclosed a two-fold increased risk for the TCF21 rs12190287 and APOE rs7412/rs429358 interaction as the most potent synergy between these variants. The principal SNP at chromosome 6q23.2, rs12190287, is situated in the 3′ untranslated region (UTR) of the basic helix-loop-helix transcription factor TCF21, a gene that is also a significant expression quantitative trait loci (QTL) that define variation in expression levels of miRNAs. TCF21 is an expression gene regulator that could modulate vascular smooth muscle cell (VSMC) response after vascular stress and injury, promoting plaque stability and reducing clinical events [21]. Enhancing VSMC phenotypic modulation into fibromyocytes protects against CAD, and rs12190287 G>C polymorphism has an allelic specificity with the risk allele C inducing reduced transcriptional activity in contrast with the protective G allele, which increases its transcriptional activity. C allele carriers have high CAD risk [22]. APOE gene is placed on the long arm of chromosome 19 and has two non-synonymous SNPs in exon 4, rs429358 C>T and rs7412 C>T, originating the three main APOE alleles ε2, ε3, and ε4. The variant rs429358 C>T contains ε3 and ε4 and rs7412C>T ε3 and ε2. These alleles encode the six major APOE genotypes, three homozygous ε2/ε2, ε3/ε3, ε4/ε4 and three heterozygous ε3/ε4, ε2/ε4, ε2/ε3.
The ε3/ε3 is considered a wild-type genotype and the most frequent. The single amino acid interchange forms APOE protein isoforms. Whereas APOE2 takes cysteine at positions 112 and 158, APOE3 holds cysteine on residue 112 and arginine at residue 158, and APOE4 has arginine at both [23].
The exogenous and endogenous channels of lipoprotein metabolism rely on APOE, which plays a crucial role in reverse cholesterol transport. Excessive cholesterol from peripheral tissues is redirected via APOE-containing HDL to the liver for elimination [24].
Concerning the epistasis analysis, the MDR recognized the interaction between the TCF21 rs12190287G>C and APOE rs7412/rs429358 as the best model for CAD predisposition. These two variants can act synergistically, and the subjects carrying the risk genotypic combinations will be more susceptible to developing CAD. We can speculate that this association could alter the inflammatory response and affect the transcriptional efficacy of the genes by changing their expression and functionality. In the case of TCF21, vascular stress and injury could influence the development of adverse VSMC phenotypes contributing to plaque instability. Silvia Nuremberg et al. (2015) investigated the aortic tissues in APOE-hyperlipidemic mice, identifying TCF21 expression in media cells and adventitia of the fibrous cap [25]. However, further studies are needed to determine how changes in TCF21 gene expression affect the fibrous cap’s size and structural design and how such variations are associated with specific human diseases connected to plaque vulnerability and rupture.
Regarding the APO ε4 genotype, Jofre-Monseny et al., using a murine macrophage cell line stably transfected with human APOE4, have recently demonstrated this APOE isoform affects macrophage oxidative status and presents a modified inflammatory response. Additionally, they focused on the impact of this genotype on the activity of the transcription factor nuclear factor jB (NF-jB), which is known as part of modulating the inflammatory response and may contribute to severe CVD [26-28]. In the present work, the interaction between the two risk genotypes increased CAD susceptibility and changed the prognostic, increasing event occurrence. These findings also highlight the complexity of CAD as a multifactorial disease with several genetic factors and underlying genotype combinations that could modify gene function and individual risk. More research is needed to clarify these relationships.
Strengths
Madeira Archipelago has a single public Hospital. Therefore, we could obtain the results of all patients avoiding missing data during the follow-up.
An important point to highlight is that genetic prediction models can raise the perception of individual risk and, consequently, the involvement and acceptance of treatment, particularly in high-risk subjects. Although genetic factors are significant contributors, modifiable risk factors like hypertension, smoking and dyslipidemia impact more significantly for disease likelihood. Therefore, knowledge of the individual risk of CAD might better enhance people’s lifestyles, reducing CAD incidence and improving the prognosis. As far as I am aware, this is the first work that intends to investigate the impact of a genetic association on the susceptibility and prognosis of coronary heart disease in a Portuguese population.
Limitations
This study only evaluated the 32 SNPs previously described in the GENEMACOR study. Other SNPs could potentially create other genetic interactions causing stronger susceptibility to CAD.
Likewise, we must refer, as a study limitation, to the short average survey period (5.6±4.5 years) despite an extended follow-up (> 15 years). However, with the large sample size (1724 subjects), we could obtain a representative number of persons with an entire 15-year follow.
Further research studies to discriminate other SNPs interactions are required. Lastly, a more complete and detailed analysis should be targeted at different populations to evaluate the effect of race on this association.
5. Conclusions
In conclusion, we evaluated the predictive accuracy of a genetic model on CAD susceptibility and prognosis. According to the present results, the interaction of TCF21 and APOE risk polymorphisms is associated with a higher prevalence of CAD and a worse prognosis. The association of these polymorphisms with conventional risk factors (smoking habits, hypertension, and dyslipidemia) consistently increased CAD risk.
The study model may be helpful in better diagnosis and prognosis of coronary heart disease. However, we conclude that although genetic factors are significant contributors, modifiable risk factors interaction like hypertension, dyslipidemia, and smoking contribute more significantly to the likelihood of disease. Nonetheless, assessing the gene-gene interaction in CAD risk may increase individual participation in adopting healthier lifestyles. With a better understanding of the CAD risk pathophysiology and personalized information, we could achieve a better prognosis by implementing individualized new therapies.
References
- World Health Organization. Cardiovascular Disease. 10 (2021).
- Schwartz SM, Schwartz HT, Horvath S, et al. A Systematic Approach to Multifactorial Cardiovascular Disease. Arteriosclerosis, Thrombosis, and Vascular Biology 32 (2012): 2821-2835.
- Cordell HJ. Detecting gene-gene interactions that underlie human diseases. Nature Reviews Genetics 10 (2009): 392-404.
- Garavand A, Salehnasab C, Behmanesh A, et al. The Efficient Model for Coronary Artery Disease Diagnosis: The Comparative Study of Several Machine Learning Algorithms. Journal of Healthcare Engineering 7 (2022).
- Hosmer DW, Lemeshow S. Applied Logistic Regression. New York: Wiley 10 (2000).
- Cordell HJ, Barratt MJ, Clayton DG. Case/pseudo control analysis in genetic association studies: a unified framework for detecting genotype and haplotype associations, gene-gene and gene-environment interactions, and parent-of-origin effects. Genetic Epidemiology 26 (2004): 167-185.
- Chapman J, Clayton D. Detecting association using epistasis information. Genetic Epidemiology 31 (2007): 894-909.
- Coffey CS, Hebert PR, Ritchie MD, et al. An application of conditional logistic regression and multifactor dimensionality reduction for detecting gene-gene Interactions on the risk of myocardial infarction: The importance of model validation. BMC Bioinformatics 5 (2004): 4.
- Kraft P, Yu-Chun Y, Stram D, et al. Exploiting gene-environment interaction to detect genetic associations. Human Heredity 63 (2007): 111-119.
- Ritchie MD, Hahn LW, Roodi N, et al. Multifactor-dimensionality reduction reveals high-order interactions among estrogen-metabolism genes in sporadic breast cancer. The American Journal of Human Genetics 69 (2001): 138-147.
- Oh S, Lee J, Kwon MS, et al. A novel method to identify high-order gene-gene interactions in genome-wide association studies: Gene-based MDR. BMC Bioinformatics 13(Suppl 9) (2012): S5.
- Lee S, Kim Y, Kwon MS, et al. A Comparative Study on Multifactor Dimensionality Reduction Methods for Detecting Gene-Gene Interactions with the Survival Phenotype. BioMed Research International 2015 (2015): 671859.
- Mendonca MI, Pereira A, Monteiro J, et al. Impact of genetic information on coronary disease risk in Madeira: The GENEMACOR study. Revista Portuguesa de Cardiologia 42 (2023): 193-204.
- Mendonça MI, Henriques E, Borges S, et al. The Genetic information improves the prediction of major adverse cardiovascular events in the GENEMACOR population. Genetics and Molecular Biology 44 (2021): e20200448.
- Hahn LW, Ritchie MD, Moore JH. Multifactor dimensionality reduction software for detecting gene–gene and gene–environment interactions. Bioinformatics 19 (2003): 376–382.
- Musunuru K, Kathiresan S. Genetics of Common, Complex Coronary Artery Disease. Cell 177 (2019): 132-145.
- Erdmann J, Kessler T, Venegas LM, et al. A decade of genome-wide association studies (GWAS) for coronary artery disease, the challenges ahead. Cardiovascular Research 114 (2018): 1241–1257.
- Khera AV, Kathiresan S. Genetics of coronary artery disease: discovery, biology and clinical translation. Nature Reviews Genetics 18 (2017): 331–344.
- Vilne B, Schunkert H. Integrating Genes Affecting Coronary Artery Disease in Functional Networks by Multi-OMICs Approach. Frontiers in Cardiovascular Medicine 5 (2018): 89.
- Chen Z, Schunkert H. The Genetics of Coronary Artery Disease in the post-GWAS Era. Journal of Internal Medicine. 290 (2021), 202: 980-992.
- Pan H, Reilly MP. A protective, smooth muscle cell (SMC) transition in atherosclerosis. Nature Medicine 25 (2019): 1194–1195.
- Wirka C, Wagh D, Paik DT, et al. The atheroprotective roles of the smooth muscle cell (SMC) phenotypic modulation and the TCF21 disease gene as revealed by single-cell analysis. Nature Medicine 25 (2019): 1280–1289.
- Dose J, Huebbe P, Nebel A, et al. APOE genotype and stress response - a mini-review. Lipids in Health and Disease 15 (2016): 121.
- Zhang KJ, Zhang HL, Zhang XM, et al. The Apolipoprotein E isoform-specific effects on cytokine and nitric oxide production from mouse Schwann cells after inflammatory stimulation. Neuroscience Letters 499 (2011): 175–80.
- Nurnberg ST, Cheng K, Raiesdana A, et al. Coronary artery disease-associated transcription factor TCF21 regulates smooth muscle precursor cells (SMPC) that contribute to the fibrous cap. PLOS Genetics 11 (2015): e1005155.
- Jofre-Monseny L, Loboda A, Wagner A, et al. Effects of apoE genotype on macrophage inflammation and heme oxygenase-1 expression. Biochemical and Biophysical Research Communications 357 (2007): 319–32.
- Dose J, Nebel A, Piegholdt S, Rimbach G, Hebbe P. Influence of the APOE genotype on hepatic stress response: Studies in APOE targeted replacement mice and human. Free Radical Biology and Medicine 96 (2016): 264-272.
- Heeren J, Beisiegel U, Grewal T. Apolipoprotein E Recycling. Implications for Dyslipidemia and Atherosclerosis. Arteriosclerosis, Thrombosis and Vascular Biology 26 (2006): 442-448.
- Erdmann J, Kessler T, Munoz Venegas L, Schunkert H. A decade of genome-wide association studies for coronary artery disease: the challenges ahead. Cardiovasc Res 2018;114:1241–57.
Supplementary Table (S1)
S1 - Genetic variants associated with CAD susceptibility in the GENEMACOR population (n=3139)
Legend: SNP – Single Nucleotide Polymorphism; Chr – Chromosome; OR – Odds Ratio; CI – Confidence Interval; MAF – Minor Allele Frequency;+Additive model;*Recessive model; #Dominant model; •Allelic model; 1Resulting from a Haplotype. ORs are given for additive, recessive, allelic or dominant models according to the most significant The potential mechanism of action is based on what is already known about the function of the nearby genes, including Lipid metabolism, Diabetes/Obesity, Hypertension, Oxidation (genes involved in pro-oxidative status) and Cellular (genes associated with cell cycle, cellular migration, vascular remodelling and inflammation). **, Erdmann J, Kessler T, Munoz Venegas L, Schunkert H. A decade of genome-wide association studies for coronary artery disease: the challenges ahead. Cardiovasc Res 2018;114:1241-57 (29).

