mity: A Highly Sensitive Mitochondrial Variant Analysis Pipeline for Whole Genome Sequencing Data
Article Information
Clare Puttick1,^, Ryan L Davis1,2‡,^, Kishore R Kumar1,4‡,5, Julian MW Quinn6, Trent Zeng6, Christian Fares6, Mark Pinese1,6‡,7, David M Thomas1,5,8‡, Marcel E Dinger1,9‡, Carolyn M Sue1,2,3‡,10,*, Mark J Cowley1,6‡,7,*
1Kinghorn Centre for Clinical Genomics, Garvan Institute of Medical Research, Sydney, Australia
2Department of Neurogenetics, Kolling Institute, Faculty of Medicine and Health, University of Sydney and Northern Sydney Local Health District, Sydney, Australia
3Neuroscience Research Australia, Sydney, Australia
4Translational Neurogenomics Group, Molecular Medicine Laboratory and Department of Neurology, Concord Repatriation General Hospital, Concord Clinical School, University of Sydney, Concord, NSW, Australia
5St Vincent's Clinical School, UNSW Sydney, Sydney, Australia
6Children's Cancer Institute, UNSW Sydney, Sydney, Australia
7School of Clinical Medicine, UNSW Sydney, Sydney, Australia
8Omico: Australian Genomic Cancer Medicine Centre Ltd
9School of Life and Environmental Sciences, Faculty of Science, UNSW Sydney, Sydney, Australia
10Department of Neurology, Royal North Shore Hospital, Northern Sydney Local Health District, Sydney, Australia
^Authors contributed equally
‡Current primary affiliation
*To whom correspondence should be addressed
*Corresponding author: Mark Cowley, Children's Cancer Institute, UNSW Sydney, Sydney, Australia.
Carolyn Sue, Neuroscience Research Australia, Sydney, Australia.
Received: 29 September 2023; Accepted: 12 October 2023; Published: 08 January 2024
Citation: Clare Puttick, Ryan L Davis, Kishore R Kumar, Julian MW Quinn, Trent Zeng, Christian Fares, Mark Pinese, David M Thomas, Marcel E Dinger, Carolyn M Sue, Mark J Cowley. mity: A Highly Sensitive Mitochondrial Variant Analysis Pipeline for Whole Genome Sequencing Data. Journal of Bioinformatics and Systems Biology. 7 (2024): 05-16.
View / Download Pdf Share at FacebookAbstract
Mitochondrial diseases (MDs) are the most common group of inherited metabolic disorders and are often challenging to diagnose due to extensive genotype-phenotype heterogeneity. MDs are caused by mutations in the nuclear or mitochondrial genome, where pathogenic mitochondrial variants are usually heteroplasmic and typically at much lower allelic fraction in the blood than affected tissues. Both genomes can now be readily analyzed using whole genome sequencing (WGS), but most nuclear variant detection methods fail to detect low heteroplasmy variants in the mitochondrial genome. We developed mity, a bioinformatics pipeline for detecting, annotating, and interpreting heteroplasmic single nucleotide variants and insertion/deletion variants in the mitochondrial genome from WGS data. We optimized mity to accurately detect variants from high mitochondrial DNA sequencing depth (>3000x) obtained by WGS of blood from 13 control cell line replicates, 10 patients, and 2,570 healthy controls. mity can detect pathogenic mitochondrial variants, with heteroplasmy ranging from <1% to 100%. Through extensive variant annotations, mity enables easy interpretation of mitochondrial variants and can be incorporated into existing diagnostic WGS pipelines. WGS combined with mity could simplify the diagnostic pathway for MDs, avoid invasive tissue biopsies and increase the diagnostic rate for mitochondrial diseases and other conditions caused by impaired mitochondrial function.
Keywords
Mitochondrial Disease, Whole genome sequencing, Analytical pipelines, Mitochondrial DNA, Variant, Heteroplasmy
Mitochondrial Disease articles; Whole genome sequencing articles; Analytical pipelines articles; Mitochondrial DNA articles; Variant articles; Heteroplasmy articles
Mitochondrial Disease articles Mitochondrial Disease Research articles Mitochondrial Disease review articles Mitochondrial Disease PubMed articles Mitochondrial Disease PubMed Central articles Mitochondrial Disease 2023 articles Mitochondrial Disease 2024 articles Mitochondrial Disease Scopus articles Mitochondrial Disease impact factor journals Mitochondrial Disease Scopus journals Mitochondrial Disease PubMed journals Mitochondrial Disease medical journals Mitochondrial Disease free journals Mitochondrial Disease best journals Mitochondrial Disease top journals Mitochondrial Disease free medical journals Mitochondrial Disease famous journals Mitochondrial Disease Google Scholar indexed journals Whole genome sequencing articles Whole genome sequencing Research articles Whole genome sequencing review articles Whole genome sequencing PubMed articles Whole genome sequencing PubMed Central articles Whole genome sequencing 2023 articles Whole genome sequencing 2024 articles Whole genome sequencing Scopus articles Whole genome sequencing impact factor journals Whole genome sequencing Scopus journals Whole genome sequencing PubMed journals Whole genome sequencing medical journals Whole genome sequencing free journals Whole genome sequencing best journals Whole genome sequencing top journals Whole genome sequencing free medical journals Whole genome sequencing famous journals Whole genome sequencing Google Scholar indexed journals Analytical pipelines articles Analytical pipelines Research articles Analytical pipelines review articles Analytical pipelines PubMed articles Analytical pipelines PubMed Central articles Analytical pipelines 2023 articles Analytical pipelines 2024 articles Analytical pipelines Scopus articles Analytical pipelines impact factor journals Analytical pipelines Scopus journals Analytical pipelines PubMed journals Analytical pipelines medical journals Analytical pipelines free journals Analytical pipelines best journals Analytical pipelines top journals Analytical pipelines free medical journals Analytical pipelines famous journals Analytical pipelines Google Scholar indexed journals Mitochondrial DNA articles Mitochondrial DNA Research articles Mitochondrial DNA review articles Mitochondrial DNA PubMed articles Mitochondrial DNA PubMed Central articles Mitochondrial DNA 2023 articles Mitochondrial DNA 2024 articles Mitochondrial DNA Scopus articles Mitochondrial DNA impact factor journals Mitochondrial DNA Scopus journals Mitochondrial DNA PubMed journals Mitochondrial DNA medical journals Mitochondrial DNA free journals Mitochondrial DNA best journals Mitochondrial DNA top journals Mitochondrial DNA free medical journals Mitochondrial DNA famous journals Mitochondrial DNA Google Scholar indexed journals Variant articles Variant Research articles Variant review articles Variant PubMed articles Variant PubMed Central articles Variant 2023 articles Variant 2024 articles Variant Scopus articles Variant impact factor journals Variant Scopus journals Variant PubMed journals Variant medical journals Variant free journals Variant best journals Variant top journals Variant free medical journals Variant famous journals Variant Google Scholar indexed journals Heteroplasmy articles Heteroplasmy Research articles Heteroplasmy review articles Heteroplasmy PubMed articles Heteroplasmy PubMed Central articles Heteroplasmy 2023 articles Heteroplasmy 2024 articles Heteroplasmy Scopus articles Heteroplasmy impact factor journals Heteroplasmy Scopus journals Heteroplasmy PubMed journals Heteroplasmy medical journals Heteroplasmy free journals Heteroplasmy best journals Heteroplasmy top journals Heteroplasmy free medical journals Heteroplasmy famous journals Heteroplasmy Google Scholar indexed journals WGS pipelines articles WGS pipelines Research articles WGS pipelines review articles WGS pipelines PubMed articles WGS pipelines PubMed Central articles WGS pipelines 2023 articles WGS pipelines 2024 articles WGS pipelines Scopus articles WGS pipelines impact factor journals WGS pipelines Scopus journals WGS pipelines PubMed journals WGS pipelines medical journals WGS pipelines free journals WGS pipelines best journals WGS pipelines top journals WGS pipelines free medical journals WGS pipelines famous journals WGS pipelines Google Scholar indexed journals genome articles genome Research articles genome review articles genome PubMed articles genome PubMed Central articles genome 2023 articles genome 2024 articles genome Scopus articles genome impact factor journals genome Scopus journals genome PubMed journals genome medical journals genome free journals genome best journals genome top journals genome free medical journals genome famous journals genome Google Scholar indexed journals MT-DNA articles MT-DNA Research articles MT-DNA review articles MT-DNA PubMed articles MT-DNA PubMed Central articles MT-DNA 2023 articles MT-DNA 2024 articles MT-DNA Scopus articles MT-DNA impact factor journals MT-DNA Scopus journals MT-DNA PubMed journals MT-DNA medical journals MT-DNA free journals MT-DNA best journals MT-DNA top journals MT-DNA free medical journals MT-DNA famous journals MT-DNA Google Scholar indexed journals
Article Details
1. Introduction
Mitochondrial diseases (MDs) are highly heterogeneous genetic disorders, characterized by mitochondrial respiratory chain impairment [1] and caused by pathogenic variants in either the mitochondrial (MT) or nuclear genome. Pathogenic variants associated with MDs have been reported [2] in over 300 nuclear and almost all mitochondrial genes [3]. Few treatments exist for MDs, but it is critical to obtain a precise molecular diagnosis by identifying the causative variant(s), as this may guide appropriate treatment, clinical trial eligibility, therapeutic development, family planning and reproductive options [4, 5].
The human MT genome is a 16,569bp circular chromosome encoding rRNA, tRNA and protein coding genes [3] and has a mutation rate 19× higher than the nuclear genome [6]. Each cell has tens to thousands of MT genome copies, in which a pathogenic variant can be present in all (homoplasmy) or a proportion (heteroplasmy). Heteroplasmy varies within and between tissues and changes with age, generally being higher in disease-affected tissues and lower in more accessible tissues, such as blood, due to selection seen in dividing cells [7].
Current clinical-grade whole genome sequencing (WGS) at 30–40× average nuclear coverage provides high coverage of the MT genome (1,000–100,000× dependent on tissue), suggesting very low levels of heteroplasmy could be reliably detected. However, with high coverage, systematic sequencing errors accumulate, particularly in certain sequence contexts, making it challenging to discern true pathogenic variants from noise [8]. Most WGS variant callers are optimized for diploid analysis and are thus incapable of identifying low heteroplasmy MT variants. Existing approaches for MT-DNA analysis are web-based [9, 10] or GUI-based [11] and are therefore less amenable to high-throughput, reproducible analysis, are only validated on high heteroplasmy variants [12]. Recent developments include MitoHPC [13], which down-samples reads and has a lower heteroplasmy limit of 3%, but addresses some of the challenges with MT-DNA being a circular chromosome and having read homology with the nuclear genome.
Here, we present mity, a bioinformatics pipeline to detect MT single nucleotide variants (SNVs) and insertion/deletion variants (indels) from WGS, to assist clinicians and researchers with the diagnosis of MDs. mity was optimized to identify low heteroplasmy variants (below 1%), generate a highly interpretable report to aid molecular diagnosis, and be easily integrated into existing high-throughput analysis pipelines.
2. Materials and Methods
2.1 Patient recruitment
We recruited 10 adult MD patients reviewed at the Mitochondrial Disease Clinic at Royal North Shore Hospital, Sydney, Australia, between 2013-2015. The research was approved by the Northern Sydney Local Health District Human Research Ethics Committee (HREC/10/HAWKE/132) and all participants provided written informed consent. Total genomic DNA was isolated from peripheral blood using standard methods. NA12878 reference material was sourced from Genome in a Bottle.
2.2 Sequencing and read alignment
Sequencing libraries were created from nine patients in singlicate, one patient in duplicate, and 13 replicates from NA12878, using Illumina TruSeq Nano HT v2.5 library preparation kits and Hamilton Star instruments. Sequencing was performed on Illumina HiSeq X instruments, following the manufacturer’s specifications, at the Kinghorn Centre for Clinical Genomics, Sydney. Sequence reads were aligned to the human genome reference assembly GRCh37 decoy genome (hs37d5) using BWA-MEM (v0.7.12-r1039, settings -M) [40]. Reads were further processed using GATK Indel Realignment, and GATK Base Recalibration (version 3.3; [14]). Depth of coverage was performed using bedtools genomecov [15].
2.3 Variant detection and benchmarking
For initial benchmarking experiments, SNV and indel variants were detected using GATK HaplotypeCaller (version 3.3) with default settings, LoFreq (version 2.1.2) with default settings, or FreeBayes (version 1.2.0) with -F 0.005 -C 4 settings. The default mapping (-m) and base quality filter (-q) settings, and minimum alternate reads (-C) and variant allele frequency (VAF) (-F), were varied during benchmarking. The VAF is the fraction of sequencing reads carrying the alternate base compared to all reads, which we use as a direct measure of mitochondrial heteroplasmy, usually expressed as a percentage.
2.4 Variant quality score q and noise threshold p
The variant quality score, q, is defined as the Phred-scaled probability of seeing at least the observed number of alternate reads by chance, given a noise threshold and assuming a binomial distribution. That is, given a noise threshold p and position i, and ni alternate bases, from a total depth of Ni, the variant quality qi is:

where F is the binomial cumulative distribution function. To assess the level of noise in each dataset, we used samtools mpileup [16] to calculate the heteroplasmy of all three alternate bases at every position in the MT genome. This was visualised genome-wide (Figure 1B) and/or summarised (Supplementary Figure 3), and we set p to a level slightly higher than the noise floor, which in our experience was ~0.002 in cell lines or ~0.003 in blood DNA from patients (see results). Extensive manual review of candidate variants above and below this threshold confirmed these settings were appropriate (data not shown). As with any classification problem, there is a need to balance sensitivity with specificity. We therefore set the default threshold as q≥30 for use in mity, which favours sensitivity over specificity; higher thresholds will have fewer false positives at the risk of missing some pathogenic variants with low heteroplasmy. The lower the heteroplasmy of a candidate variant, the more likely it is to be a false positive, so we recommend manually reviewing all candidate variants [17] and if used in a clinical context, orthogonally validate in a secondary or disease relevant tissue.
2.5 mity implementation
mity was implemented in python v3.7.4, packaged using pip under the name mitylib, and containerized using Docker (for more details see GitHub link in data availability statement). The variant caller used in mity-call is FreeBayes (version 1.2.0) and employs the following settings as defaults: -F 0.005 -C 4 -m 30 -q 24 -r MT:1-16569. Variant impact was estimated using Variant Effect Predictor [18], with annotations from MITOMAP [19], MitoTIP [20] and population allele frequency information from the Medical Genome Reference Bank (MGRB) [21]. Ancestral variants used for mitochondrial haplogroups were obtained from PhyloTree build 17 [22].
2.6 Performance
mity can operate on either a WGS or MT-only BAM or CRAM file, with a run-time of <10 minutes per sample using a single-core and <8Gb RAM. This run-time can rise to 2 hours per sample for analysis of solid tissues with higher than 30× average coverage, such as tumors, when MT depth may be >100,000×.
3. Results
3.1 Variant caller selection and optimization
We reasoned that sensitive MT variant detection required a variant caller that could accurately identify very low heteroplasmy SNVs and indels (<1%) from very high depth sequencing data. GATK HaplotypeCaller v3 [14] is a popular genome-wide SNV and indel variant caller, but it has three major limitations for MT variant calling: 1) it down-samples the reads to a maximum of 500× depth, 2) it uses a diploid model by default, which is insensitive to low heteroplasmy variants and 3) does not provide a minimum heteroplasmy setting. FreeBayes [23] is a haplotype-aware, genome-wide variant caller, which allows for control over the minimum heteroplasmy and the minimum number of alternative-reads. Whilst FreeBayes and HaplotypeCaller both have ploidy parameters that can theoretically be tuned to prioritise low heteroplasmy variants from a high-ploidy sample, the resultant execution runtime becomes exponentially slower and computationally impractical for MT analysis. LoFreq was developed specifically for detecting low-frequency variants in next-generation sequencing data, with benchmarking data supporting sensitivity down to 0.05% heteroplasmy [24].
To determine the optimal MT variant caller, we compared the performance of HaplotypeCaller, FreeBayes and LoFreq on variant detection from 10 MD patients. A median of 28, 41 and 56 MT variants were identified, respectively. We manually inspected every variant and found LoFreq to be overly susceptible to systematic sequencing artefacts in our real-world data, and HaplotypeCaller to be insensitive to variants with low heteroplasmy (Supplementary Figure 1). FreeBayes produced very few false positives and was sensitive to variants with high and low heteroplasmy (Supplementary Figure 1) and was thus selected as the variant caller upon which we based mity.
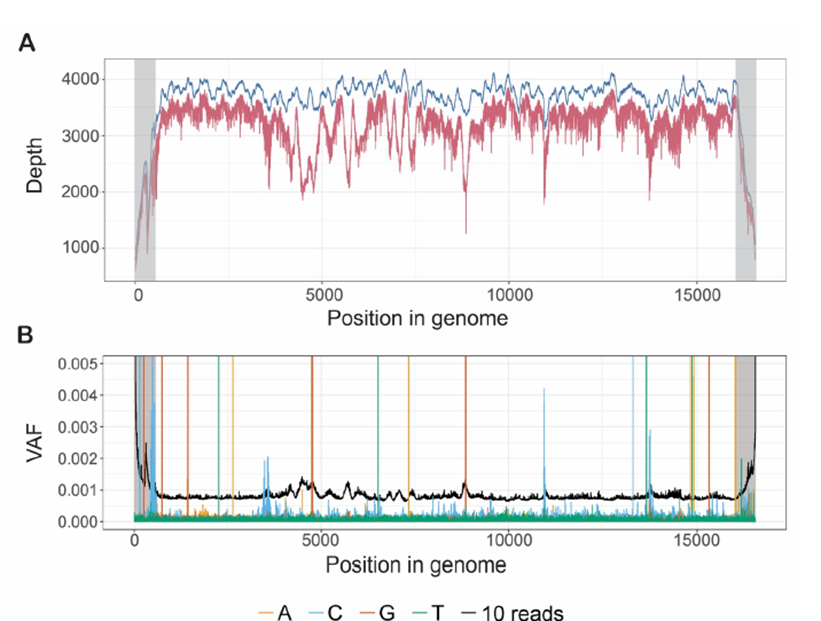
Figure 1: The high average depth across the MT genome in WGS data means that mity can detect very low heteroplasmy variants.
A: The average depth of sequencing coverage along the MT genome from 2,570 healthy controls with WGS. With no read filtering (blue) the average genome coverage was 3,666x, and with filtering to high quality reads (BQ ≥24, MQ ≥30; red), the coverage was reduced to 3,166x. The coverage in the D-loop (grey) drops off artificially due to alignments to a linear version of the MT genome. B: From one replicate of NA12878 with WGS, the variant allele frequency (VAF; analogous to heteroplasmy) of all three possible non-reference bases, at each position in the MT genome is typically below 0.0005, and far lower than the VAF corresponding to 10 high-quality reads (black). Spikes of alternate reads with VAF>0.002 outside the D-loop (grey) correspond to true genetic variants. Similar patterns of noise were observed in other replicates of NA12878, MT patients and healthy controls (data not shown).
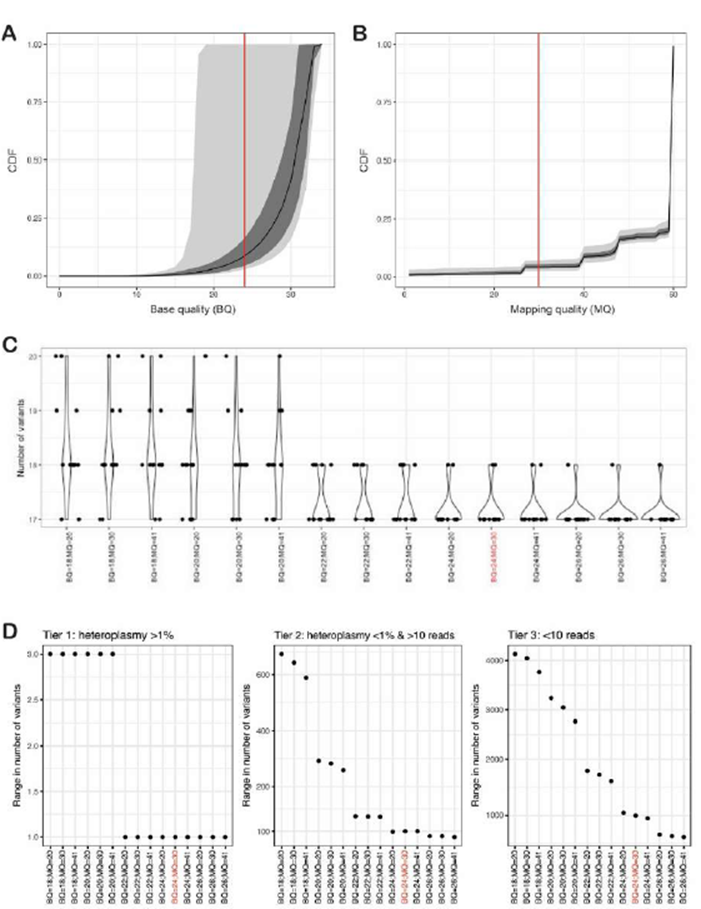
Using default FreeBayes settings, the reproducibility of variant calling from WGS of 13 replicates of DNA from the NA12878 cell line was poor (data not shown). We sought to optimise the mapping quality (MQ) and base quality (BQ) filters, first by assessing the distribution of these parameters (Supplementary Figure 2A and B), and then by quantifying the number of variants above 1% heteroplasmy when simultaneously varying MQ (≥ 20, 30 and 41) and BQ (≥ 18, 20, 22, 24 and 26) (Supplementary Figure 2C). We then assessed the variability in the numbers of variants identified in these replicates, for three tiers of variants: those with heteroplasmy >1% (tier 1), heteroplasmy <1% but with at least 10 supporting reads (tier 2), and fewer than 10 supporting reads (tier 3) (Supplementary Figure 2D); these tiers are also used in the mity-report module (see below). As expected, at more stringent quality settings the variability decreased (fewer false positives), and variant detection variability was much higher in tiers 2 and 3. Taken together, a threshold of BQ≥24 and MQ≥30 was an optimal trade-off of variant reproducibility and retaining sufficient reads to perform the analysis (red values in Supplementary Figure 2). To ensure that these quality filters didn’t discard too many reads in real-world MT data, we applied mity to WGS data from a large cohort of 2,570 elderly Australians deplete of cancer, cardiovascular disease, and dementia [21]. This filter combination resulted in a minimal reduction of sequencing depth from 3,666× with no filters, to 3,166× for MQ ≥30 and BQ ≥24 (Figure 1A).
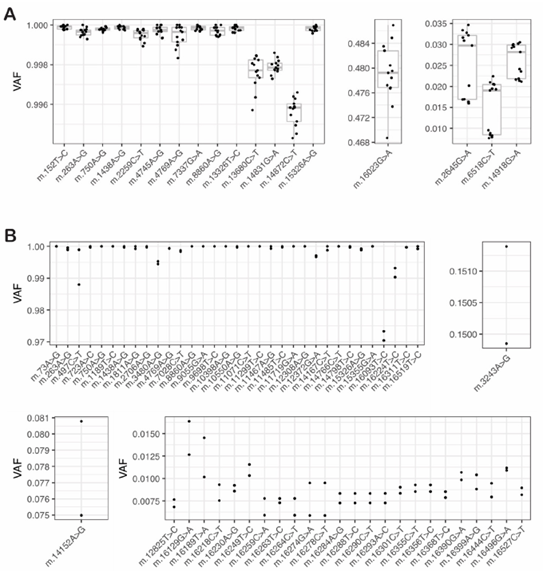
Figure 2: Variant heteroplasmy is highly reproducible even for low heteroplasmy variants in control cell lines and MT patient material
A: To evaluate the reproducibility and limit of detection of heteroplasmy estimation by mity in control cell lines, mity was run on WGS data from 13 replicates of DNA from NA12878: the VAF of 18 variants were compared between the replicates, showing a high level of reproducibility evident at homoplasmy (left) mid-range (middle) and low (right) heteroplasmy levels. B: Similar to panel A, using WGS data from two replicates of DNA from an MD patient: 59 variants were compared between the two patient replicates, showing a high level of reproducibility evident at homoplasmy (top left), mid-range (15%; top right), low-range (<10%; bottom left) and ultra-low (<1%) heteroplasmy. The previously known pathogenic m.3243A>G variant is shown (top right).
The default variant quality score in FreeBayes penalizes low heteroplasmy variants, due to the overwhelmingly high number of reference reads. However, we reasoned that the evidence to support low heteroplasmy MT variants should 1) only consider the alternate read count, 2) scale with the alternate read count, and 3) be reported using a similar scale to other variant quality methods. To achieve this, we used a binomial model to implement a Phred-scaled variant quality score, q. Assuming a noise level p, q is the Phred-scaled probability of observing at least n alternate reads by chance, given the total number of reads covering the variant position (see methods). The calculation of q is fast, heteroplasmy independent, and has a default threshold of q≥30, which can be tuned to favor sensitivity or specificity.
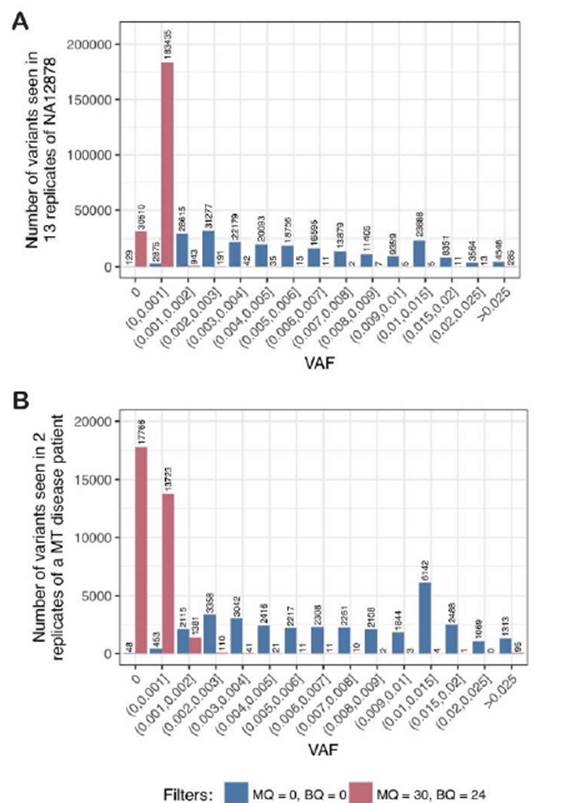
To determine the noise floor, p, we plotted the VAF of all three alternate bases at every position in the MT genome from WGS data obtained from NA12878, which appeared to be below VAF = 0.0005 in this sample (Figure 1B). For reference, the VAF of 10 high-quality reads was also plotted and was found to be considerably higher than the noise floor across the genome (black line; Figure 1B), which we adopted as the threshold for tier 2 variants (see mity-report below). When we aggregated data from 13 replicates of NA12878 (Supplementary Figure 3A), we determined a noise floor of p=0.002. Similarly, by aggregating data from two replicates of DNA from an MD patient, we estimated a noise floor of p=0.003 in this dataset (Supplementary Figure 3B). In practice these thresholds work well, though occasionally a WGS dataset has higher error rates that requires increasing p accordingly (data not shown).
We next investigated the reproducibility, and limit of detection of variant heteroplasmy estimation. We ran mity on 13 replicates of NA12878 and identified 18 MT variants in all samples with q>30, with highly reproducible heteroplasmy (Figure 2A); 5 additional variants were seen in a subset of replicates that all failed manual review. One variant had heteroplasmy just below 1% with q>30 in all replicates. In two independent replicates of DNA from an MD patient, we found 59 variants in both replicates with q>30 (Figure 2B). This included a known pathogenic m.3243A>G variant (heteroplasmy = 15%). There were one and three variants private to each replicate, of which two passed manual review, but just failed the q>30 threshold in the other sample. Twenty variants had heteroplasmy below 1% in at least one replicate, with q>30 and all passed manual review. Furthermore, from 50 MD patients with known m.3243A>G pathogenic variants, we demonstrated that mity was able to identify low heteroplasmy variants down to below 1% (specifically 0.35%) with very high correlation to pyrosequencing (R2=0.994) [25]. Collectively these results suggest that MT variants with q>30 are highly reproducible and enables detection of variants to below 1% heteroplasmy.
3.2 mity analysis pipeline
mity consists of three modules that easily integrate MT sequence analysis into existing nuclear WGS analysis pipelines (Figure 3). The first module, mity-call, analyses a BAM or CRAM file to call, filter and normalize MT SNVs and indels, to produce a mity VCF. The second module, mity-report, creates easily interpretable spreadsheet reports with extensive annotations, and the third module, mity-merge, combines nuclear and mity VCFs to produce a single high-quality VCF. This allows for seamless integration of mity into existing production or clinical-grade analysis pipelines for subsequent variant interpretation. mity has been designed for 30–40× depth Illumina short-read sequencing data (2×150bp paired-end reads) aligned to the GRCh37 + decoy (hs37d5) or GRCh38 reference genome using BWA-MEM. It has been tested on WGS from tumors with 100–120x depth (data not shown).
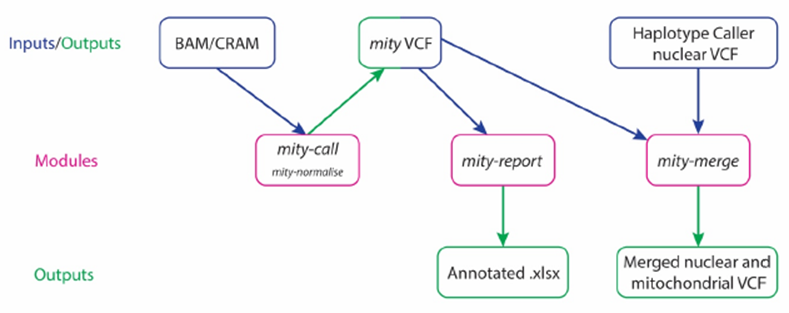
Figure 3: The mity analysis pipeline
mity consists of three modules (pink): mity-call, to call, filter and normalise (mity-normalise) variants in the mitochondrial genome; mity-report, to produce a clinician and researcher-friendly annotated mitochondrial variant spreadsheet report (Annotated .xlsx); mity-merge, to integrate mity variant lists into nuclear variant lists for a combined high quality variant call format (VCF) file. mity-call can analyse whole genome sequencing or mitochondrial-only alignment file inputs (BAM and CRAM). The output mity VCF can then be used as an input by both mity-report and mity-merge.
3.3 mity-call and mity-normalise
The first module, mity-call, initially runs FreeBayes in a highly sensitive mode, with the optimized settings informed by the benchmarking experiments above, of MQ ≥30, BQ ≥24 and minimum heteroplasmy of 0.5% or at least 4 supporting alternate reads. After selecting a noise floor, p (generally p=0.002–0.003), the custom quality score, q, is automatically calculated for each variant in each sample. Two additional filters are applied: (1) a strand bias filter to exclude variants with >90% or <10% alternative reads from one strand, and (2) a region filter to exclude variants in the homopolymeric regions at m.302–319 and m.3105–3109, where there is an ‘N’ at m.3107 in the rCRS of mitochondrial DNA. The benchmarking experiments above demonstrated highly reproducible and sensitive variant detection from cell lines and patients, with minimal overall impact on sequencing depth in cell lines and blood (Supplementary Figures 1–3).
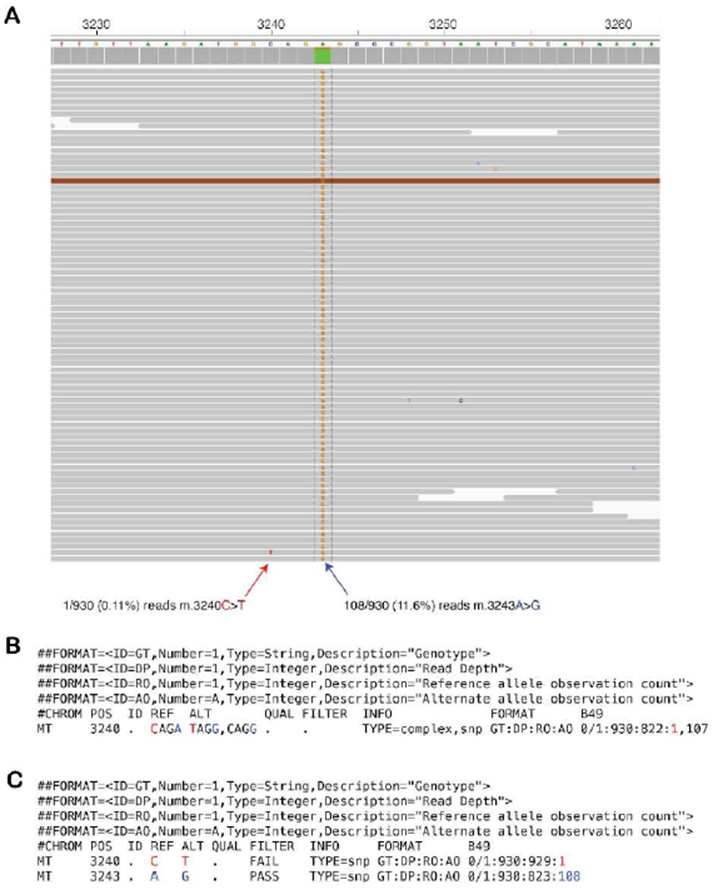
At high sequencing depth, introduction of sequencing errors is more likely and can artificially inflate the rate of multinucleotide variants (MNVs), which are more difficult to annotate using standard variant annotation tools. In one MD patient, mity initially missed a known m.3243A>G pathogenic variant because of one read that carried a sequencing error two bases upstream, creating an MNV (Supplementary Figure 4) [25]. Furthermore, existing variant decomposition methods, including vt normalize [26] and vcflib [23], do not decompose all the INFO and FORMAT annotations of MNVs, which are required for mity-report and downstream analysis tools. We thus implemented a custom method, mity-normalise (operates by default within mity-call; Figure 3), to decompose and normalise all variants, as well as propagate the variant metadata within the INFO and FORMAT fields in the VCF (Supplementary 4C).
3.4 mity-report
Intended end-users of mity include genome researchers and clinicians, so mity-report was developed to produce easily interpretable spreadsheet reports containing comprehensively annotated MT variant lists. As an alternative to selecting variants with high q scores, variants are also automatically tiered to aid prioritization: tier 1, heteroplasmy ≥1%; tier 2, heteroplasmy <1% with >10 supporting reads (e.g., black line Figure 1B); and tier 3 are the remaining variants; by default, only tier 1 variants are reported.
3.5 mity-merge
In order to integrate mity into existing WGS analysis pipelines, mity-merge replaces the MT variants from a genome-wide VCF (e.g., GATK HaplotypeCaller), with those from the mity VCF to merge nuclear and MT variants into a single VCF that can be used with downstream tools for annotation and filtering.
3.5 NUMT homology
Nuclear mitochondrial DNA segments (NUMTs) are homologous fragments of the mitochondrial genome that have been integrated into the nuclear genome [27] and can potentially confound heteroplasmy estimation [28, 29, 30]. For decades it has been unclear what the extent of common, rare and ultra-rare NUMT formation has been. However, a recent study has shown that NUMT formation is ongoing, with a de novo rate of 1 new NUMT per 104 live births [31]. It is thus challenging to rule out whether a rare variant with only a few supporting reads could be from a NUMT. When analyzing DNA extracted from blood using WGS with 30× nuclear depth, there is typically >3000× MT depth (and often much higher depending on tissue used). Thus, all tier 1 MT variants will have at least 30 supporting reads, making it highly unlikely that these are caused by a NUMT, which would be on one chromatid, with ~15 supporting reads. We recommend that low heteroplasmy variants of interest, particularly those in tier 2 and 3 be validated using orthogonal approaches, and that the clinical phenotype of the patient be used to guide whether a candidate variant could explain disease if it were present at a higher heteroplasmy in a secondary or disease-relevant tissue.
3.6 Application of mity to different cohorts
Since developing mity [32], we have employed the analysis pipeline to detect pathogenic MD variants in 242 adult MD patients [25] and 40 paediatric MD patients [33], individual cases [34], as well as comprehensive variant detection and heteroplasmy estimation in a control cohort of 2,570 healthy elderly adults in the MGRB [21]. In the adult MD cohort, an overall diagnostic rate of 53.7% was achieved, of which over half (56%) were attributed to mtDNA variants detected by mity ranging from homoplasmy down to 0.35% heteroplasmy [25]. In the MGRB cohort, mity variant analysis identified an age-related increase in somatic MT variation occurs after the age of 60 [21].
4. Discussion
We present mity, a highly sensitive mitochondrial variant caller that can detect SNVs and indels to below 1% heteroplasmy. The mity analytical pipeline is easily incorporated into existing nuclear variant pipelines and provides a comprehensively annotated report of all tiered variants. As genome sequencing costs decrease and analytical capability increases, integration of comprehensive MT genome sequencing analysis into clinical diagnostic pipelines is rapidly becoming a priority. In Australia, a Medicare rebate is now available for WGS-based testing of the nuclear and mitochondrial genome for the diagnosis of patients with a suspected MD [35], in part informed by our previous research [25, 33] based on earlier versions of mity [32].
There are now numerous mitochondrial variant detection tools (for a comprehensive review see [36]), which are pushing down the limit of heteroplasmy detection and increasing the diversity of analytical capabilities, such as copy number estimation, variant phasing and improving read alignment on the circular MT contig [13]. We agree with a recent benchmarking study that advised caution when considering low level heteroplasmic variants [37], and we recommend that low heteroplasmy variants should be considered in the context of a constellation of patient characteristics, and then validated using an orthogonal test in a disease-relevant tissue. Greater validation of low-heteroplasmy variants in multiple tissues and with more accurate methods, such as error corrected sequencing [38] or droplet digital PCR would help set robust thresholds for low heteroplasmy detection.
There are several future improvements to increase the functionality of mity. First, mity does not calculate MT deletions, instead we relied on dedicated copy number variation detection tools like ClinSV [39] to identify MT deletions, as demonstrated elsewhere [25]. Second, adding comprehensive catalogues of variation in the population, and large catalogues of known common, rare, and ultra-rare NUMT [31] would help filter down to fewer novel candidate disease causing variants. Third, wrapping the mity tool in a workflow language, such as nextflow will make it easier for researchers to run the tool on their local or cloud computing environment.
5. Conclusion
mity overcomes many of the challenges of accurate low heteroplasmy variant identification in the MT genome. mity can be easily incorporated into existing high-throughput analysis pipelines, while simultaneously producing user-friendly reports. By extending the scope of variants from WGS data, mity helps support further adoption of clinical WGS as a first-line diagnostic tool.
Data availability
Raw MGRB data is available upon application to the MGRB Data Access Committee, via https://sgc.garvan.org.au/terms/mgrb. The patient WGS data analyzed in this study do not have consent for public release.
mity is freely available from https://github.com/KCCG/mity under an MIT license.
This manuscript originally appeared as a pre-print on bioRxiv in 2019
(https://www.biorxiv.org/content/10.1101/852210v1)
Acknowledgements
We thank members of the Kinghorn Centre for assistance with data generation and patients for contributing their samples to this research.
MJC and RLD were supported by NSW Health Early-Mid Career Fellowships. KRK was supported by an NHMRC Early Career Fellowship (APP1091551). CMS was supported by an NHMRC Practitioner Fellowship (APP1008433). This work was supported by a NSW Genomics Collaborative grant (CMS, MED, RLD, KRK) and the NSW Health-funded Medical Genomics Reference Bank (DT, MED). We acknowledge financial support from the Kinghorn Foundation, without which this research would not have been possible. The authors would like to acknowledge Luminesce Alliance – Innovation for Children’s Health for its contribution and support. Luminesce Alliance is a not-for-profit cooperative joint venture between the Sydney Children’s Hospitals Network, the Children’s Medical Research Institute, and the Children’s Cancer Institute. It has been established with the support of the NSW Government to coordinate and integrate paediatric research. Luminesce Alliance is also affiliated with the University of Sydney and the University of New South Wales, Sydney.
Conflicts of Interests
The authors declare no competing interest.
References
- Gorman G S, Chinnery PF, DiMauro S, et al. Mitochondrial diseases. Nat Rev Dis Primers 2 (2016):
- Wallace D C. Mitochondrial genetic medicine. Nat Genet 50 (2018): 1642-1649.
- Davis R L, Liang C, & Sue C M. Mitochondrial diseases. Handb Clin Neurol 147 (2018): 125-141.
- Smeets HJM, Sallevelt SCEH & Herbert M. Chapter 14 - Reproductive options in mitochondrial disease. In R. Horvath, M. Hirano, & P. F. Chinnery (Eds.), Handbook of Clin Neurol 194 (2023): 207-228.
- Tinker R J, Lim A Z, Stefanetti RJ, et al. Current and Emerging Clinical Treatment in Mitochondrial Disease. Mol Diagn Ther 25 (2023): 181-206.
- Tuppen H A, Blakely EL, Turnbull DM, et al. Mitochondrial DNA mutations and human disease. Biochim Biophys Acta 1797 (2013): 113-128.
- Sue C M, Quigley A, Katsabanis S, et al. Detection of MELAS A3243G point mutation in muscle, blood and hair follicles. J Neurol Sci 161 (1998): 36-39.
- Griffith M, Miller CA, Griffith OL, et al. Optimizing Cancer Genome Sequencing and Analysis. Cell Systems 1 (2015): 210-223.
- Lee H Y, Song I, Ha E, et al. mtDNAmanager: a Web-based tool for the management and quality analysis of mitochondrial DNA control-region sequences. BMC Bioinformatics 9 (2008): 483.
- Weissensteiner H, Forer L, Fuchsberger C, et al. mtDNA-Server: next-generation sequencing data analysis of human mitochondrial DNA in the cloud. Nucleic Acids Res 44 (2016): 64-69.
- Ishiya K & Ueda S. MitoSuite: a graphical tool for human mitochondrial genome profiling in massive parallel sequencing. PeerJ 5 (2017): e3406.
- Santorsola M, Calabrese C, Girolimetti G, et al. A multi-parametric workflow for the prioritization of mitochondrial DNA variants of clinical interest. Hum Genet 135 (2016): 121-136.
- Battle S L, Puiu D, Group TO, et al. A bioinformatics pipeline for estimating mitochondrial DNA copy number and heteroplasmy levels from whole genome sequencing data. NAR Genom Bioinform 4 (2022): lqac034.
- DePristo M A, Banks E, Poplin R, et al. A framework for variation discovery and genotyping using next-generation DNA sequencing data. Nat genet 43 (2011): 491-498.
- Quinlan AR. BEDTools: The Swiss-Army Tool for Genome Feature Analysis. Curr Protoc Bioinformatics 47 (2014): 11.12.1-34.
- Li H, Handsaker B, Wysoker A, et al. The Sequence Alignment/Map format and SAMtools. Bioinformatics 25 (2009): 2078-2079.
- Barnell EK, Ronning P, Campbell KM, et al. Standard operating procedure for somatic variant refinement of sequencing data with paired tumor and normal samples. Genet Med 21 (2019): 972-981.
- McLaren W, Gil L, Hunt S E, et al. The Ensembl Variant Effect Predictor. Genome Biol 17 (2016): 122.
- Brandon MC, Lott MT, Nguyen KC, et al. MITOMAP: a human mitochondrial genome database--2004 update. Nucleic Acids Res 33 (2005): 611-613.
- Sonney S, Leipzig J, Lott M T, et al. Predicting the pathogenicity of novel variants in mitochondrial tRNA with MitoTIP. PLoS Comput Biol 13 (2017): e1005867.
- Pinese M, Lacaze P, Rath EM, et al. The Medical Genome Reference Bank contains whole genome and phenotype data of 2570 healthy elderly. Nat Commun 11 (2020): 435.
- Van Oven M & Kayser M. Updated comprehensive phylogenetic tree of global human mitochondrial DNA variation. Hum Mutat 30 (2009): 386-394.
- Garrison E & Marth G. Haplotype-based variant detection from short-read sequencing (2012). https://arxiv.org/abs/1207.3907
- Wilm A, Aw P P K, Bertrand D, et al. LoFreq: a sequence-quality aware, ultra-sensitive variant caller for uncovering cell-population heterogeneity from high-throughput sequencing datasets. Nucleic Acids Res 40 (2012): 11189-11201.
- Davis R L, Kumar K R, Puttick C, et al. Use of Whole-Genome Sequencing for Mitochondrial Disease Diagnosis. Neurol 99 (2022): 730-742.
- Tan A, Abecasis GR & Kang H M. Unified representation of genetic variants. Bioinformatics 31(2015): 2202-2204.
- Lopez J V, Yuhki N, Masuda R, et al. Numt, a recent transfer and tandem amplification of mitochondrial DNA to the nuclear genome of the domestic cat. J Mol Evol 39 (1994): 174-190.
- Maude H, Davidson M, Charitakis N, et al. NUMT Confounding Biases Mitochondrial Heteroplasmy Calls in Favor of the Reference Allele. Front Cell Dev Biol 7 (2019): 201.
- Parr R L, Maki J, Reguly B, et al. The pseudo-mitochondrial genome influences mistakes in heteroplasmy interpretation. BMC Genomics 7 (2006): 185.
- Santibanez-Koref M, Griffin H, Turnbull DM, et al. Assessing mitochondrial heteroplasmy using next generation sequencing: A note of caution. Mitochondrion 46 (2019): 302-306.
- Wei W, Schon KR, Elgar G, et al. Nuclear-embedded mitochondrial DNA sequences in 66,083 human genomes. Nat 611 (2023): 105-114.
- Clare Puttick, Kishore R Kumar, Mark J Cowley, et al. mity: A highly sensitive mitochondrial variant analysis pipeline for whole genome sequencing data (2019). https://doi.org/10.1101/852210.
- Riley L G, Cowley M J, Gayevskiy V, et al. The diagnostic utility of genome sequencing in a pediatric cohort with suspected mitochondrial disease. Genet Med 22 (2020): 1254-1261.
- Rius R, Compton AG, Baker NL, et al. Application of Genome Sequencing from Blood to Diagnose Mitochondrial Diseases. Genes (Basel) 12 (2021): 607.
- Committee MSA. 1675 – Whole Genome Sequencing for the diagnosis of mitochondrial disease (2023).
- Macken W L, Falabella M, Pizzamiglio C, et al. Enhanced mitochondrial genome analysis: bioinformatic and long-read sequencing advances and their diagnostic implications. Expert Rev Mol Diagn 23 (2023): 797-814.
- Ip EKK, Troup M, Xu C, et al. Benchmarking the Effectiveness and Accuracy of Multiple Mitochondrial DNA Variant Callers: Practical Implications for Clinical Application. Front Genet 13 (2022): 692257.
- Schmitt MW, Kennedy SR, Salk JJ, et al. Detection of ultra-rare mutations by next-generation sequencing. Proc Natl Acad Sci U S A 109 (2012): 14508-14513.
- Minoche AE, Lundie B, Peters GB, et al. ClinSV: clinical grade structural and copy number variant detection from whole genome sequencing data. Genome Med 13 (2011): 32.
- Li H. Aligning sequence reads, clone sequences and assembly contigs with BWA-MEM (2018). https://arxiv.org/abs/1303.3997
Supplementary Figures:
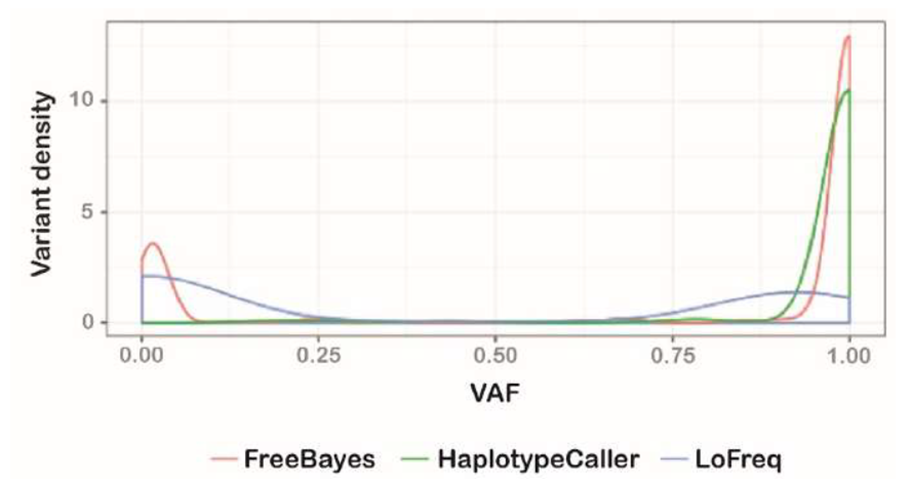
Supplementary Figure 1: Variant callers identify markedly different mitochondrial variants
A density plot of the variant allele frequency (VAF; comparable to heteroplasmy) for variants detected by FreeBayes (red), GATK HaplotypeCaller (green) and LoFreq (blue). FreeBayes identified variants at both low and high heteroplasmy, as well as having the lowest false positive rate of the three variant callers (not shown). Given its capability at low heteroplasmy, FreeBayes was selected as the variant caller upon which mity was developed.
Supplementary Figure 2: Optimizing FreeBayes mapping (MQ) and base (BQ) quality filters
A and B: Cumulative distribution plots of the fraction of reads passing minimum base quality (BQ; A) and mapping quality (MQ; B) for 13 replicates of NA12878 with WGS data. The median (black line), interquartile range (grey), and 95th percentile (light grey) are shown. C: a violin plot showing the number of variants with heteroplasmy >1% identified in 13 replicates of NA12878 across varying BQ and MQ combinations. D: the number of variants detected at different BQ and MQ thresholds, expressed as the range from fewest to highest number of variants detected across 13 replicates of NA12878. The variants are split into three tiers: tier 1 variants have heteroplasmy >1% (typically >30 reads), tier 2 variants have heteroplasmy <1% but >10 supporting reads, and tier 3 variants have fewer than 10 supporting reads. The threshold of BQ≥24 and MQ≥30 is highlighted in red throughout the figure as the determined MQ and BQ combination providing the most optimal variant detection.
Supplementary Figure 3: The noise floor is low in control cell lines and MT patient material
A: To estimate the noise floor, p, we first determined the variant allele frequency (VAF) of all three possible alternate alleles at each nucleotide in the MT genome in WGS data from 13 replicates of NA12878 (as shown in Figure 1B), then counted the number of variants at different VAF thresholds across all replicates. With no read filtering (blue) there are high rates of noise at all VAF thresholds, whereas with high-quality read filtering (BQ ≥24 and MQ ≥30; red), the noise is largely resolved using a threshold p>0.002. B: Similar to panel A, when using WGS data from two replicates of DNA from an MD patient, high-quality read filtering (red) showed that the noise is largely resolved using a threshold of p>0.003, unlike when no filters are applied (blue).
Supplementary Figure 4: Multinucleotide variants require variant normalization by mity-normalise for accurate calling and annotation
A: Raw sequencing reads from an MD patient with the pathogenic m.3243A>G variant at 11.6% heteroplasmy (blue arrow) and a single read showing an m.3240C>T artefact with a base quality of 30 (red arrow). B: By default, FreeBayes merges variants on the same haplotype, thus creating apparent heteroplasmic multi-nucleotide variants. Of the 930 total reads, 822 match the CAGA reference sequence, one matches the TAGG sequence, and 107 match the relevant pathogenic CAGG sequence. Most variant annotation tools, including variant effect predictor (VEP), which is used by mity, would fail to annotate this as the well-known pathogenic m.3243A>G variant, as has occurred in this instance. C: After applying variant normalisation through mity-normalise, this multi-nucleotide variant can be decomposed into the m.3240C>T variant with just one supporting read (red), and the pathogenic m.3243A>G variant with 108 supporting reads (blue). Most variant annotation tools would now correctly recognise and annotate the m.3243A>G variant as pathogenic, as in this instance.
