Detecting Myocardial Infarction by Electrocardiogram Machine Learning Models with Greater Accuracy; A Technical Advance Article
Article Information
Sudaraka MDS1, Abeyagunawardena IA1, De Silva ESK1, Abeyagunawardena S2
1Faculty of Medicine, University of Peradeniya, Sri Lanka
2Department of Medicine, Faculty of Medicine, University of Peradeniya, Sri Lanka
*Corresponding Author: S. Abeyagunawardena, Department of Medicine, Faculty of Medicine, University of Peradeniya, Sri Lanka
Received: 15 November 2021; Accepted: 29 November 2021; Published: 08 December 2021
Citation: Sudaraka MDS, S. Abeyagunawardena IA, De Silva ESK, Abeyagunawardena S. Detecting Myocardial Infarction by Electrocardiogram Machine Learning Models with Greater Accuracy; A Technical Advance Article. Cardiology and Cardiovascular Medicine 5 (2021): 663-672.
View / Download Pdf Share at FacebookAbstract
Background Electrocardiogram (ECG) interpretation is based on the understanding of cardiac electrical patterns. Machine learning (ML) techniques have been used to interpret ECGs, however, there is a lacuna in models able to identify the timing and affected cardiac territories with high accuracy. We aimed to utilize machine learning techniques coupled with relevant medical knowledge to create a machine learning model to detect MI with greater accuracy along with affected territory and timing.
Methods A dataset containing 452 ECGs with 279 features from the University of California, Irvine, Machine Learning Repository was utilized. Three machine learning classification models namely Bootstrap Aggregation Decision Trees (BADT), Random Forest (RF) and Multi-layer Perceptron (MLP) were fed with ECG features selected based on the medical knowledge, categorized as normal, acute ischemic changes, old anterior MI and old inferior MI.
Results The RF, BADT and MP models identified normal, acute ischemia, old anterior and old inferior MI with overall accuracies of 91.67% (95% CI: 84.24 – 96.33%), 89.58 (95% CI: 81.68 – 94.89%) and 85.42 (95% CI: 76.74 – 91.79%) respectively. All 3 models identified old anterior MIs with 100% sensitivity and specificity and RF model also identified old inferior MIs with same accuracy.
Conclusion Machine learning models trained utilizing medical knowledge on the ECG changes in myocardial infarction can achieve greater accuracy in detecting MI along with affected area and timing. This study can be expanded by using a more extensive data set, to include more detail regarding timing and territories, as well as the detection and classification of arrhythmias.
Keywords
ECG; Machine learning; Myocardial infarction
Article Details
1. Introduction
Since its development in 1902, Electrocardiography (ECG) has evolved steadily to the cost effective, simple and non- invasive 12 lead ECG used in the modern age, which is one of the most widely used investigations worldwide. It remains a cornerstone investigation in the medical field, utilized for the diagnosis of countless medical conditions including cardiac conditions such as acute coronary syndromes and arrhythmias and non- cardiac conditions such as electrolyte imbalances. A standard 12 lead ECG records information from 6 limb leads namely lead i, ii, iii, aVR, aVL and aVF and 6 chest leads from V1-V6. These leads look at the heart from different directions and record the electrical signals accordingly. The standard ECG has a p wave, QRS complex and t wave [1]. The interpretation of ECG is based on the understanding of normal electrical patterns produced by the electrical activity of the heart and the variations in specific conditions. This pattern recognition process requires targeted knowledge and depends on the ability and training of the interpreter. With the development of machine learning techniques, it is possible to train a model to recognize these patterns and interpret the ECG tracing. There have been models reported which aimed to detect arrhythmias by classifying ECGs as normal and abnormal and to narrow down the specific arrhythmia by classifying them into multiple classes [2,3]. However, as a review done in 2017 reveals, studies regarding myocardial infarction (MI) and the affected territory are few [4]. A vast amount of information can be gathered using the ECG, from the presence of an MI up to the affected area, timing and complications. The ECG changes of an MI depend on the lead and the timing and may include tall T waves in the initial stage, ST segment elevation, left bundle branch block, prolonged QRS complex, increased heart rate (reduced R-R interval) and q waves in an old MI. According to the affected territory, these changes may be seen in different leads. For example, in leads ii, iii and aVF in an inferior MI and in the chest leads in an anterior MI [5]. Therefore, with these changes in mind utilizing the medical knowledge of ECG changes in MI, we aimed to create a machine learning model to detect MI along with the information regarding the affected territory and timing.
2. Materials and Methods
The dataset used was obtained from University of California, Irvine (UCI) Machine Learning Repository, which contained 279 predictor variables of 452 observations [6]. The variables included age, sex, height, weight and attributes derived from standard 12 lead ECG tracings. Each observation had been assigned one of sixteen possible outcomes. The original dataset was filtered to obtain observations categorized as Normal (class 1), Ischemic changes (class 2), Old Anterior Myocardial Infarction (class 3) and Old Inferior Myocardial Infarction (class 4), excluding other classes which contained a very few number of observations. The dataset was randomly split into a training set (70%) and a test set (30%). Ninety-nine features were selected based on the ECG changes that are observed following a myocardial infarction. They are heart rate, the amplitudes of q, R and T waves and the durations of the QRS complexes along with the age and the sex of the subject as summarized in Table 1.
|
Feature |
Number of leads |
Number of predictors |
|
|
Age |
1 |
||
|
Sex |
1 |
||
|
Heart rate |
1 |
||
|
Amplitudes |
Q wave amplitude |
12 |
12 |
|
R wave amplitude |
12 |
12 |
|
|
T wave amplitude |
12 |
12 |
|
|
QRS Duration |
Q wave duration |
12 |
12 |
|
R wave duration |
12 |
12 |
|
|
S wave duration |
12 |
12 |
|
|
R' wave duration |
12 |
12 |
|
|
S' wave duration |
12 |
12 |
|
|
Total |
99 |
||
Table 1: Features selected with the number of predictors
26 predictors (R’ and S’ waves of all the 12 leads and Q wave amplitudes of V2 and V3 leads) that had near-zero variance across the observations were excluded. The selected 73 features were scaled and centered to have a mean of 0 and standard deviation of 1.
Three machine learning classification models (Bootstrap Aggregation Decision Trees, Random Forest, Artificial Neural Network) were trained using the training dataset, following data up-sampling to overcome class imbalances, optimizing for the Kappa statistic, which is a measurement of inter-rater reliability which takes the possibility of percentage agreement occurring by chance, into account.
Parameter tuning of the models was done with 10-fold repeated cross validation. Cross validation folds were sampled identically to make inter-model performance evaluation possible using accuracy and Kappa statistics
Performance of the final model was evaluated using sensitivity, specificity, positive predictive value, negative predictive value and balanced accuracy for each class for the test dataset. The evaluation metrics are summarized below.
Accuracy = Number of correct predictions / The total number of predictions
Sensitivity = True positive / (True positive + False negative)
Specificity = True negative / (True negative + False positive)
Positive predictive value = True positive / (True Positive + False positive)
Negative predictive value = True negative / (True negative + False negative)
3. Results
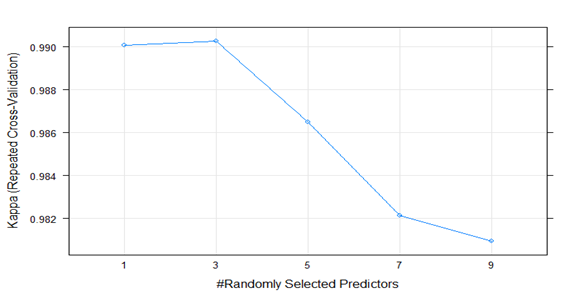
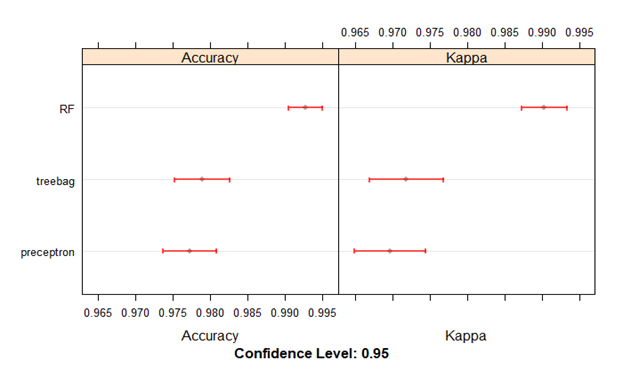
The Bootstrap Aggregation classifier had a mean accuracy of 0.98 and a mean Kappa value of 0.97 for the 100 cross validation resamples. The Random Forests model yielded the highest cross validation accuracy (0.99) and Kappa metric (0.99) out of the three models, with 3 randomly selected variables for splitting each tree node as illustrated in figure 1.
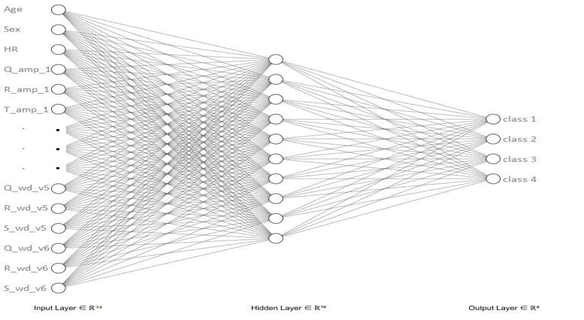
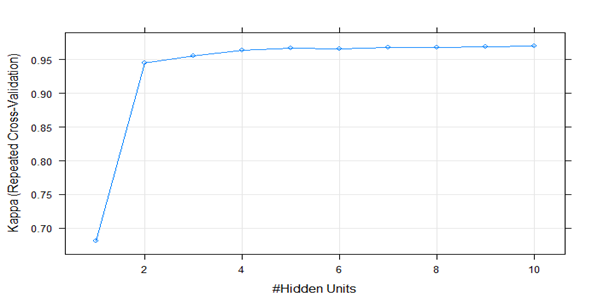
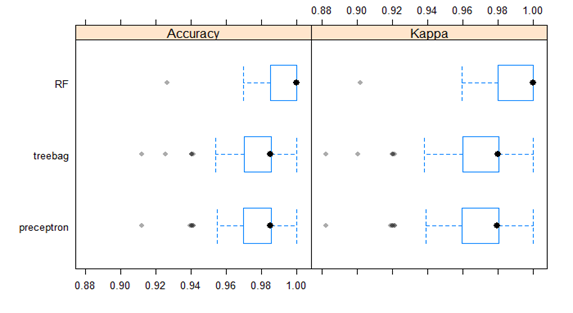
The Feed forward Artificial Neural Network was a Multi-layer Perceptron with one hidden layer and the architecture is depicted in figure 2. This model yielded the highest cross validation accuracy (0.98) with 10 hidden units as illustrated in figure 3. The distributions of the evaluation metrics of the cross-validation samples of the three models were as follows (Figure 4).
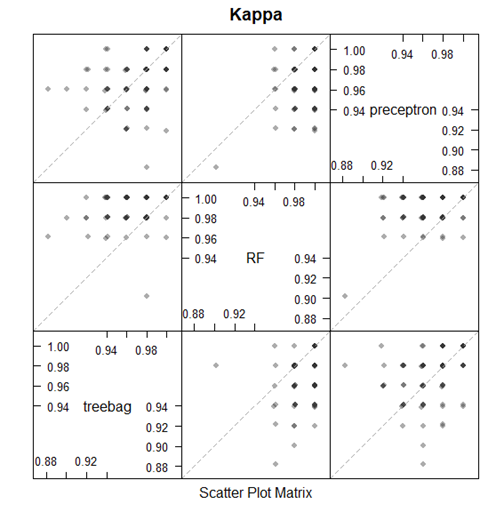
Box-and-whisker plots of the resampling distributions of the accuracy and the Kappa between the models is depicted in figure 5 and the scatter plot matrix of the resampling distributions of the Kappa between the models is represented in figure 6.
All the three models were found to have excellent cross validation accuracies. The previously unseen test data split was used to evaluate the final model performances. The Random Forests model predicted the classes of the test dataset with an overall accuracy of 0.92 (95% CI 0.84 - 0.96) with 100% sensitivity and specificity for identifying old anterior and old inferior myocardial infarctions. The overall accuracies of the Bootstrap Aggregation Decision Trees and the Multi-layer Perceptron models were 0.90 (95% CI 0.82 - 0.95) and 0.85 (95% CI 0.77 - 0.92). Both these models could identify old anterior myocardial infarctions with 100% sensitivity and specificity. The confusion matrices and evaluation metrics of the three models are summarized below in tables 2-7.
|
Class 1 |
Class 2 |
Class 3 |
Class 4 |
|
|
Class 1 |
71 |
6 |
0 |
0 |
|
Class 2 |
2 |
10 |
0 |
0 |
|
Class 3 |
0 |
0 |
5 |
0 |
|
Class 4 |
0 |
0 |
0 |
2 |
Table 2: Confusion matrices of the Random Forests model
|
Sensitivity |
Specificity |
Pos Pred Value |
Neg Pred Value |
Balanced Accuracy |
|
|
Class 1 |
0.97 |
0.74 |
0.92 |
0.9 |
0.86 |
|
Class 2 |
0.63 |
0.98 |
0.83 |
0.93 |
0.8 |
|
Class 3 |
1 |
1 |
1 |
1 |
1 |
|
Class 4 |
1 |
1 |
1 |
1 |
1 |
Table 3: Evaluation metrics of the Random Forests model
|
Class 1 |
Class 2 |
Class 3 |
Class 4 |
|
|
Class 1 |
69 |
7 |
0 |
1 |
|
Class 2 |
1 |
10 |
0 |
1 |
|
Class 3 |
0 |
0 |
5 |
0 |
|
Class 4 |
0 |
0 |
0 |
2 |
Table 4: Confusion matrices of the Bootstrap Aggregation Decision Trees
|
Sensitivity |
Specificity |
Pos Pred Value |
Neg Pred Value |
Balanced Accuracy |
|
|
Class 1 |
0.1 |
0.69 |
0.9 |
0.95 |
0.84 |
|
Class 2 |
0.59 |
0.98 |
0.83 |
0.92 |
0.78 |
|
Class 3 |
1 |
1 |
1 |
1 |
1 |
|
Class 4 |
0.5 |
1 |
1 |
0.98 |
0.75 |
Table 5: Evaluation metrics of the Bootstrap Aggregation Decision Trees
|
Class 1 |
Class 2 |
Class 3 |
Class 4 |
|
|
Class 1 |
65 |
8 |
0 |
4 |
|
Class 2 |
2 |
10 |
0 |
0 |
|
Class 3 |
0 |
0 |
5 |
0 |
|
Class 4 |
0 |
0 |
0 |
2 |
Table 6: Confusion matrices of the Multi-layer Perceptron
|
Sensitivity |
Specificity |
Pos Pred Value |
Neg Pred Value |
Balanced Accuracy |
|
|
Class 1 |
0.97 |
0.58 |
0.84 |
0.89 |
0.78 |
|
Class 2 |
0.56 |
0.97 |
0.83 |
0.91 |
0.76 |
|
Class 3 |
1 |
1 |
1 |
1 |
1 |
|
Class 4 |
0.33 |
1 |
1 |
0.96 |
0.67 |
Table 7: Evaluation metrics of the Multi-layer Perceptron
4. Discussion
The UCI machine learning dataset has been utilized by previous studies for the detection of heart disease, mainly arrhythmias. A modular neural network model was proposed by Jadhav et al., aimed to detect arrhythmias by classifying the ECG tracings as ‘normal’ and ‘abnormal’. It was found that the model classified the tracings into the two classes with 82.22% accuracy [2]. Batra et al., also utilized multiple machine learning algorithms for the classification of arrhythmias however, in this study, into multiple classes. The maximum accuracy achieved was 84.82% using Support Vector Machine (SVM) algorithm and gradient boosting, in conjunction [3]. A model proposed by Mitra et al., utilized neural networks for the classification of arrhythmias into ‘normal’ and ‘arrhythmia’. It was found that an accuracy of 87.71% was achievable using this method [7]. A notable characteristic in the above models is that the feature selection was not performed based on medical knowledge regarding the diseases but rather by mathematical feature reduction techniques, mainly with correlation-based feature subset selections. It is possible that this may be responsible for the relatively similar accuracies which do not exceed 90%. Furthermore, this data set has not been utilized specifically for the detection of myocardial infarctions and its subsets. It is evident by our study that the detection and classification of myocardial infarction with regard to timing and territory can be achieved with a relatively higher accuracy. The overall accuracies obtained by Random Forests, Bootstrap Aggregation Decision Trees and Multi-layer Perceptron were 0.92, 0.90 and 0.85 respectively. The better model performances observed in our study may be attributed to the feature selection technique utilized, which was predominantly based on the known electrophysiological changes occurring during an MI. The availability of an interpretation along with the tracing would be of paramount importance in conditions like myocardial infarctions where time is of the essence. The need to wait for trained personnel for the interpretation of ECG can be avoided and hence delays minimized. Patients requiring emergent care can be identified in settings with a large patient load. In addition, implanted cardioverter defibrillators (ICDs) and pacemakers of patients can also be equipped with this technique, enabling the detection of MI as well. Hence, it is evident that further studies to explore the boundaries of these new upcoming leaps in technology should be performed for the improvement of medical diagnostics.
5. Conclusion
Machine learning models trained utilizing medical knowledge on the ECG changes in myocardial infarction can achieve greater accuracy in detecting MI along with affected area and timing. This study can be expanded by using a more extensive data set, to include more detail regarding timing and territories, as well as the detection and classification of arrhythmias.
Declaration of interest
The authors declare no conflicts of interest.
References
- Tarek Ajam, Mehdirad A, Mary L Windle, et al. Electrocardiography: Overview, ECG Indications and Contraindications. Medscape (2020).
- Jadhav S, Nalbalwar S, Ghatol A. ECG arrhythmia classification using modular neural network model. 2010 IEEE EMBS Conference on Biomedical Engineering and Sciences (2010).
- Batra A. Classification of Arrhythmia Using Conjunction of Machine Learning Algorithms and ECG Diagnostic Criteria (2016).
- Roopa C, Harish B. A Survey on various Machine Learning Approaches for ECG Analysis (2017).
- Burns E, Mike C. Myocardial Ischaemia. Life in the first line. ECG Library Diagnosis (2020).
- Altay GH, Burak A, Gulsen D, et al. A Supervised Machine Learning Algorithm for Arrhythmia Analysis. Proceedings of the Computers in Cardiology Conference, Lund, Sweden (1997).
- Mitra M, Samanta R. Cardiac arrhythmia classification using neural networks with selected features. Procedia Technology 10 (2013): 76-84.
- McHugh ML. Interrater reliability: the kappa statistic. Biochem Med 22 (2012): 276-282.

