Whole Genome Sequencing of Hematologically Stained Cells Catapulted from Cell Smears
Article Information
Sangwook Bae1*, Yushin Jung2*, Sungsik Kim3, Jinhyun Kim3, Amos Chungwon Lee1, Dongsoon Lee4,5,6†, Sunghoon Kwon1,3†
1Bio-MAX/N-Bio, Seoul National University, Daehak-dong, Gwanak-gu, Seoul 151-742, Republic of Korea
2ATG Lifetech, A-909, Lionsvalley, 168, Gasandigital 1-ro, Geumcheon-gu, Seoul, 08589, Korea
3Department of electrical and computer engineering, Seoul National University, Daehak-dong, Gwanak-gu, Seoul 151-742, Republic of Korea
4Department of Laboratory Medicine, Seoul National University Hospital, Seoul National University College of Medicine, 101, Daehak-ro Jongno-gu, Seoul, 110-744, Republic of Korea
5Cancer Research Institute, Seoul National University College of Medicine, Seoul, Republic of Korea
6Genomic Medicine Institute, Seoul National University Medical Research Center, Seoul, Republic of Korea
*These authors contributed equally to the work.
*Corresponding author: Lee DS, Department of laboratory medicine, Seoul National University College of Medicine, Yeongeon-dong, Jongno-gu, Seoul 110-744, Republic of Korea
Kwon S, Bio-MAX/N-Bio, Seoul National University, Daehak-dong, Gwanak-gu, Seoul 151-742, Republic of Korea
Received: 27 October 2022; Accepted: 03 November 2022; Published: 31 January 2023
Citation: Sangwook Bae, Yushin Jung, Sungsik Kim, Jinhyun Kim, Amos Chungwon Lee, Dongsoon Lee, Sunghoon Kwon. Whole Genome Sequencing of Hematologically Stained Cells Catapulted from Cell Smears. Archives of Clinical and Biomedical Research 7 (2023): 28-44.
View / Download Pdf Share at FacebookAbstract
Analyzing archived peripheral blood smears is a potential route towards gaining cell morphology and genome information of blood cell types from various diseases. Yet, acquiring whole genome information from morphologically targeted cells was difficult, especially for rare cell types. The main causes for such difficulty were the inevitable usage of cell stains leading to whole genome amplification inhibition, and insufficient cell isolation performance of previously introduced laser microdissection (LMD) techniques. Here, we introduce a new laser-based cell isolation technique and a whole genome amplification (WGA) protocol optimized for whole genome analysis from minute input of hematologically stained cells. We were able to perform whole genome copy number profiling and SNP analysis from as little as 5 cells.
Keywords
Blood Smear; Hematologically Stained Cells; Laser Microdissection; Whole Genome Sequencing
Blood Smear articles; Hematologically Stained Cells articles; Laser Microdissection articles; Whole Genome Sequencing articles
Article Details
1. Introduction
Peripheral blood smears provide cell morphology-based information at the single cell level. These cytology specimens are used for counting morphologically abnormal cells, or measuring the composition of heterogeneous cell population [1, 2]. When diagnosing leukemia or lymphoma, these samples guide additional tests needed and treatment options, thus reducing potential waste of resources. And since cell smears well preserve cell morphology and genomic contents over long periods, patient cell smears are often archived in large hospitals. Therefore, these archives are potential route to large scale genomic studies. Many genetic tests analyze mutations in only a small number of genes known to be related to disease of interest [3]. But such gene set selection becomes difficult when there exists patient-to-patient heterogeneity or variance in mode of disease inheritance [4-6]. Although many genetic tests have been introduced such as FISH [3,7-9] and in-situ sequencing [10-12] adapting whole exome sequencing (WES) or even whole genome sequencing (WGS) is becoming the most desirable approach because they provide both high sensitivity and coverage [13]. Furthermore, when investigating cancer and other diseases that may have occurred from cells with rare genomic instabilities (e.g. somatic mutation), it becomes important to enable WGS even with small number of cells. Therefore, future healthcare systems will greatly benefit from low-cell-input WGS applied to archived blood smear cells. Performing genetic analysis on smeared cells usually requires transferring target cells on slide glass into small volume suspensions, which is usually done with infrared (IR) laser-based microdissection (LMD). But LMD systems, whether UV or IR mode, requires contour dissection that frequently leads to target cell damage or neighboring cell contamination when applying to compact tissues and incompletely dissociated cytological specimens [14-17]. And due to other technical hurdles, previous genetic analysis on such LMD-isolated blood smear cells were mostly multiplexed PCR and sequencing [14,18,19] and, to our knowledge, WGS reports are still lacking. There are two hurdles we need to overcome. First, cell stains, such as H&E, which are indispensable for morphology analysis are known to hamper DNA amplification efficiency [20-23] unless amplification is preceded by DNA purification [24-25]. But most DNA purification methods are not feasible for minute cell input. So a robust whole genome amplification (WGA) protocol that produces whole genome coverage even from a small number of stained cells is needed. Second, when isolating cells from glass slides, IR LMD suffers from low cell isolation resolution (7.5μm laser diameter [14]) compared to UV based LMD, which could lead to retrieval of off-target cells when applying to compact tissues, or incompletely dissociated cytological specimens [15,16]. Previously, our group introduced a high throughput IR laser-aided cell isolation and sequencing system that obtained higher cell isolation throughput and better genomic DNA quality than conventional LMD or laser pressure catapulting (LPC) systems [26-27]. Based on our previous invention, here, we introduce a dissection-free, single cell laser isolation system and a WGA protocol optimized for blood smear samples. The isolation system increases the isolating speed and resolution of the single cell-catapulting force while minimizing damage of laser-isolated cells. We introduce a guideline of cell isolation, cell lysis, and WGA that allows whole genome copy number (CN) profiling and SNP detection from samples containing as little as 5 blood smear cells. We provide information regarding which cell staining material is preferred, the minimum number of cells required, and proper blood smear storage condition for high quality whole genome analysis similar to bulk whole genome sequencing. We remark that the entire workflow is adaptable to routine blood smear diagnosis.
2. Materials and Methods
2.1 Materials
ITO coated glass was ordered from Fine Chemical Industry, with different sputtering thickness of ITO coating layer; 150 nm and 300 nm. Trypan blue (Cat. no. T8154), Accustain Giemsa (Cat. no. GS500) and Wright Giemsa (Cat. no. WG16) was purchased from Sigma Aldrich. Hemacolor was purchased from Merck (Cat. no. 111661). Whole genome amplification kit that contains sample buffer, denaturation solution, neutralization buffer, reaction buffer, and MDA enzyme mix was purchased from GE (Illustra Genomiphi V2 DNA amplification kits, Cat. no. 25-6600-30). SYBR green I was purchased from Life Technologies (Cat. no. S7563). PCR master mix was purchased from the New England Biolabs (Quick-Load® Taq 2X Master Mix) or from KAPA Biosystems (KAPA HiFi HotStart ReadyMix, 2X). DNA purification kit was purchased from Beckman Coulter (Agencourt AMPure XP kit, Cat. no. A63880). Proteinase K was purchased from Sigma Aldrich (Cat. no. P4850-1ML).
2.2 Cell Samples
Blood samples and FISH stained samples were provided by prof. Lee at SNUH. Tissue stamped sample was provided by prof. Han at SNUH. HL60 cell line was cultured as recommended in the ATCC standard protocol. In brief, cells were cultured in Iscove's Modified Dulbecco's Medium (IMDM) supplemented with 20% FBS and 1% Penicillin-Streptomycin. Cells were cultured in a 37°C, 5% CO2 conditioned incubator. Cell medium was changed to fresh medium every 2~3 days to maintain cell concentration of 105~106 cells/mL.
2.3 Blood Smear
A 10uL drop of blood or cell sample (105-106 cells / mL) was dispensed near the corner of a bare glass slide or an ITO glass slide. Another glass slide was held on a 45° angle towards the sample droplet. While maintaining contact with the bottom slide, the top glass was pulled back to contact the drop. Immediately after droplet contact, the top glass slide was pushed forward in one motion while maintain firm contact and angle with the bottom slide. The resulting smear was left at ambient condition until fully dried.
2.4 Cell Staining
We performed two different Giemsa staining methods; one acquired from SNUH and the other from Sigma-Aldrich. We also performed Hemacolor staining and Trypan Blue staining method as well. Staining, other than the Giemsa from SNUH, was performed as suggested by the manufacturer. Giemsa staining protocol from SNUH was as follows. Cells were first smeared on bare glass or ITO glass using the blood smear method described above. After air drying, the slide was dipped into 100 % methanol for 30 seconds for fixation. Immediately, the slide was then dipped in Giemsa staining solution for 7 minutes. Then it was rinsed with phosphate-buffer saline (PBS) solution and then with deionized water. The slide was then fully dried in ambient condition and stored in -20°C until further experiment.
2.5 Laser Microdissection and Lysis of Cells
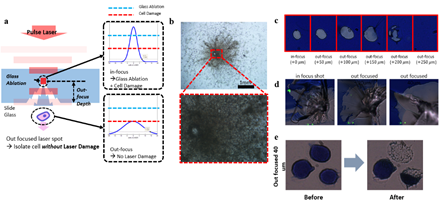
Pulse width of the IR laser was 7~10 nanoseconds with wavelength 1064 nm. For the bare glass experiment, we first ablated the surrounding contour of the target cell and isolated the cell by a single pulse laser to reduce heat damage. Focusing the laser directly on target cells completely destroyed the cells with large traces of burned remnants (figure S1). To weaken the interaction between the laser pulse and the cell, we adjusted the focus of the laser to the inside of the glass slide and deliver out-focused pulses to the target cell (figure S1). To determine the optimal out-focusing depth, we tested multiple focuses from surface (0um) to 250um away from the surface into the depth of the glass slide. We heuristically found that 40um out-focusing leads to localized splintering of the glass surface and isolation of targeted cells with minimum damage (figure S1). For ITO glass experiments, infrared laser was exposed to the target area, evaporating the ITO layer and discharging the target cells of the region. 8 strip PCR tube caps were used as cell retrievers and were pre-treated with air plasma for 30 seconds to make the surface hydrophilic. We mixed 0.5 uL of proteinase K to 7ul of Sample Buffer provided in the genome amplification kit. This mixture was preloaded on the plasma treated retrieving cap. After isolating cells, the cap was connected to a PCR tube and spin down for 1 minute on a mini centrifuge. Enzymatic lysis was then performed on a 50°C heated thermo-cycler for 1 hour. Proteinase K was then inactivated by incubating at 70°C for 10 minutes.
Supplementary Figure 1: Trial of isolating cells on bare glass slide. Cells were isolated by either in-focused pulse laser or out-focused pulse laser (a). b. Result of in-focused laser isolation showing significant cell damage by high energy. Lower figure is the the magnified view of the red square in the upper figure. d. Isolation of dummy sample (blue ink) at various out-focusing depth with low laser power (c) and high laser power (d). e. Cell isolation with a 40um out-focused pulse laser. Scale bars are 10um.
2.6 Whole Genome Amplification and Next Generation Sequencing
Lysed samples were then incubated at 95°C for 3 minutes to denature double strand DNA and immediately cooled to 4°C to anneal random hexamers. Samples were then mixed with a pre-mixture of 1uL of denaturation solution plus 1uL of neutralization buffer, 9uL of reaction buffer, 1uL of MDA enzyme mix, and 0.2ul of SYBR green I (diluted 1000 times in nuclease free water). Samples were then incubated in a qPCR cycler at 30°C for 90 minutes for MDA reaction, heated to 65°C for 10 minutes to inactivate the enzyme, and cooled to 4°C. The amplified products were purified with AMPure XP kit as suggested by the producer. Amplification quality of each sample was roughly measured by performing PCR validation against 8 selected SNPs across the genome. Among the 8 SNPs, 6 were homologous SNP sites for HL60, 1 was a heterologous SNP for HL60, and 1 was a reference specific site. Validity of the primer design was verified by performing PCR against bulk genomic DNA purified from 106 HL60 cells. We selected samples that produced successful PCR amplicons from all 8 SNP sites for downstream NGS analysis. NGS library was prepared with a SPARK DNA Sample Prep kit and sequenced by a local service company (Celemics, Inc., Korea) using Illumina Miseq machine (with a 250bp paired end reading mode).
2.7 Leukemia Panel
Leukemia target panel was designed by prof. Lee at SNUH. The panel contains 643 SNPs where 205 are HL60 specific, 171 are K562 specific, and 267 target both cell lines. From this original panel, we generated a refined panel by collecting SNPs that existed in our cultured cell line samples using bulk genomic DNA target sequencing.
2.8 Genome Coverage and CNV Analysis
Genome coverage was plotted by normalized sequencing depth. We used a fixed bin size of 9000 bp, resulting in 343,964 bins along the human whole genome (hg18). From a group of randomly selected reads, each read was assigned to its corresponding genome bin. The number of bins containing more than one aligned read was normalized by the total number of bins to calculate the normalized coverage. CNV was computed based on a public method [25]. We neglected the Y chromosome aligned reads.
2.9 Storage Condition Test
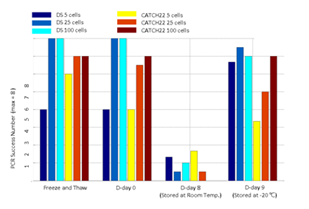
Three blood smear replicates were prepared from a Down syndrome patient’s blood sample and a CATCH 22 patient’s blood sample. Each slide was treated with a different storage condition before cell isolation and WGA experiments. For each sample, one smear was intentionally put under 20 cycles of -20°C freezing and thawing. The other two smears were either stored at room temperature for 8 days or -20°C for 9 days. From each smear we isolated 5 cells, 25 cells per sample with 3 replicates and 100 cells per sample with two replicates. After WGA, we performed 8 selected loci PCR validation to crudely measure WGA quality of each sample.
3. Results
3.1 Laser Isolation of Cells on Conventional Glass Slide
Most researchers and pathologists observe thin slices of tissues or single cell layers of blood samples attached on conventional slide glasses. Therefore, we first aimed to isolate targeted cells on bare glass slides by selectively ablating the glass segment carrying the targeted cell(s). We utilized our previously developed custom LMD device that generates shape-controlled infrared laser pulses [26,27]. In contrast to UV based laser microdissection, our infrared based method causes no damage to the nucleic acids. The shape and size of the optic front of the pulse is controlled by adjustable optical field stops. However, the isolated cells were damaged by the high power of the nanosecond laser (Figure S1). This is because nanosecond time scale is long enough to occur extra radiation, ionization, vaporization and convection which decreases absorbance constant of the glass [28].
3.2 Laser Isolation of Cells on ITO Glass Slide
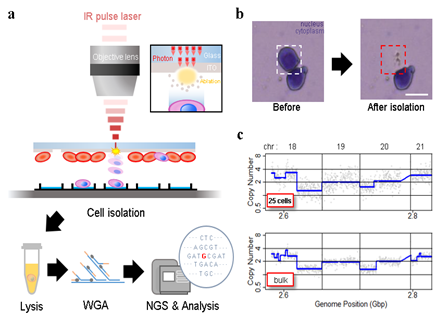
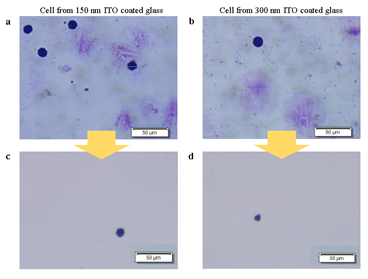
Next, we devised a glass slide coated with a sacrificial layer made of indium tin oxide (ITO) (Figure 1). This sacrificial layer, which is conventionally used as electrical path patterning, has a high energy absorption rate and thus prevents cell damage. It is also transparent and sustains clear visualization of the samples. Also, compared to commercial LMD products that utilizes polyethylene naphthalene (PEN) films, ITO glasses do not suffer from buckling, tearing, or cause sample visibility disturbance. Importantly, ITO has higher energy absorbance rate of IR light than visible light [29]. And since nucleic acids have lower absorbance at visible- or infrared-light compared to UV [30], isolating cells on ITO glass slides with IR laser would be ideal. To test this new approach, we prepared HL60 cell line smears on ITO glasses and stained with Giemsa, which is a widely used hematological staining material. For both ITO layer thickness of 150nm and 300nm, laser isolated cells were retrieved without significant damage (figure S2), suggesting that the scheme works without critical dependency on ITO thickness. In case where targeted cells are not well separated from background cells, decreasing the laser spot size while increasing laser power was sufficient to ensure isolation of target cells only. This indicates that our ITO glass based LMD provides superior target specificity over conventional LMD.
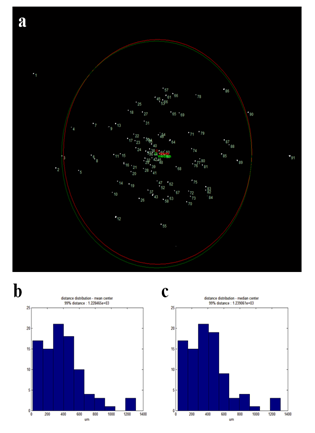
To verify that laser isolated cells are safely retrieved to retrieving cargos (such as slide glass or tube cap), we decided to analyze the dispersity of isolated cells. For this, we prepared H&E stained HL60 cells smeared on an ITO glass and then retrieved one hundred laser isolated cells onto a glass slide. The retrieved cells formed a cluster on the glass slide that was placed 1mm away from the smear sample slide. Dispersity was calculated by measuring the average distance between each retrieved cell and the center (mean or median) of the cluster. Out of the 100 isolated cells, 91 were retrieved on the glass slide. Of those cells, 89 cells were within 1mm radius (or 6σ of a normal distribution). 99% of observed cells were found within 1.25mm radius (figure S3). Since a typical 96 well or PCR tube caps have a diameter around 9mm, our device ensures robust cell isolation into retrieving cargos.
Figure 1: Experiment set-up and representative results. A) Schematic of the IR pulse-laser based cell isolation system and the downstream workflow. B) Representative result of isolating a single cell from a Giemsa stained HL60 cell line sample. C) Representative plot of copy number analysis of K562 cells. The copy number profile obtained from 25 laser-isolated cell sample is comparable to the profile from bulk genomic DNA.
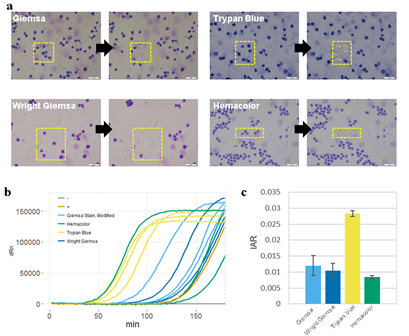
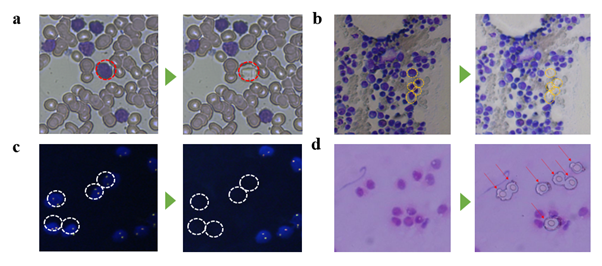
Figure 2: Cell staining protocol affects whole genome amplification efficiency. A) Images of cells stained with different staining protocols and smeared on ITO glasses. Yellow boxes indicate laser-targeted cells before (left) and after (right) laser isolation. Scale bars are 50um. B) qPCR plot of the whole genome amplification of 5 cell samples. Positive control (+) is a 6pg of purified genomic DNA from bulk HL60 cells. Negative control (-) is a non-template control. C) Calculated initial amplification rates (IARs) from qPCR plots in (b).
3.3 Genome Amplification of Retrieved Cells
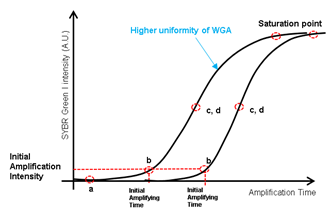
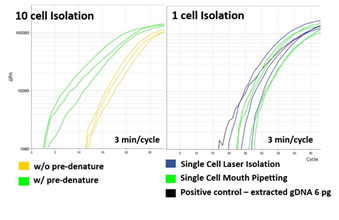
High quality whole genome amplification (WGA) is essential when dealing with low genome input. We modified the lysis and WGA protocol of a commercial kit (GE’s Illustra Genomiphi V2 DNA amplification kit) to increase amplification efficiency. We chose WGA uniformity (i.e. hexamers for MDA annealing uniformly across the whole genome) as an important criteria of high quality WGA. So, with a fixed genomic DNA input, we assumed that more uniform WGA would lead to higher initial amplification rate (IAR, the number of elongating amplicons) measured by real time PCR (figure S4). Amplification rate during subsequent exponential phase should be indistinguishable between high IAR samples and low IAR samples because the intrinsic strand displacement and renewed hexamers annealing characteristic of MDA. All together, we predicted that when measured by real-time PCR, higher amplification uniformity would lead to higher IAR, which would lead to faster entrance to the exponential amplification phase [31]. To realize this increase in low cell input WGA efficiency, we first replaced alkaline cell lysis with proteinase K based lysis method. Although alkaline lysis method is widely applied to blood cell analysis, in our experience, the WGA efficiency of low DNA input samples (10 cells per sample) were inconsistent among replicates (figure S5). We suspected that alkaline lysing may have fragmentized long genomic DNA strands and hinder uniform amplification32. We found that by using proteinase K based cell lysis and increasing the incubation temperature from the recommended 37°C to 50°C, higher WGA efficiency was achievable (figure S6). Adding a tapping or vortex step during lysis further improved WGA efficiency, probably by assisting mechanical shearing of the cell and chromatin components (figure S6). Before the MDA step, we also added a DNA denaturing step by incubating the lysate at 95°C for 3 minutes and then cooling to 4°C33. This added denaturing step increased random hexamers annealing efficiency which led to higher WGA efficiency (figure S7. a). We then applied our customized WGA protocol to HL60 single cells isolated with our laser system. For comparison, we performed WGA with 6pg of purified genomic DNA, which is known to be the equivalent amount of DNA from a single cell. The WGA efficiency was comparable between single cells and purified DNA (figure S7. b). We also performed WGA on single cells retrieved by mouth pipetting and also obtained also similar amplification efficiency (figure S7. b). These results proved that our laser-based isolation doesn’t suffer from partial cell retrieval or loss of genomic DNA.
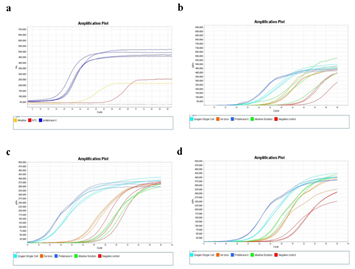
Supplementary Figure 5: Supplementary figure 5. Comparison of different lysing conditions. Real time amplification plot using 50 HL60 cell samples each lysed with different lysing conditions; Qiagen single cell lysis, alkaline lysis, proteinase K lysis, and no lysis as control. a) MDA real time amplification plot comparing alkaline lysis and proteinase K. b-d) PCR real time amplification plots. 3 replicates were conducted per condition, each sample containing 500 HL60 cells. Samples were PCR amplified with primers targeting EGFR (b), MYD88 (c), and 16s rRNA (d). NTC: No template control. Fluorescence signal was measured every 3 minutes.
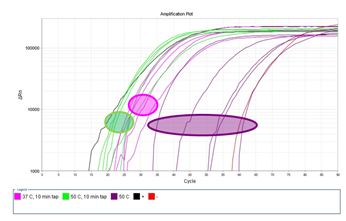
Supplementary Figure 6: Measuring the effect of proteinase K incubation temperature and mechanical tapping during lysis. Single HL60 cells were laser-isolated and lysed with proteinase K at incubating temperature of either 37°C or 50°C. A subgroup of samples were additionally mechanically agitated by tapping the PCR tube several times every 10 minutes during the 60 minute proteinase K incubation. Fluorescence signal was measured every 2 minutes (2 minutes per cycle).
Supplementary Figure 7: Measuring the effect of pre-denaturing and laser-isolation. a) 10 HL60 cell lysate samples that was pre-denatured show higher IAR compared samples not pre-denatured before MDA. b) Comparison of MDA quality among single cell isolated with either micropipette or pulse laser. Positive control was 6pg of purified HL60 genomic DNA.
3.4 Analyzing the Effect of Cell Staining on WGA
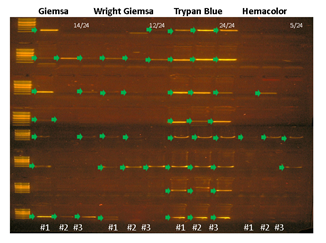
Pathological blood cell tests usually require nucleic or cell membrane staining to distinguish different cell types. We applied our WGA protocol to HL60 cell line samples pre-treated with one of four popular cell staining methods to analyze the effects of staining on amplification efficiency. Unfortunately we were not able to produce high quality DNA amplification from single cells. We suspect that DNA staining molecules might have blocked hexamer annealing and/or polymerase elongation. So instead, we isolated 5 cells per sample and compared the amplification efficiency for 4 different staining methods. We used two criteria; i) the IAR measured from the real-time PCR curve, and ii) percentage of successful target PCR (using WGA products as PCR input). For the second criteria, we prepared a small target PCR panel containing 8 genomic sites across the genome (table S1). The result showed that cell staining generally decreases amplification efficiency (Figure 3). Among the four staining methods, Trypan blue showed the highest IAR and highest PCR success rate, indicating high amplification quality (figure S8). This was expected since Trypan blue stains cell membrane proteins and not the nuclear genomic DNA. However, it is a less popular staining method because cell type recognition usually requires nuclear staining. So although Giemsa, a nuclear staining method, staining showed lower amplification efficiency than Trypan blue, it has an advantage over Trypan blue. Hemacolor, which is known to be a fast and user-friendly staining method, showed the lowest amplification efficiency. Consequently, we decided to use Giemsa staining for further analysis.
|
In-house PCR panel |
||||
|
ChrID |
Position |
REF |
ALT |
Forward/ Reverse primer sequence (5'->3') |
|
2 |
228243905 |
G |
A |
AGGCCCTTCTTCACATCAAGT |
|
AACCAGAAGATTGGGATAAAAGGCA |
||||
|
4 |
2175733 |
A |
G |
TCTAGACCTGCCACTGGGAA |
|
ATGCAGCAGGTGCTGAGTAA |
||||
|
5 |
205565 |
G |
A |
GAGCCACATGAGTCTGCCAT |
|
AGAGCCAGGCTTTTGCTGAA |
||||
|
7 |
25266400 |
G |
A |
ACTGCCCATGCACTTTGACT |
|
CCACACTCCTTCGCCAACTT |
||||
|
10 |
5435918 |
G |
A |
CTTCCTTGGGGACCACATCC |
|
CCCATCGTCTCTGCTGACAA |
||||
|
15 |
4243837 |
T |
C |
GTGTGCGGAAGGTACGGTTA |
|
TTGCTCCTGCTCAGGTCTTG |
||||
|
16 |
20648702 |
G |
A |
GGATGACTGGAGCAGGGAAG |
|
TGGGCAGCATCCATTGAGAG |
||||
|
17 |
7214824 |
C |
T |
TCCCTGGGCCTACTACCTTC |
|
TTTGCCATGGCCTTGATTGC |
||||
|
HL60 cell detection |
|
|
Target gene |
Forward/ Reverse primer sequence (5'->3') |
|
EGFR |
TCC ATC ACC GGT ACC TCC TAC |
|
ACG ACA CAA CAC AAA ATA GCC G |
|
|
MYD88 |
TTG AAG ACT GGG CTT GTC CC |
|
GGT TGG TGT AGT CGC AGA CA |
|
|
16s rRNA |
ACC TGG TTG ATC CTG CCA G |
|
AGG CTC CCT CTC CGG AAT C |
|
Supplementary Table 1: Primer sequence information.
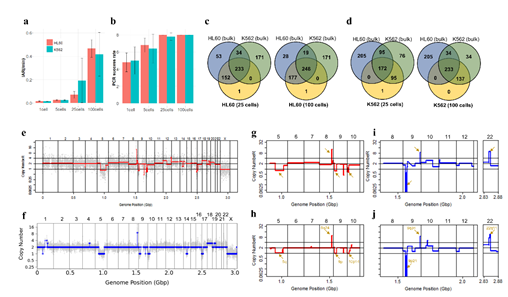
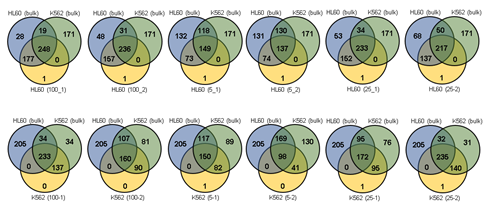
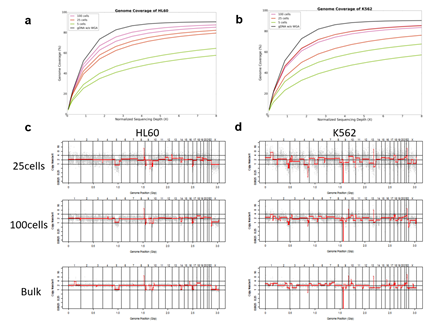
Figure 3: Assessment of WGA quality for various genomic input quantity. 25 cell is sufficient to capture genome-wide profile. a, b) Initial amplification rates (a) and PCR success rate (b) from different samples containing 1,5,25,100 cells (n=3). c,d) Venn diagrams of the number of detected leukemia panel SNPs. Notice that the 25, 100 cell samples selectively detected their cell-type-specific SNPs regardless of the number of cells per sample. e,f) whole genome CN profile obtained from a 25 HL60 cell sample (e) and bulk sample (f). g-j) Magnified image of the CN profile from HL60 cells (g,h) and K562 cells (i,j). Notice that the 25 cell profiles (g,i) are highly concordant to the bulk sample profiles (h,j).
Supplementary Figure 8: PCR success rate is affected by cell staining method. HL60 cells stained with either Giemsa, Trypan Blue, or Hemacolor were isolated 5 cells per sample (3 replicates per staining condition), lysed, and amplified with MDA and PCR amplified with in-house designed 8 region primer panel. Arrows indicate successful PCR bands.
3.5 Assessing WGA Quality for Various Genomic Input Quantity
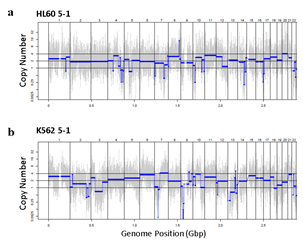
Since Giemsa staining causes significant sequence information loss during WGA, we decided to assess the minimum number of isolated cells per sample required to retain whole genome coverage. So with WGA products from Giemsa-stained cells, we performed target sequencing and low depth whole genome sequencing to measure allele drop-out rate. In detail, from fixed and Giemsa stained HL60 or K562 cells, we isolated 1, 5, 25, 100 cells per sample, amplified it, and performed our 8 selected loci PCR to crudely measure WGA quality. This PCR panel was targeted at six HL60-specific homozygous SNPs, one heterozygous SNP and one reference allele common for both HL60 and K562. Then for each WGA sample we performed leukemia panel target sequencing (method) and low coverage (0.2x) whole genome sequencing (WGS) to assess genome coverage, and copy number variation (CNV). As expected, for both HL60 and K562, IAR improved with increasing number of isolated cells per sample (figure 4. a). This also showed correlation with panel PCR success rate, where more than 90% success rate was achieved when more than 25 cells were isolated per sample (figure 4. b). Sequencing results of these PCR products also showed that samples with 25 or more cells ensure >90% of true positive SNP call rate (figure S9). Leukemia panel target sequencing also showed concurrent results. 100 cell samples showed average 87% and 71% true positive rate (TPR) for HL60 and K562 each. This value tended to decline as the number of cells isolated per sample decreased (figure 4. c, d, S10). 5 cell samples showed the lowest TPR. False positive rate, designated here as incident of calling the opposite cell type specific SNP, was non-existent for all experiments (table S2). With our whole genome sequencing results, we first analyzed genome coverage. Genome coverage of unamplified bulk genomic DNA saturated slightly below 90% whereas the value continuously declined as the number of cells per sample decreased. 25 cell and 5 cell samples showed maximum of 70% and 50% genome coverage (figure S11. a, b). For both HL60 and K562, CNV profiles showed high correlation between bulk sample and 25 cell samples (figure 4. e, f, figure S11 c, d). So even with only 25 cells, characteristic CNVs were detectable such as 5q deletion, 8q24 amplification (related to c-Myc proto oncogene), 9p deletion, and 10p14p11 deletion for HL60 HL60 samples and 9p21 deletion, 9q34 amplification (related to ABL1 proto oncogene), and 22q11 amplification for K562 (figure 4. g, h) as reported [34,35]. 5 cell sample CNV profiles showed frequent allele drop outs and prominent amplification bias (figure S12). In summary, we concluded that isolating more than approximately 25 cells per sample is required to acquire acceptable genome coverage with credible CNV profiling and SNP call of 70~80% TPR. However, higher number of cells per sample or sample pooling may be required for more sensitive mutation or SNP calling experiments.
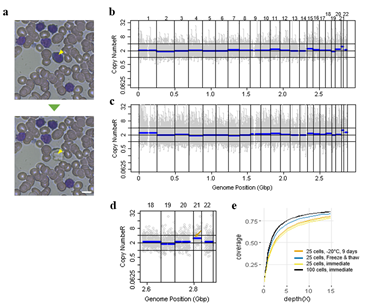
Figure 4: Correct copy number profiling with 25 cells isolated from Down syndrome patient blood smear. a) Representative image of single cell isolation from peripheral blood smear. b, c) whole genome copy number profile from 100 cell sample (b) and 25 cell sample(c). Cells were laser-isolated immediately after blood smear has been delivered from the hospital. d) Copy number profile of a 25 cell sample obtained from a freeze-thaw cycled blood smear. The arrow indicates the expected chromosome 21 trisomy. e) Genome coverage plot of cells isolated from differently treated blood smear slides. Blood was collected from a Down syndrome patient.
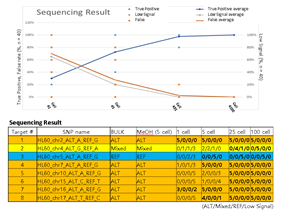
Supplementary Figure 9: Sequencing results of HL60 specific SNP targeted PCR products used in figure 3b. True positive rate was calculated as the percentage of replicate samples (among 5 replicates) that sequenced the targeted SNP. Target number 1,4-8 are homozygous SNPs whereas number 2 is a heterozygous SNP and number 3 was a reference control site. Mixed signal indicates detection of both reference and alternative SNP sequence. Low signal indicates insufficient detection of read signals.
|
HL60 SNPs |
HL60 specific SNPs |
K562 specific SNPs |
|||||
|
Samples |
Detected SNPs |
% |
count |
% |
Detected SNPs |
% |
Exception |
|
HL60_100-1 |
425 |
90.04% |
177 |
86.34% |
0 |
0.00% |
1 |
|
HL60_100-2 |
393 |
83.26% |
157 |
76.59% |
0 |
0.00% |
1 |
|
HL60_25-1 |
385 |
81.57% |
152 |
74.50% |
0 |
0.00% |
1 |
|
HL60_25-2 |
350 |
74.15% |
137 |
66.83% |
0 |
0.00% |
1 |
|
HL60_5-1 |
222 |
47.03% |
73 |
35.61% |
0 |
0.00% |
1 |
|
HL60_5-2 |
211 |
44.70% |
74 |
36.10% |
0 |
0.00% |
1 |
|
K562 SNPs |
HL60 specific SNPs |
K562 specific SNPs |
|||||
|
Samples |
Detected SNPs |
% |
count |
% |
Detected SNPs |
% |
Exception |
|
K562_100-1 |
370 |
84.47% |
0 |
0.00% |
137 |
80.12% |
0 |
|
K562_100-2 |
250 |
57.08% |
0 |
0.00% |
90 |
52.63% |
0 |
|
K562_25-1 |
267 |
60.96% |
0 |
0.00% |
95 |
55.56% |
1 |
|
K562_25-2 |
375 |
85.62% |
0 |
0.00% |
140 |
81.87% |
1 |
|
K562_5-1 |
232 |
52.97% |
0 |
0.00% |
82 |
47.95% |
1 |
|
K562_5-2 |
139 |
31.74% |
0 |
0.00% |
41 |
23.95% |
0 |
Supplementary Table 2: Leukemia SNP panel target sequencing result.
* Exception: SNP not detected in bulk control but detected in sample.
* Entire (HL60 and K562) SNP panel: 643
* HL60 SNPs: 472
* K562 SNPs: 438
* HL60 specific SNPs in panel: 205
* K562 specific SNPs in panel: 171
3.6 Genome Scale Copy Number Analysis using Pathological Blood Smears
We then demonstrated CNV analysis using patient blood smears. We collected blood from a Down syndrome (DS) patient and, in less than 12 hours, smeared onto ITO coated glasses and performed fixation and Giemsa staining. We isolated 25 cells, 100cells per sample and performed WGA and low coverage WGS as before. Clearly, the characteristic trisomy of chromosome 21 was observed as expected for both 25cell and 100cell samples (figure 4. b-d). In practice, pathological blood smear slides tend to be stored at room temperature for up to several days before actual pathological observation. This may be acceptable for conventional cell morphology analysis but may hamper genome integrity as well as quality of genomic tests. So for practical purposes, we investigated the effect of blood smear sample storing condition to genome integrity. We tested three conditions; room temperature storage for 8 days, -20°C storage for 9 days, and twenty freeze-thaw cycling. Panel PCR experiment showed that room temperature storage leads to significant reduction in PCR success rate compared to -20°C storage. Repeated freeze-thawing, albeit with 10 minute intervals, seemed to have minimal effect in genome integrity (figure S13). The overall genome coverage of these blood derived cell was lower than previous cell line samples probably due to impurities in the blood plasma. Noticeably, the genome coverage of cell samples from previously stored at -20°C was comparable to freshly isolated cell samples (figure 4. a). In summary, we successfully analyzed CNV profiles of a patient sample using only a small number of blood smear-derived cells and observed that storing blood smears at -20°C is preferred over conventional room temperature storage.
4. Discussion
Although routine cytology is a huge source of clinical samples, molecular analysis on these samples still has much room for improvement. In case of genome analysis, conventional cell staining molecules hamper the genome amplification process, leading to frequent allele drop-out and loss of clinical information. This is why LMD is usually performed on non-stained solid tissue sections, and an adjacent tissue section stained with H&E is used as a guide for positioning target cells for dissection [36]. However, this indirect, mirroring technique is not applicable to blood tissue since it lacks the required spatial context. We developed a new microdissection method and a whole genome amplification protocol that is effective for hematologically stained cell samples. It enables retrieving single cells without genome loss. We also developed a WGA protocol for such stained cells that enables whole genome CN analysis and SNP detection with a minimum number of 25 collected cells, despite low sequencing depth (0.2X). To our knowledge, this is the smallest number cells achieved for WGS from DNA-stained blood cells. In theory, deep (i.e. 100x depth) sequencing enables DNA mutation detection at the single cell level, which was not possible for previous reports where thousands of cells had to be collected to make WGS possible. However, in a more practical view, further improvement will depend on whole genome amplification quality at the single cell level. The minimum number of cells required for whole genome sequencing will vary with different cell types and staining method. Refining this number based on cell type and staining method of interest may be needed. Future investigation will include applicability of our cell isolation system and WGA protocol to other tissue types such as bone marrow, FISH, and tissue-stamp samples (figure S14). The presented work will find wide applications for immunohistochemical tissue sections and cytological specimens to make novel molecular marker discoveries for the clinic.
Demonstration of laser isolation of various sample types prepared on ITO glasses. The sample types demonstrated are bone marrow (a), fluorescence in situ hybridization treated blood (b), and tissue stamp (c). Targeted cells are indicated with yellow arrows (a,b) or red arrows (c). Scale bars are 20um, 10um, 20um respectively.
Availability
Related data and methods will be available upon request to the corresponding author.
Acknowledgement
This work was supported by the Ministry of Science and ICT(MSIT) of the Republic of Korea and the National Research Foundation of Korea (NRF-2020R1A3B3079653)
References
- Zaino RJ, Kauderer J, Trimble CL, et al. Reproducibility of the Diagnosis of Atypical Endometrial 101 Hyperplasia. American Cancer Society 106 (2006): 804-811.
- Bain BJ. Diagnosis from the Blood Smear. N. Engl. J. Med 353 (2005): 498-507.
- van Lom K, Hagemeijer A, Smit EME et al. In Situ Hybridization on May-Griinwald Giemsa-Stained Bone Marrow and Blood Smears of Patients With Hematologic Disorders Allows Detection of Cell-Lineage-Specific Cytogenetic Abnormalities. Blood 82 (1993): 884-888.
- Herzog RW, Hagstrom JN. Gene Therapy for Hereditary Hematological Disorders. American Journal of Pharmacogenomics 1 (2001): 137-144.
- Yoshida K, Ogawa S. Genetic analysis of hereditary hematological disorders: overview. The Japanese journal of clinical hematology 56 (2015): 861-866.
- Segel GB, Lichtman MA. Familial (inherited) leukemia, lymphoma, and myeloma: an overview. Blood Cells, Molecules, and Diseases 32 (2004): 246-261.
- Bentz M, Cabot G, Marion Moos M, et al. Detection of Chimeric BCR-ABL Genes on Bone Marrow Samples and Blood Smears in Chronic Myeloid and Acute Lymphoblastic Leukemia by In Situ Hybridization. Blood 83 (1994): 1922-1924.
- Pe rez-Simo n JA, Garcia-Sanz R, Tabernero MD, et al. Prognostic Value of Numerical Chromosome Aberrations in Multiple Myeloma: A FISH Analysis of 15 Different Chromosomes. Blood 91 (1998): 3366-3371.
- Charwudzi A, Olayemi EE, Ekem I, et al. A Preliminary Study of the Suitability of Archival Bone Marrow and Peripheral Blood Smears for Diagnosis of CML Using FISH. Advances in Hematology 2014 (2014).
- Mignardi RKM, Alexandra Pacureanu A, et al. In situ sequencing for RNA analysis in preserved tissue and cells. Nat. Methods 10 (2013): 857-860.
- Lee JH, Daugharthy ER, Scheiman J, et al. Highly Multiplexed Subcellular RNA Sequencing in Situ. Science 343 (2014).
- Lee JH, Daugharthy ER, Scheiman J, et al. Fluorescent in situ sequencing (FISSEQ) of RNA for gene expression profiling in intact cells and tissues. Nat. Protocols 10 (2015): 442-458.
- Stahl PL, Salmen F, Vickovic S et al. Visualization and analysis of gene expression in tissue sections by spatial transcriptomics. Science 353 (2016): 78-82.
- Mado V, Goossens K, Burvenich C, et al. Laser capture microdissection: Should an ultraviolet or infrared laser be used?, Analytical Biochemistry 439 (2013): 88-98.
- Kummari E, Ross SXG, Eells JB. Laser Capture Microdissection - A Demonstration of the Isolation of Individual Dopamine Neurons and the Entire Ventral Tegmental Area. J. Vis. Exp 96 (2015): 52336.
- Lutz HL, Marra N, Grewe F, et al. Laser capture microdissection microscopy and genome sequencing of the avian malaria parasite, Plasmodium relictum, Parasitol Res 115 (2016): 5603-4510.
- Scopel KKG, Fontes CJF, Nunes AC, et al. Low sensitivity of nested PCR using Plasmodium DNA extracted from stained thick blood smears: an epidemiological retrospective study among subjects with low parasitaemia in an endemic area of the Brazilian Amazon region. Malar J 3 (2004): 8.
- Beltinger CP, Klimek F, Debatin K. Whole genome amplification of single cells from clinical peripheral blood smears, J. Clin. Pathol 50 (1997): 272-278.
- Frumkin D, Wasserstrom A, Itzkovitz S, et al. Amplification of multiple genomic loci from single cells isolated by laser micro-dissection of tissues, BMC Biotechnology 8 (2008): 17.
- Scopel KKG, Fontes CJF, Nunes AC, et al. High prevalence of Plasmodium malariae infections in a Brazilian Amazon endemic area (Apiacás-Mato Grosso State) as detected by polymerase chain reaction. Acta Trop 90 (2004): 61-64.
- Xiao FZ, Zhang SY, Xu LS, et al. DNA amplification of Plasmodium vivax parasites from Giemsa-stained blood smears. Chin J Parasitol Para Dis 24 (2006): 290-292.
- Ekala MT, Lekoulou F, Djikou S, et al. Evaluation d'une méthode simple et rapide d'extraction de l'AND de Plasmodium falciparum à partir de gouttes épaisses de patients gabonais. Bull Soc Pathol Exot 93 (1993): 8-11.
- Aubouy A, Carme B. Plasmodium DNA contamination between blood smears during Giemsa staining and microscopic examination. J. Inf. Dis 190 (2004): 1335-1337.
- Navin N, Kendall J, Troge J, et al. Tumour evolution inferred by single-cell sequencing. Nature 472 (2011): 90-95.
- Casasent AK, Edgerton M, Navin NE. Genome evolution in ductal carcinoma in situ: invasion of the clones. J. Pathology 241 (2016): 208-218.
- Lee H, Kim H, Kim S, et al. A high-throughput optomechanical retrieval method for sequence-verified clonal DNA from the NGS platform. Nat. Commun 6 (2015): 6073.
- Kim S, Lee AC, Lee H, et al. PHLI-seq: constructing and visualizing cancer genomic maps in 3D by phenotype-based high-throughput laser-aided isolation and sequencing. Genome Biology 19 (2018): 158.
- Mao SS, Laser Ablation, Fundamentals & Applications. (2005).
- Malik O, Javier De la Hidalga-WF. Physical and Technological Aspects of Solar Cells Based on Metal Oxide-Silicon Contacts with Induced Surface Inversion Layer. Application of Solar Energy 5 (2013).
- Smith AM, Mancini MC, Nie S. Bioimaging: Second window for in vivo imaging, Nat. Nanotech 4 (2009): 710-711.
- Yang Y, Swennenhuis JF, Rho HS, et al. Parallel single cancer cell whole genome amplification using button-valve assisted mixing in nanoliter chambers, PLOS One 9 (2014).
- Kouduka M, Suko T, Morono Y, et al. A new DNA extraction method by controlled alkaline treatments from consolidated subsurface sediments, FEMS Microbiol. Lett 326 (2012): 47-54.
- Hasmats J, Green H, Orear C et al. Assessment of whole genome amplification for sequence capture and massively parallel sequencing, PLOS One 9 (2014): e84785.
- Malempati S, Tibbitts DC, Cunningham MA, et al. Aberrant stabilization of c-Myc protein in some lymphoblastic leukemias, Leukemia 20 (2006): 1572-1581.
- Rucker FG, Sander S, Dohner K, et al. Molecular profiling reveals myeloid leukemia cell lines to be faithful model systems characterized by distinct genomic aberrations, Leukemia 20 (2006): 994-1001.
- Waldman FM, DeVries S, Chew KL, et al. Chromosomal alterations in ductal carcinomas in situ and their in situ recurrences. J Natl Cancer Inst 92 (2000): 313-320.

