Synergistic Effect of Inducible Factors on the Differentiation of Human Adipose-Derived Stem Cells to Vascular Cells
Article Information
Renu Ramesh1, Jayakumar K2, Lissy K Krishnan1*
1Division of Thrombosis Research, Department of Applied Biology, Biomedical Technology Wing, Sree Chitra Tirunal Institute for Medical Sciences and Technology, Kerala, India
2Department of Cardiovascular and Thoracic Surgery, Hospital Wing, Sree Chitra Tirunal Institute for Medical Sciences and Technology, Kerala, India
*Corresponding Author: Lissy K Krishnan, Senior Grade Scientist G, Division of Thrombosis Research, Department of Applied Biology, Biomedical Technology Wing, Sree Chitra Tirunal Institute for Medical Sciences and Technology, Trivandrum, 695012, Kerala, India
Received: 15 October 2020; Accepted: 30 October 2020; Published: 06 November 2020
Citation: Renu Ramesh, Jayakumar K, Lissy K Krishnan. Synergistic Effect of Inducible Factors on the Differentiation of Human Adipose-Derived Stem Cells to Vascular Cells. Archives of Clinical and Biomedical Research 4 (2020): 632-656.
View / Download Pdf Share at FacebookAbstract
The use of cells derived from the patient’s tissue is an attractive approach to develop autologous tissue-engineered vascular graft (TEVG) to bypass the diseased blood vessel. Multipotent human adipose-derived mesenchymal stem cells (hADMSCs) have the potential to differentiate into both smooth muscle cells (SMCs) and endothelial cells (ECs). However, the disease conditions affecting the growth and differentiation potential of cardiovascular disease (CVD) patient’s MSC (pADMSCs) is a hindrancee.
This study aimed to derive both endothelial progenitor cells (EPCs) and smooth muscle progenitor cells (SMPCs) from pADMSCs using a specific niche comprising fibrin and other inducers. pADMSCs were seeded on SMC-specific/EC-specific fibrin matrix coated on tissue culture polystyrene (TCPS) surface. In the third passage, pADMSCs were exposed to GFs for a specific period to induce pADMSCs to SMPCs. For inducing hADMSCs to EPCs, cells were exposed to GFs, followed by hypoxia. The EPCs were seeded in the lumen of a scaffold and applied shear stress to induce into ECs. The relative gene expressions at different stages were assessed by mRNA quantification and at the protein level by immunocytochemistry of final differentiated cells. A consistent matrix and GF dependent protocol facilitated derivation of SMPCs/SMCs with early, mid, and late markers. Sequential action by GF, hypoxia (HO), and shear stress (SS) differentiated pADMSCs to EPCs/ECS. The study established that patient-specific ECs and SMCs may be derived from ADMSCs for the construction of intimal and medial layers of TEVG aiming to fabricate autologous blood vessels.
Keywords
Adult Stem cells; Endothelial progenitor cells; Smooth muscle progenitor cells; Differentiation; Fibrin substrate; Biomimetic niche
Adult Stem cells article; Endothelial progenitor cells article; Smooth muscle progenitor cells article; Differentiation article; Fibrin substrate article; Biomimetic niche article
Article Details
Abbreviations:
DAPI - 4′,6-diamidino-2-phenylindole; AcLDL - Acetylated low-density lipoprotein; ADMSCs - Adipose derived mesenchymal stem cell/s; ABAM - Antibiotic-antimycotic; BMP-4 - Bone- morphogenetic protein-4; αSMA-Alpha smooth muscle actin; BSA - Bovine serum albumin; CVDs - Cardiovascular disease; cDNA - Complementary deoxy-ribonucleic acid; EC-Endothelial cell; EPC-Endothelial progenitor cell; EGF - Epidermal growth factor; ECM - Extracellular matrix; eNOS-endothelial nitric oxide synthase; ESEM- Environmental scanning electron microscope; FBS - Fetal bovine serum; GAPDH - Glyceraldehyde -3-phosphate dehydrogenase; GFs - Growth factor/s; hADMSCs - Human adipose derived mesenchymal stem cell/s; HE - Hypothalamus extract; HO-Hypoxia; IC-SCRT - Institutional Committee for Stem Cell research and Therapy; IEC - Institutional Ethics Committee; IGF-1 - Insulin-like growth factor -1; MSCs - Mesenchymal stem cell/s; MHC11-Myosin heavy chain11; pADMSCs - Patient - specific adipose derived mesenchymal stem cell/s; PAI-Plasminogen activator inhibitor; PGFs - Platelet growth factors; PCR - Polymerase chain reaction; PCL-Poly caprolactone; PDGFRα - Platelet derived growth factor receptor alpha; qRT-PCR - Real-time quantitative reverse transcriptase polymerase chain reaction; RNA - Ribonucleic acid; SCT - Sree Chitra Tirunal; SS-Shear stress; SMC-Smooth muscle cell; SMPC-Smooth muscle progenitor cell; SVF - Stromal vascular fraction; TCPS - Tissue culture polystyrene; TGF β - transforming growth factor β; TEVG-Tissue engineered vascular graft; tPA-Tissue plasminogen activator; VACM1-Vascular cell adhesion molecule1; VE-CAD-VE Cadherin; VEGF-165 - Vascular endothelial growth factor- 165; vWF-von Willebrand factor
1. Introduction
The common presentations of cardiovascular diseases (CVD) are narrowing or blockage of blood vessels causing reduced blood flow and tissue damage due to inadequate nutrient supply. Grafting of autologous vessels is considered as the gold standard to bypass blocked small diameter (<6 mm) blood vessels. However, CVD-associated thrombosis, intimal hyperplasia, atherosclerosis, or infection limits the availability of autologous vessels for implantation. Therefore, constructing mechanically strong, compliant, pliable, and functional TEVG has been an interesting research problem. In this context, non-immunogenic grafts constructed from the patient's cells can be of immense advantage and may function similarly or better to the autologous grafts which are currently considered to be gold standards. The luminal endothelial cell (EC) layer with normal function is essential for hemocompatibility and the smooth muscle cell (SMC) layer to combat hemodynamic responses. The cells need a suitable scaffold on which they can grow and produce functional tissue. Earlier studies have established the suitability of fibrin composite-coated tubular poly-€-caprolactone (PCL) scaffolds for vascular tissue engineering in terms of mechanical properties, EC retention, survival, and functionality under dynamic culture conditions [1].
For the construction of patient-specific non-immunogenic TEVG, multipotent mesenchymal stem cells (MSCs) from the patient could be an ideal strategy. Differentiation of umbilical cord MSC into SMC was achieved by inducing with TGF-β1 and established that micro RNAs regulate the differentiation [2]. Also, MSC differentiation into ECs upon treating with recombinant vascular endothelial growth factor was demonstrated [3]. These authors demonstrated that ~30% of ADMSCs transformed to CD31+ve cells in culture; however other important markers of functional ECs were not demonstrated. With such potential for generating EC and SMC, human mesenchymal stem cells (MSCs) are recognized as a valuable source for vascular tissue engineering, which requires endothelial and perivascular cells [4].
This study aims to a translational potential of the developed protocol. There is ample evidence for suggesting that the hADMSCs differentiation is greatly dependent on the milieu. The differentiation of ADMSCs upon coculture with macrovascular and microvascular cells are demonstrated to produce distinct EC phenotypes [5]. The current study aimed to derive EPCs and SMPCs using specific milieu comprising fibrin-based ECM proteins for facilitating cell attachment and additional GFs for signalling. Advantage of fibrin as a growth factor reservoir and adhesion matrix has been well described in our earlier studies [6, 7]; however, ADMSC differentiation to EC and SMC was not attempted. A combination of growth factor was evaluated for the induction of CVD patient derived ADMSCs to SMC and EC lineages. Further, the differentiation of EPCs into EC required a hypoxic environment and mechanical stimulation as well.
2. Materials and Methods
2.1 Isolation and Characterization of pADMSCs
Human adipose tissue was collected from the sternum of patients undergoing coronary artery bypass graft procedure at SCTIMST, Trivandrum and the tissue was collected after obtaining the Institute Ethics Committee approval (SCT/IEC/1231/June2018, SCT/IC-SCR/43/March 2017). Human ADMSCs were isolated as described [8]. The procedures, reagents, and the antibodies used for culture and characterization are described in detail in the supplementary file.
2.1.1 Preparation of Fibrin matrix: Tissue culture polystyrene (TCPS) dishes coated with fibrin matrix as described earlier was used [9]. Briefly, for both SMPC-/EPC-specific fibrin matrix, clinical-grade fibrin sealant components were reconstituted with respective solvents. Fibrinogen concentrate was diluted with water to the final 2 mg/ml concentration. Thrombin was diluted with 25 mM calcium chloride to get 5IU per ml. TCPS wells were incubated with diluted thrombin; after 30 min, the thrombin was aspirated completely. For the SMPC-specific matrix, a thin layer of fibrinogen composite (12.5 ul per cm2) comprising 2 mg/ml fibrinogen, 0.2% exogenous gelatin (Sigma, USA), in-house prepared platelet growth factor (PGF) [10], was layered on thrombin adsorbed surface and was allowed to clot. For induction of pADMSCs to EPC, diluted thrombin treated surface (5IU) was layered with a thin layer of (12.5 ul per cm2) diluted (2 mg/ml) fibrinogen, exogenous gelatin (0.2%; Sigma, USA), in-house prepared hypothalamus extract (HE) [11], and was allowed to clot. In both cases, the clot formed was stabilized by incubating the culture dishes at 37°C for 30 min, lyophilized (Modulyo 4K Freeze dryer, Edwards, UK) in a sterile atmosphere, and stored at 4°C until used.
2.2 Induction of pADMSCs
2.2.1 pADMSCs to smooth muscle lineage: pADMSCs in early passages (P2-P5) were induced with a combination of GFs for differentiation to SMPCs. Briefly, 1*104 cells/cm2 were seeded onto TCPS dishes coated with the bio-mimetic matrix as described in 2.1.1. The seeded cells were cultured in MCDB 131 medium (Gibco, USA) containing 1% fetal bovine serum (FBS) (Gibco, USA), Antibiotic- Antimycotic solution (Invitrogen, USA), L-glutamine (Sigma, USA), L-ascorbic acid (Sigma, USA), 2.5 ng/ml recombinant human Bone Morphogenetic Protein 4 (BMP4; R&D systems, USA) and 0.6 µg/ml in-house processed PGF. Initially, the cultured cells were treated with the growth factor (GF) combination at different periods to identify the time required for differentiation. Morphological analysis using phase-contrast microscopy (DMIRB, Leica Microsystems, Wetzlar, Germany) was used as the first level of evidence for the transformation of cells. The morphology was continuously monitored during the culture period and was documented before further characterization. The cells that grew with ‘Hill & Valley’ morphology were sub-cultured till passage 2 and medium change was given once in three days.
2.2.2 pADMSCs to endothelial lineage: pADMSCs in early passages (P2-P5) were induced with a combination of growth factors and hypoxia for differentiation to EPCs. About 1 × 10⁴ cells/cm2 were seeded onto EC-specific fibrin matrix coated TCPS dishes, as described in 2.1.1. Seeded cells were cultured for two days in MCDB 131 medium (Gibco, USA) containing 10% FBS (Gibco, USA), Antibiotic-Antimycotic solution (Invitrogen, USA), heparin sulfate (Sigma, USA), L-glutamine (Sigma, USA), L-ascorbic acid (Sigma, USA), 50 ng/ml recombinant human vascular endothelial growth factor 165 (VEGF 165, Cell Signaling Technology, USA), 20 ng/ml recombinant human Insulin-like growth factor-1 (IGF-1, Cell Signaling Technology, USA) and 10ng/ml recombinant human epidermal growth factor (EGF, Cell Signaling Technology, USA). After two days in static culture, the induced cells were subjected to hypoxia in an incubator chamber (Stem Cell Technologies, USA) for 20h which is an improvement of previous experiments of exposure for 6h. Morphological analysis using phase-contrast microscopy (DMIRB, Leica Microsystems, Wetzlar, Germany) was used as the first level of evidence for the transformation of cells. The morphology was continuously monitored during the culture period and was documented before further characterization.
2.2.3 Induction of EPCs to ECs: After exposure to hypoxia, the EPCs were seeded in the lumen of a fibrin coated bilayered polycaprolactone (PCL) scaffold at a seeding density of 10,000 cells/cm2. The scaffolds were kept in the incubator at 37°C under 5% CO2 for 30 minutes, in a horizontal position with occasional rolling. Afterward, the scaffolds were connected to a custom-made bioreactor using a pump (Masterflex L/S pump, ColeParmer, USA) and applied a graded flow rate of 20 ml/min to 100 ml/min in a span of 24h for applying a shear force which gave shear stress from 11.6 dynes/cm2 to 58.2 dynes/cm2. Shear stress of ~58 dynes/cm2 was continued for another 72h.
2.3 Analysis of differentiation
2.3.1 Quantitative Real-Time – PCR: For all gene expression analysis, RNA was isolated using TRIZOL reagent (Invitrogen, USA) based on the manufacturer’s protocol. RNA quantification was done using Nanodrop 1000 Spectrophotometer (Thermo Scientific, USA). 200ng of total RNA was converted to cDNA using the OrionX cDNA kit (Origin, India) in a thermal cycler (Master cycler; Eppendorf). The EPC and SMPC specific markers were quantified by qRT-PCR, in a total volume of 15µl containing 20ng cDNA, 100 pmol of respective intron spanning forward and reverse primers, and 7.5 µl of OrionX 2X Real-time PCR master mix (Origin, India). Forty cycles of reaction were performed using the Bio-Rad iQ5 Real-time PCR detection system (Bio-Rad, USA) under the following conditions: Enzyme activation, 95°C for 15 minutes; denaturation, 95°C for 30 seconds; annealing, 50°C for 20 seconds; and extension, 72°C for 20 seconds. GAPDH was used as the house-keeping gene. Melt curve analysis was performed for each gene to confirm the specificity of each reaction. Products were analyzed by agarose gel electrophoresis for correct amplicon size. Fold change in expression was calculated after normalization with GAPDH expression on each day of analysis using the formula 2-ΔΔCt. Normal hADMSCs grown on bare TCPS for respective periods were taken as the control to estimative relative gene expressions as indicators of differentiation. A list of primers used for the study is given in Table 1.
2.3.2 Immunostaining: The cells induced to SMPCs lineage were characterized for specific SMPC markers namely alpha-smooth muscle actin (αSMA), calponin, myosin heavy chain 11 (MHC 11) and platelet derived growth factor receptor α (PDGF R α). The antibody dilutions were as follows: α SMA and calponin at 1:20, MHC11 at 1:50, and PDGF R α at 1:250, dilutions. The EPCs developed upon GF treatment followed by hypoxia for 20h were used for immunostaining. The EPCs were characterized for specific markers namely acetylated LDL (AcLDL), CD31, vascular cell adhesion molecule1 (VCAM1), VE-Cadherin (VE-Cad), and endothelial nitric oxide synthase (eNOS). The induced cells were incubated with 10µg/ml acetylated LDL (Molecular Probes, USA) for 4h in the dark in the incubator at 37°C under 5% CO2. The antibody dilutions of other EC markers used were as follows: CD31 and VE-Cadherin at 1:50 and VCAM-1 and eNOS at 1:100 dilutions. Briefly, the cells were fixed with 3.7% paraformaldehyde (Merck, Germany) for 20 minutes at room temperature, permeated using 0.2% Triton X 100 (Sigma Aldrich, USA) for 5 minutes, and blocked with 3% bovine serum albumin (BSA; Sigma, USA) for 30 minutes. The cells were then incubated with primary antibodies at 4°C overnight, secondary antibodies at 37°C for one hour, at room temperature, and stained for nucleus using DAPI (Life Technologies, USA). The source of antibodies used for the immunostaining is listed in Table 2.
|
Genes |
Amplicon Size |
Primer sequence (5’-3’) |
|
GAPDH |
120bp |
FP - GAA ATC CCA TCA CCA TCT TCC AGG |
|
RP - GAG CCC CAG CCT TCT CCA TG |
||
|
CD 31 |
118bp |
FP - CAG TCA TTA CGG TCA CAA T |
|
RP - CTG AGG ACA CTT GAA CTT C |
||
|
eNOS |
116bp |
FP- GGC ATC ACC AGG AAG AAG A |
|
RP- TCG GAG CCA TAC AGG ATTG |
||
|
vWF |
310bp |
FP- CAC CAT TCA GCT AAG AGG AGG |
|
RP- GCC CTG GCA GTA GTG GAT A |
||
|
VCAM1 |
90bp |
FP- CCT CCT TAA TAA TAC CTG CCA TTG |
|
RP- TCT GTG CTT CTA CAA GAC TAT ATG A |
||
|
PAI |
485bp |
FP- TTG GTG AAG GGT CTG CTG TG |
|
RP- GGC TCC TTT CCC AAG CAA GT |
||
|
tPA |
319bp |
FP- ATG GGA AGA CAT GAA TGC AC |
|
RP- GAA AGG GGA AGG AGA CTT GA |
||
|
MCP -1 |
120bp |
FP – CCG AGA GGC TGA GAC TAA C |
|
RP – ATG AAG GTG GCT GCT ATG A |
||
|
α SMA |
100bp |
FP- GAG TTA CGA GTT GCC TGA T |
|
RP- AGA CTC CAT CCC GAT GAA |
||
|
Calponin |
104bp |
FP- TTG AGA ACA CCA ACC ATA CA |
|
RP- CTC TGC GTA CTT CAC TCC |
||
|
MHC 11 |
143bp |
FP- ACT ACA CCT TCC TCT CCA A |
|
RP- GAC CGA TGA TAC CAC CTT C |
Table 1: Primer sequences used for qRT PCR analysis.
|
Name |
Isotype |
Source |
Catalog No. |
|
α SMA |
Mouse IgG |
ThermoScientific |
MA5-11547 |
|
Calponin |
Mouse IgG |
ThermoScientific |
MA5-11620 |
|
MHC 11 |
Rabbit IgG |
Abcam |
ab53219 |
|
PDGFRα |
Mouse IgG |
Abcam |
ab96569 |
|
CD31 |
Mouse IgG |
Biolegend |
303110 |
|
eNOS |
Mouse IgG |
Abcam |
ab76198 |
|
VCAM-1 |
Rabbit IgG |
Abcam |
ab215380 |
|
VE-cadherin |
Mouse IgG |
SantaCruz Biotechnology |
Sc52751 |
|
Anti-mouse AF 488 |
Goat IgG |
Abcam |
ab150113 |
|
Anti-rabbit AF 488 |
Goat IgG |
Abcam |
ab150077 |
Table 2: Sources of antibodies used for Immunostaining studies.
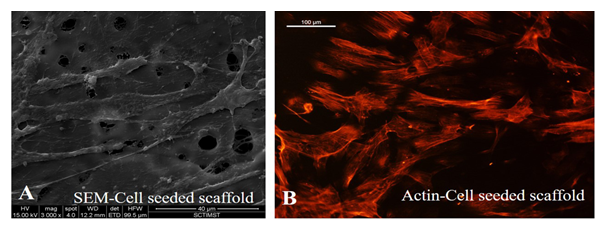
2.3.3 Attachment of EPC in the scaffold lumen: The morphology and stability of differentiated ECs were analyzed by environmental scanning electron microscopy (ESEM). The cells were also analyzed by fluorescence microscopy after staining the cytoskeletal protein actin using Phalloidin. For ESEM analysis, the cell-seeded scaffolds were fixed in 2% glutaraldehyde for 20 minutes after which the scaffolds were washed four times in PBS. The scaffolds were then processed by passing through an ascending series of alcohol for dehydration: 30% -30 minutes, 50%-30 minutes, 70%-30 minutes, 90%-30 minutes, and 100%-30 minutes. The processed scaffolds were dried and used for ESEM analysis. The ESEM analysis was carried out using the 30KV Environmental Scanning Electron Microscope (ESEM-Quanta 200, Germany). For confirming cell attachment and growth on a scaffold, cell-seeded scaffolds were stained for actin with Texas red Phalloidin after 4 days of a dynamic culture. Briefly, cell-cultured scaffolds were fixed with 2% glutaraldehyde for 20 min, washed with PBS, and permeated by 0.2% triton X 100, washed and stained with Texas red conjugated phalloidin (1: 250 dilution) for 45 min and washed. The scaffolds were then counterstained with DAPI (Life Technologies, USA) and observed and imaged using a fluorescent microscope (Leica, DMIRB, Germany).
2.3.4 Quantification of differentiated SMPCs and EPCs: The percentage of specific marker positive cells in differentiated SMPCs and EPCs was estimated semi-quantitatively by Image J analysis. The number of nuclei per field was counted from 4 different fields from different donors. The distribution of MHC11 and PDGF Rα positive cells per field in the respective images was counted for differentiated SMPCs and differentiated EPCs, the distribution of CD 31 and VCAM 1 positive cells per field in the respective images was counted. The percentage of positive cells was estimated based on the total number of cells in 4 fields and total SMPC/EPC cells in the corresponding fields. Average and standard deviation were also calculated.
2.3.5 Statistical analysis: Statistical significance was calculated by Student T-Test for all quantitative data. Mean values and standard deviation (SD) were calculated for all parameters and are represented in graphical form. Significance is labeled in the graphs with ‘***’ (P<0.001), ‘**’ (P<0.01); and ‘*' (P<0.05). The number of replicate experiments carried out is indicated in the legends of each figure.
3. Results
3.1 Characteristics of isolated pADMSCs
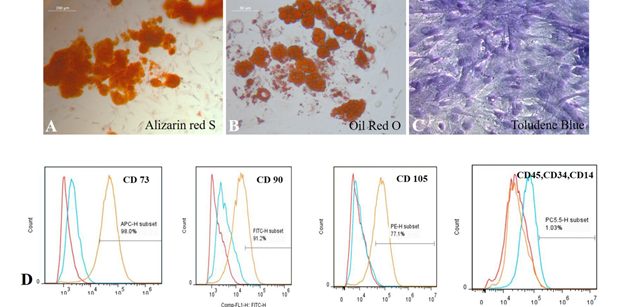
The isolated pADMSCs were plastic adherent, showed spindle shape in 24h, and proliferated in 4-5 days (Supplementary Figure S1). Cells exhibited standard mesenchymal characteristics with multipotency (Supplementary Figures S2A-C) and surface marker expressions (Supplementary Figure S2D).
3.2 Characteristic of pADMSCs-derived SMPCs
After inducing pADMSCs in passage 3 using GFs, analysis of cell morphology after 72h, 120h, and 144h showed characteristic 'hill and valley’ appearance of smooth muscle cells. The normal pADMSCs are in Figure 1A; induced cells after 72h, 120h, and 144h are in Figure 1B, 1C and 1D, respectively. The morphology of cells induced for 72h, 120h, and 144h was similar. The only difference was that the cells were packed by 144h due to continued proliferation. Hence, 72h incubation was fixed for various other analyses of pADMSCs-induced SMPCs and, the GF supplement was withdrawn. Subsequently, the cells were allowed to grow in culture for another 24h and were sub-cultured at a 1:2 split ratio. Two consecutive subcultures established that the cells proliferate well for potential application in growing on the abluminal side of the PCL-Fibrin scaffold for the construction of an artificial vascular graft.
3.3 Expressions of SMPC protein markers
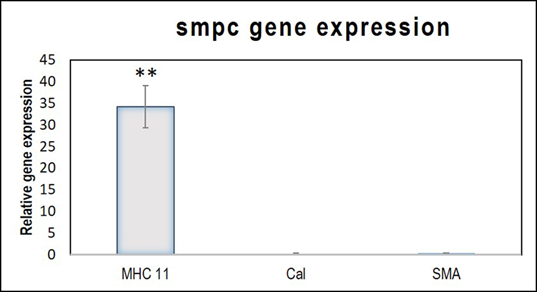
The quantitative analysis of gene expression detected minimal upregulation of the early marker αSMA, and the mid marker calponin. The relative expression of the late marker, MHC 11 was statistically significant (Figure 2). The observation indicates that in 120h, the cells attained mature SMPC characteristics. The gene expression pattern of the differentiated cells established that the induction protocol adopted was successful in achieving SMPC lineage commitment.
3.4 Protein level expression of SMPC specific markers
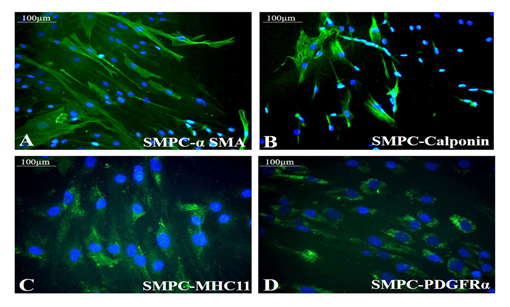
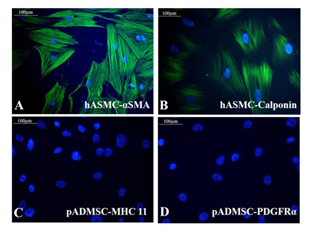
Both the growth factors PGF and BMP-4 together aided progressive differentiation of pADMSCs to SMPCs. The smooth muscle cell lineage commitment of pADMSCs was confirmed by the presence of αSMA and calponin (Figure 3A and 3B) and the stained cells were compared with human umbilical artery SMCs (hASMC) used as a positive control (Supplementary Figure S3 A&B). Other immunochemical SMC-specific markers detected were MHC11 and PDGFRα (Figure 3C and 3D). Expressions of these markers were compared with normal pADMSCs grown on bare TCPS, as a negative control (Supplementary Figure S3 C and D). Expressions of αSMA, calponin, and MHC11 that are early, mid and late SMC markers, respectively, confirmed the smooth muscle lineage commitment upon growth factor induction of pADMSCs. The presence of PDGFRα indicated the proliferative phenotype of the committed cells. Semi-quantitative estimation of MHC11 and PDGFRα expressing cells in differentiated SMPCs showed that around 86.5 ± 7.96 cells expressed MHC11 (Supplementary Table 2) and 86.26 ± 6.23 cells expressed PDGFRα (Supplementary Table 3).
3.5 pADMSCs induction to EPCs
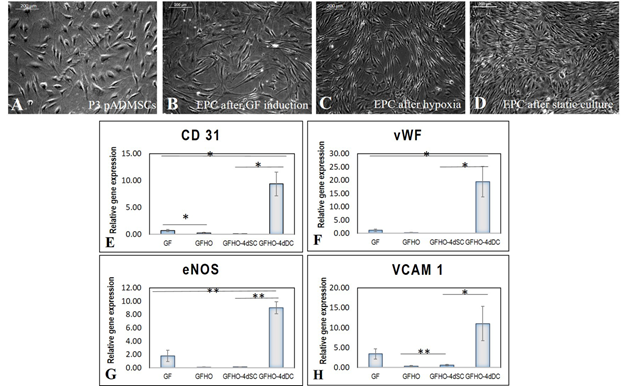
When the subcultured pADMSCs were induced for differentiation to EPCs, there was a marked difference in morphology. P3 pADMSCs showed spindle morphology before growth factor induction in EPC differentiation (Figure 4A), but upon induction with growth factors for 48h, there was a visible difference in morphology. Elongated slender cells were observed (Figure 4B) and upon exposure to hypoxia for 20h the induced cells exhibited a tubular pattern, typical of angiogenic cells (Figure 4C). When the induced cells were cultured under static conditions for 4 days, the slender morphology changed to a more cobble stone-like morphology (Figure 4D).
3.6 Effect of induction on expression of EPC markers
A three-step induction of pADMSCs to EC showed distinct changes in the expressions of EPC markers. The different stages compared to pADMSCs grown for respective periods were; after 48h GF exposure (denoted-GF); 48h GF followed by 20h hypoxia exposure (denoted-GFHO); GF & hypoxia exposure followed by 4d static culture (GFHO-4dSC); and GF & hypoxia exposure followed by 4d dynamic culture (GFHO-4dDC). Both CD31 & von Willebrand factor (vWF) were not significantly up regulated in GF, GFHO or GFHO-4dSC samples; however GFHO-4dDC resulted in significant up regulation of both genes (Figure 4E and 4F). Significant up-regulation of endothelial specific markers eNOS and VCAM1 were evident in cells after GF induction; however, in GFHO cells and GFHO-4dSC cells, the expressions of both these genes were lowered. On the other hand, in GFHO-4dDC the expressions of both genes were significantly up regulated (Figure 4G and 4H). The results highlight the influence of shear stress on stability and maintenance of up regulated endothelial gene expressions.
About nine-fold increase in CD31 upon exposure to shear stress was estimated in comparison with GFHO-4dSC highlighting the importance of shear stress for CD 31 expression. Similarly, VCAM1 also showed dissimilar expression at different steps, with statistically significant lesser expression after hypoxic induction, and a higher expression after dynamic culture indicating the tendency of cells to differentiate to endothelial lineage. The eNOS showed a significant increase of ~9-fold up-regulation under the influence of shear stress. The vWF expression was upregulated under shear stress as compared with other periods of culture.
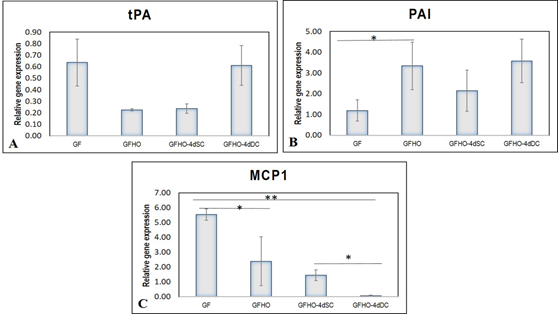
The basal expression of the pro-fibrinolytic molecule tissue plasminogen activator (tPA) was comparable and not remarkably high in GF, GFHO, GFHO-4dSC, and GFHO-4dDC samples (Figure 5A). The plasminogen activator inhibitor (PAI) was significantly up-regulated after GF exposure which further increased in GFHO cells. Both in GFHO-4dSC and GFHO-4dDC, the upregulation of PAI was comparable, steady, and stable (Figure 5B). The expression of the pro-inflammatory molecule, monocyte chemoattractant protein (MCP1), was upregulated ~5-folds after GF exposure, which was gradually reduced in -GFHO, GFHO-4dSC, and GFHO-4dDC-cells (Figure 5C). Shear stress exposure down-regulated the inflammatory EC phenotype.
3.7 Protein level expression of EPC specific markers
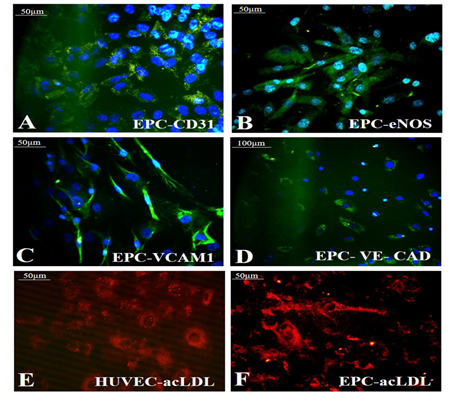
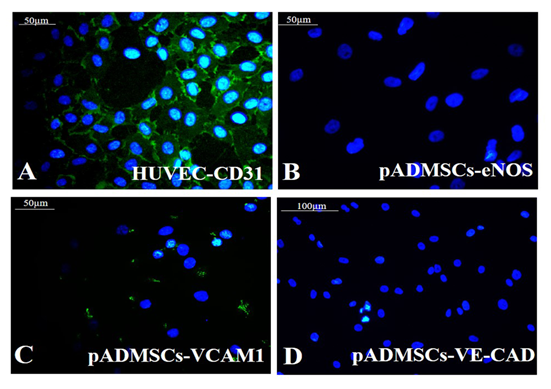
Growth factor treatment followed by hypoxic induction established the differentiation of pADMSCs to EPCs increasing expressions of EPC- specific markers at the protein level. The expressions of EC specific markers CD31 (Figure 6A), eNOS (Figure 6B), VCAM1 (Figure 6C), and VE-Cadherin (Figure 6D) were seen significantly higher than the respective control samples. A comparison of CD31 expression in HUVEC (positive control) is shown in Supplementary Figure S4A. Comparisons of other marker expressions with normal pADMSCs grown on bare TCPS (negative control) are in Supplementary Figures S4B-D. eNOS stained nucleus demonstrated cyan color due to dual colors of DAPI (blue) and eNOS (green). Confirmed the transformation of pADMSCs to EPCs by the presence of functional marker AcLDL; the expression was comparable to the positive control HUVEC (Figure 6E and 6F). The pADMSC-derived EPC showed more elongated morphology as compared to HUVEC. Upon induction to EPC lineage, 79.08 ± 5.34 % cells expressed CD31 (Supplementary Table 4), and 87.6 ± 5.07% cells expressed VCAM1 (Supplementary Table 5).
3.8 EPC growth and function
SEM images established the morphology and alignment of differentiated EPCs in the lumen of the graft, after dynamic culture. Elongated cells with cell-cell contact were seen. Stability and growth of cells in the lumen of the scaffold, aligned in the direction of flow was evident from actin staining with cells clearly expressing actin filaments (Figure 7). This established the suitability of using the differentiated cells in constructing a cell seeded graft with a functional lumen.
Figure 2: Relative gene expressions of SMPC markers MHC11, Calponin and α-SMA. The relative gene expressions of MHC11, Calponin (Cal) and αSMA, normalized to the control ADMSCs is represented graphically. Fold change is quantified relative to GAPDH expression on each day of analysis using the 2-∆∆Ct method. Error bars represent standard error. (n=4). **P<0.01
Figure 4: Characteristics of pADMSCs induced to EPCs. Phase contrast image of P3 pADMSCs. (A) before GF induction; (B) 48h after GF induction; (C) 20h after Hypoxia induction; (D) 4d after static culture. Scale bar: 200 µm. Graphical representation of relative gene expression in EPCs. The relative gene expression of (E) CD 31 (F) vWF (G) eNOS and (H) VCAM1 at 48h of growth factor induction (GF), 20h of hypoxic induction (GFHO), 4d of static culture (GFHO-4dSC), 4d of dynamic culture (GFHO-4dDC), normalized to the control ADMSCs is represented graphically. Fold change is quantified relative to GAPDH expression on each day of analysis using the 2-∆∆Ct method. Error bars represent standard error. (n=4). *P<0.05, **P<0.01.
Figure 5: Graphical representation of relative gene expressions in EPCs. The relative gene expression of (A) tPA (B) PAI and (C) MCP1 at 48h of growth factor induction (GF), 20h of hypoxic induction (GFHO), 4d of static culture (GFHO-4dSC), 4d of dynamic culture (GFHO-4dDC), normalized to the control ADMSCs is represented graphically. Fold change is quantified relative to GAPDH expression on each day of analysis using the 2-∆∆Ct method. Error bars represent standard error. (n=4). *P<0.05, **P<0.01.
Figure 6: Identification of specific markers in EPC. Fluorescent micrographs of (A)CD31 (green); (B) eNOS (green); (C) VCAM1 (green); (D) VE-Cad (green) respectively in EPC; Expression of the functional marker AcLDL in (E) HUVEC (F) EPC. Cells are counterstained with DAPI (blue). Magnification of each image is marked using scale bar.
4. Discussion
According to WHO, more people die from CVDs than from any other disease, and many morbid patients require vascular by-pass surgeries. Autologous vessels are used as bypass grafts; however, many patients face a shortage of suitable vessels. Large vessel (>6 mm) replacements employ synthetic grafts successfully, but synthetic small vessels (<6 mm) present a risk of thrombus formation and intimal hyperplasia. Moreover, the inability to grow with age limits their use in pediatric patients [12]. Hence the construction of a tissue-engineered vascular graft (TEVG) has been of immense interest. The fundamental elements of TEVG are: (i) scaffolds; (ii) endothelial cells (ECs), and smooth muscle cells (SMCs); and (iii) mechanical stimulus. The TEVG construction with functional endothelium and mechanical properties similar to natural blood vessels, using autologous cells remains a challenge. Patient-specific ADMSCs have several advantages; whereas, immune compatibility and multipotency are important ones. Multipotency of ADMSCs permits the potential of developing SMC and EC required for constructing functional autologous vascular graft.
In vivo differentiation of ADMSCs to specific cell types is largely dependent on the milieu in which they reside and a remarkable inverse relationship exists between proliferation and differentiation. Precursor cells continue division, whereas terminal differentiation usually coincides with proliferation arrest [13]. Our study focused on designing a specific niche for exploiting the multipotency for the development of proliferating vascular progenitors, an important aspect in TEVG construction. For embryonic vascular development, the TGF family growth factors play a crucial role. Reports show the differentiation of CD34+CD31+ ESC-derived progenitor cells into ECs and SMCs [14]. In combination with VEGF and FGF2, the morphogenic proteins BMP2, BMP4, and BMP7 promoted differentiation of ESCs to CD34+CD31+ cells. On the other hand, TGFβ and activin-inhibited BMP-induced transformation of ESCs to CD34+CD31+ progenitor cells. BMP4 is known to arrest mesodermal cell proliferation and induce differentiation [15]. Therefore, this study used BMP-4 and platelet growth factors (PGF) which contain mainly VEGF, FGF2, and PDGF. For differentiating human ADMSCs to SMCs, the use of soluble growth factors such as TGFβ1, TGFβ3, ascorbic acid, BMP4 and PDGF is well recognized. MCDB131 medium with 1% fetal bovine serum (FBS) and minimum essential medium with 10% FBS has also been used for differentiation of ADMSCs to SMCs [16]. An earlier report described that a combination of TGF-β1 and BMP4 [17] converted human pluripotent stem cells into mesodermal cells [18]. None of the reported studies have demonstrated expressions of all important SMC-markers to claim stability of differentiation. Our study employed PGF and BMP4, in different concentrations, and in combination for differentiation to smooth muscle lineage, and a particular concentration of BMP4 and PGF used in combination seemed to induce hADMSCs to SMC lineage. BMP4 and PGF induction elicited the expression of αSMA (early marker), calponin (mid marker), and MHC11 (late marker), as evidenced by immunofluorescence staining. About 85% of the cells in the culture were positive for MHC11. Differentiated ADMSCs expressed minimal levels of αSMA and calponin, while significantly high levels of MHC11 in the gene expression profile. The presence of MHC11 indicates the contractile phenotype of the differentiated SMCs.
For differentiation of hADMSCs to endothelial progenitor cells (EPCs), a specific niche was composed using fibrin, and VEGF as a cell-culture matrix. Biomimetic fibrin composite consisting of fibrin, fibronectin, and gelatin along with GFs was found to support the proliferation and differentiation of circulating EPC into EC [19]. Fibrin provides an adequate environment for cell attachment, growth, and migration and is an effective scaffold for vascular, skin, and nerve tissue engineering [6, 7, 20]. While fibrin is mainly a cross-linked insoluble matrix, other proteins like fibronectin(FN) and laminin (La) are responsible for stimulating the differentiation of neural progenitors to neurons [21]. The heparin-binding domains of the FN can immobilize GFs like PDGF, FGF, TGF-β, and neurotrophins [22]. Therefore, fibrin may be considered as a GF reservoir and produces various signals based on the GFs added into the medium also. Various in vitro studies established the efficacy of fibrin-based niche in promoting differentiation and proliferation of stem/progenitor cells to neurons, keratinocytes, or endothelial cells [23, 6]. The established role of the human biomimetic fibrin composite niche for selective adhesion of EPCs and SMPCs instigated the exploration of hADMSC to vascular cells using this niche. Angiogenic signals in the fibrin niche may promote stable differentiation, unlike the transient subtle changes often described in the literature. Most of the protocols for pre-differentiating hADMSCs take a longer time in culture. Apart from differentiation, hADMSC proliferation also depends on the signalling from its niche or microenvironment [24]. MSCs are greatly influenced by the signals from the local environment resulting in a “milieu-specific nature of MSC differentiation” [5].
Studies show that the proliferation and viability of EPCs are best in a defined medium containing the highest number of individual growth factors [25]. IGF is a potent component of the EC differentiation medium [26]. EGF is also a potent contributor to EC migration, maturation, and vessel formation. Induction with GFs and subsequent withdrawals is an accepted strategy for differentiating stem cells [27]. GF deprivation in the milieu generates differentiation signals. Guo et al. tried to induce ADMSCs differentiation to ECs in a medium containing hVEGF-A, FGF-B, hEGF, hIGF-1, 2% FBS, and ascorbic acid for ~5–10 days [28]. In conjunction with the tubular morphology of cells in matrigel, an upregulated expression of adhesive proteins was absent. So the MSC derived EPCs did not demonstrate sufficient angiogenic potential in animal experiments. In another study with a similar GF cocktail, bone marrow-derived MSCs were cultured for 14 days to achieve EC-like property [26]. After 14 days of growing in matrigel, a very small proportion of cells in the angiogenic tube expressed CD31 at the protein level. Our study demonstrates remarkable success in regulating the EC-specific genes at the mRNA level upon induction with GFs and hypoxia (HO). About 80% of the EPCs in the culture were positive for CD31 and ~ 90% cells for VCAM-1. Also, >70 % of cells endocytosed acetylated LDL (AcLDL), indicating EC property. Therefore, multiple sequential induction strategies improved the stability of differentiated EPCs and expressed different EC specific markers at mRNA and protein levels.
When compared to other tissues, lower oxygen concentrations are observed in adipose tissue indicating that ADMSCs live in a hypoxic environment. Significant neovascularization occurred in an in vivo mouse-hind-limb-ischemia model upon transplanting ADMSC [29], pointing to the differentiation in hypoxic conditions. Based on such evidence, cells induced with GFs were exposed to hypoxia for stimulating the signalling pathways responsible for stable EPC differentiation. Hypoxic exposure is known to cause sudden inhibition of mRNA translation [30]. Hypoxia strongly affects the regulatory pathways of ECs causing activation of several transcription factors and release of cytokines and GFs. This results in the formation of conditions favouring vasoconstriction and proliferation, participating in vascular wall remodelling [31]. The ability of cells to tolerate hypoxia is critical to their survival. The hypoxia preconditioned MSCs demonstrates better angiogenic outcome upon transplantation in ischemic conditions [32]. Our study expected to improve the release of autocrine GFs from partially differentiated EPCs, on hypoxic exposure for 20h. The EC-specific genes upregulated on ADMSC induction with GF cocktail, but subsequent HO exposure caused the silencing of the relative expressions of EC-specific genes indicating the influence of the process. The duration of HO exposure appears critical because as noticed in an unpublished study after exposure to hypoxia for 6h, the relative expressions of all 7 EC-specific genes were unaffected. The cells maintained normal morphology after 20h, but mRNAs were silenced. However, upon immunostaining immediately after hypoxic exposure, 4 important EC specific proteins were present in 80%-90% of the cells, showing that protein synthesis continued as part of the cell's survival effort, and maybe concluded that the cells were able to tolerate hypoxia and survive.
In vivo, ECs are constantly subjected to shear stress by blood flow. Stimulation of placenta-derived stem cells for 3 days in endothelial growth medium (EGM containing GFs) under shear stress for 24 h resulted in the formation of functional ECs [33]. Shear stress is important to stabilize ECs during TEVG construction [34]. Reoxygenation and culture under dynamic conditions after HO, resulted in the restoration of cells and endothelial phenotype with significant upregulation of CD31, VCAM1, vWF, and eNOS. Therefore, it is established that the stable differentiation of patient’s ADMSCs to EPC can be achieved and is suitable for lining the lumen of TEVG.
The study summarises that the fibrin matrix plays a significant role in developing SMPCs and EPCs from hADMSCs isolated from CVD patients. A combination of GF and fibrin matrix induces differentiation of pADMSCs to SMPCs and resulting in the expressions of 4 different SMC-specific molecules at the protein level. Also, a combination of GFs and fibrin-based matrix followed by HO developed EPCs expressing 4 different EC specific molecules. The EPCs demonstrated EC-specific function and turned into functional ECs that can adhere to the scaffold and respond to hemodynamic forces.
5. Conclusion
To conclude, this study established two parallel protocols for differentiating the stem cells into two vascular cell lineages. Both EPCs and SMPCs were found to be in the favorable functional phenotypes and were found suitable for lining the lumen and ablumen, respectively, of the tubular fibrin coated PCL scaffold. The novel tri-level induction protocol for differentiation to EPC lineage; and the time and a dose-dependent GF induction strategy employed for differentiation to smooth muscle lineage seems to be favorable in generating stable vascular cells from pADMSCs. The study concludes that CVD patients' ADMSC may be developed into vascular cells for the construction of autologous blood vessels.
Declarations Section
Ethical Approval and Consent to participate
All protocols in this study were approved by the Institutional Ethics Committee (IEC), SCTIMST (IEC number - SCT/IEC/1231/June2018) and by the Institutional Committee for Stem Cell Research (IC-SCR), SCTIMST (IC-SCR number - SCT/IC-SCR/43/March 2017) Thiruvananthapuram, Kerala, India. Informed consent was obtained from patients prior to the collection of adipose tissue.
Consent for Publication
The submission of this manuscript has been approved by all authors. The Director, who is the Head of the Institute has approved the publication of the manuscript, after review and recommendation by Research and Publication Cell of SCTIMST.
Availability of Supporting Data
All supporting data has been shown in the current manuscript. The supplementary file is attached separately.
Conflict of Interest
The authors declare no financial or non-financial conflict of interest.
Authors’ Contributions
Ms.Renu Ramesh has standardized the protocol for lineage commitment of pADMSCs to EPCs and SMPCs and carried out their cellular and molecular characterization. She compiled the data and drafted this manuscript.
Dr. K. Jayakumar helped for obtaining ethical approval, selected patients provided aseptically collected adipose tissue from CVD patients with informed consent.
Dr. Lissy K Krishnan developed the concept and guided Renu Ramesh with study design, critically revising for important intellectual content, editing, and approving the final version of the manuscript to be published.
Acknowledgements
The authors are grateful to the Director, SCTIMST and the Head, Biomedical Technology Wing, SCTIMST for the facilities provided. The authors thank Ms. Priyanka A, Mr. Ranjith S, Mr.Anilkumar V and Ms. Deepa S for providing the clinical grade human fibrinogen and thrombin. The authors thank ICMR for the research fellowship to Ms. Renu Ramesh.
References
- Mathews A, Colombus S, Krishnan VK, et al. Vascular tissue construction on poly (ε-caprolactone) scaffolds by dynamic endothelial cell seeding: effect of pore size. Journal of Tissue Engineering and Regenerative Medicine 6 (2012): 451-461.
- Gu W, Hong X, Le Bras A, et al. Smooth muscle cells differentiated from mesenchymal stem cells are regulated by microRNAs and suitable for vascular tissue grafts. J Biol Chem 293 (2018): 8089-8102.
- Khaki M, Salmanian AH, Abtahi H, et al. Mesenchymal Stem Cells Differentiate to Endothelial Cells Using Recombinant Vascular Endothelial Growth Factor -A. Rep Biochem Mol Biol 6 (2018): 144-150.
- Afra S, Matin MM. Potential of mesenchymal stem cells for bioengineered blood vessels in comparison with other eligible cell sources. Cell Tissue Res 380 (2020): 1-13.
- Lozito TP, Kuo CK, Taboas JM, et al. Human mesenchymal stem cells express vascular cell phenotypes upon interaction with endothelial cell matrix. Journal of Cellular Biochemistry 107 (2009): 714-722.
- Sivan U, Jayakumar K, Krishnan LK. Constitution of Fibrin-Based Niche for In Vitro Differentiation of Adipose-Derived Mesenchymal Stem Cells to Keratinocytes. Biores Open Access 3 (2014): 339-347.
- Sreerekha PR, Divya P, Krishnan LK. Adult stem cell homing and differentiation in vitro on composite fibrin matrix. Cell Prolif 39 (2006): 301-312.
- Zuk PA, Zhu M, Ashjian P, et al. Human Adipose Tissue Is a Source of Multipotent Stem Cells. Mol Biol Cell 13 (2002): 4279-4295.
- Prasad CK, Krishnan LK. Regulation of endothelial cell phenotype by biomimetic matrix coated on biomaterials for cardiovascular tissue engineering. Acta Biomaterialia 4 (2008): 182-191.
- Resmi KR, Krishnan LK. Protease action and generation of β-thromboglobulin-like protein followed by platelet activation. Thrombosis Research 107 (2002): 23-29.
- Maciag T, Cerundolo J, Ilsley S, et al. An endothelial cell growth factor from bovine hypothalamus: identification and partial characterization. Proc. Natl. Acad. Sci. U.S.A 76 (1979): 5674-5678.
- Kumar VA, Brewster LP, Caves JM, et al. Tissue Engineering of Blood Vessels: Functional Requirements, Progress, and Future Challenges. Cardiovasc Eng Technol 2 (2011): 137-148.
- Ruijtenberg S, van den Heuvel S. Coordinating cell proliferation and differentiation: Antagonism between cell cycle regulators and cell type-specific gene expression. Cell Cycle 15 (2016): 196-212.
- Bai H, Gao Y, Arzigian M, et al. BMP4 regulates vascular progenitor development in human embryonic stem cells through a smad-dependent pathway. Journal of Cellular Biochemistry 109 (2010): 363-374.
- Jeffery TK, Upton PD, Trembath RC, et al. BMP4 inhibits proliferation and promotes myocyte differentiation of lung fibroblasts via Smad1 and JNK pathways. American Journal of Physiology-Lung Cellular and Molecular Physiology 288 (2005): 370-378.
- Harris LJ, Abdollahi H, Zhang P, et al. Differentiation of adult stem cells into smooth muscle for vascular tissue engineering. J. Surg. Res 168 (2011): 306-314.
- Wang C, Yin S, Cen L, et al. Differentiation of adipose-derived stem cells into contractile smooth muscle cells induced by transforming growth factor-beta1 and bone morphogenetic protein-4. Tissue Eng Part A 16 (2010): 1201-1213.
- Patsch C, Challet-Meylan L, Thoma EC, et al. Generation of vascular endothelial and smooth muscle cells from human pluripotent stem cells. Nat Cell Biol 17 (2015): 994-1003.
- Sreerekha PR, Krishnan LK. Cultivation of endothelial progenitor cells on fibrin matrix and layering on dacron/polytetrafluoroethylene vascular grafts. Artif Organs 30 (2006): 242-249.
- Tara S, Krishnan LK. Bioengineered fibrin-based niche to direct outgrowth of circulating progenitors into neuron-like cells for potential use in cellular therapy. J Neural Eng 12 (2015): 036011.
- Tara S, Krishnan LK. Differentiation of circulating neural progenitor cells in vitro on fibrin-based composite -matrix involves Wnt- β-catenin-like signaling. J Cell Commun Signal 13 (2019): 27-38.
- Martino MM, Briquez PS, Ranga A, et al. Heparin-binding domain of fibrin (ogen) binds growth factors and promotes tissue repair when incorporated within a synthetic matrix. PNAS 110 (2013): 4563-4568.
- Barsotti MC, Magera A, Armani C, et al. Fibrin acts as biomimetic niche inducing both differentiation and stem cell marker expression of early human endothelial progenitor cells. Cell Prolif 44 (2011): 33-48.
- Kusuma GD, Carthew J, Lim R, et al. Effect of the Microenvironment on Mesenchymal Stem Cell Paracrine Signaling: Opportunities to Engineer the Therapeutic Effect. Stem Cells Dev 26 (2017): 617-631.
- Leopold B, Strutz J, Weiß E, et al. Outgrowth, proliferation, viability, angiogenesis and phenotype of primary human endothelial cells in different purchasable endothelial culture media: feed wisely. Histochem Cell Biol 152 (2019): 377-390.
- Wang C, Li Y, Yang M, et al. Efficient Differentiation of Bone Marrow Mesenchymal Stem Cells into Endothelial Cells in Vitro. Eur J Vasc Endovasc Surg 55 (2018): 257-265.
- Rodrigues M, Griffith LG, Wells A. Growth factor regulation of proliferation and survival of multipotential stromal cells. Stem Cell Research and Therapy 1 (2010): 32.
- Guo LZ, Kim TH, Han S, et al. Angio-Vasculogenic Properties of Endothelial-Induced Mesenchymal Stem Cells Derived From Human Adipose Tissue. Circ. J 80 (2016): 998-1007.
- Moon MH, Kim SY, Kim YJ, et al. Human Adipose Tissue-Derived Mesenchymal Stem Cells Improve Postnatal Neovascularization in a Mouse Model of Hindlimb Ischemia. Cell Physiol Biochem 17 (2006): 279-290.
- Koritzinsky M, Magagnin MG, van den Beucken T, et al. Gene expression during acute and prolonged hypoxia is regulated by distinct mechanisms of translational control. EMBO J 25 (2006): 1114-1125.
- Michiels C, Arnould T, Remacle J. Endothelial cell responses to hypoxia: initiation of a cascade of cellular interactions. Biochimica et Biophysica Acta (BBA)-Molecular Cell Research 1497 (2000): 1-10.
- Wei L, Fraser JL, Lu ZY, et al. Transplantation of hypoxia preconditioned bone marrow mesenchymal stem cells enhances angiogenesis and neurogenesis after cerebral ischemia in rats. Neurobiol. Dis 46 (2012): 635-645.
- Xu M, He J, Zhang C, et al. Strategies for derivation of endothelial lineages from human stem cells. Stem Cell Res Ther 10 (2019).
- Ragaseema VM, Columbus S, Ramesh R, et al. Potential of Tissue Engineered Blood Vessel as Model to Study Effect of Flow and Wall Thickness on Cellular Communication. Current Tissue Engineering 3 (2014): 39-46.
Supplementary Information
Isolation and Characterization of pADMSCs
Subcutaneous adipose tissue (~ 5 gm) was collected from the sternum of patients admitted for coronary artery bypass graft procedure at SCTIMST, Trivandrum and the tissue was collected as per the Institute Ethics Committee approval (SCT/IEC/1231/June2018,SCT/IC-SCR/43/March 2017). ADMSCs were isolated as described by Zuk et al (Zuk et al., 2002). Briefly, the tissue obtained was washed with sterile Hank’s Balanced Salt Solution (HBSS) and was minced thoroughly. The chopped tissue was digested with 4mg/ml Collagenase type I enzyme (Merck Sigma, USA) for 1 h at 37°C with continuous shaking at 120 rpm in an incubator shaker (Kuhner Shaker, Switzerland). The digested cell suspension was strained (70uM, BD Falcon, USA), mixed with serum containing medium, centrifuged at 400g and the cell pellet was resuspended in low glucose Dulbecco’s modified Eagle’s medium (DMEM- LG; Gibco, USA) supplemented with 10% Fetal Bovine Serum (FBS; Gibco, USA) and Antibiotic-Antimycotic solution (ABAM; Invitrogen, USA). The cells were seeded to a 25cm2 tissue- culture polystyrene flask (TCPS; Nunc, Denmark) and incubated at 37°C under 5% CO2. Medium was changed at 3 day intervals. Upon reaching ~ 80% confluence, cells were passaged by standard trypsinization protocol using 0.25% Trypsin- EDTA (Invitrogen, USA) for expansion of cell numbers. hADMSCs from passage 2-5 were used for characterization. The multipotency of isolated hADMSCs was confirmed by tri-lineage differentiation and specific staining. Stemness of isolated hADMSCs was done by cell surface marker analysis using flow cytometry, based on International Society for Cellular Therapy (ICST) norms. Briefly, cells at passage 2 - 5 were trypsinized using standard protocol and fixed in 3.7% formaldehyde (Merck, Germany) for 20 min at room temperature. The cells were washed by centrifugation at 400g for 5 min, the supernatant was discarded and the cell pellet was dissolved in 0.3% bovine serum albumin/phosphate buffered saline (BSA/PBS) and incubated for 30 min. Characterization of surface markers was done using human MSC phenotyping kit (MACS; Miltenyi Biotec, USA). The cells were incubated with the primary antibodies against CD 105, CD 90, CD 73, CD 14, CD 45, CD 20 and CD 34 for 10 minutes in the dark in the refrigerator. After primary antibody incubation, the cells were washed by centrifugation and were analyzed by flow cytometry (Cytoflex, BC, China). The source of antibodies used for ADMSC characterization is listed in Supplementary Table 1. The unstained control was used to acquire histogram of fluorescence against side scatter. The percentage of cells expressing the specific markers was estimated using FlowJo software (Tree Star Inc., USA). Adipogenic, osteogenic and chondrogenic differentiation of hADMSCs was done to prove the multipotency, using StemPro medium (Life Technologies, USA), as per the standard procedure. For adipogenic induction 1×10⁴ cells/cm2 and for osteogenic induction 5×10³ cells/cm2 respectively, were seeded and cultured in respective Stem Pro induction medium for 21 days with medium change once in three days. For chondrogenic differentiation, cells were seeded at high density as microdroplets and grown for 14 days in respective medium. Differentiation to adipogenic, osteogenic and chondrogenic lineages was confirmed by staining with Oil Red O, Alizarin Red S and Toluidine blue stains respectively, as per the standard protocols.
|
Name |
Isotype |
Source |
Catalog No. |
|
CD 105 PE |
Mouse IgG1 |
MSC Phenotyping Kit, MACS, Miltenyi Biotec |
130-095-198 |
|
CD 73 APC |
Mouse IgG1 |
||
|
CD 90 FITC |
Mouse IgG1 |
||
|
CD 14 PerCP |
Mouse IgG2a |
||
|
CD 45 PerCP |
Mouse IgG2a |
||
|
CD 20 PerCP |
Mouse IgG1 |
||
|
CD 34 PerCP |
Mouse IgG2a |
Supplementary Table 1: Source of antibodies used for ADMSC characterization.
Supplementary results
The isolated pADMSCs were plastic adherent and proliferated in 4-5 days (Supplementary Figure S1A, B).On further trypsinization and passaging, the cells were observed to grow as a monolayer with spindle morphology. Specifically stained cells in culture confirms the tri-lineage differentiation potential of isolated pADMSCs. Alizarin Red S stained (Supplementary Figure S2A), Oil Red O stained (Supplementary Figure S2B) and Toluidine Blue stained (Supplementary Figure S2C) cells in cultures of hADMSCs grown in each specific medium confirmed the osteogenic, adipogenic and chondrogenic lineage commitment, respectively. This confirmed the multipotency of the isolated cells. Flow cytometry analysis of P3 pADMSCs showed positivity in acceptable range for cell surface markers CD90, CD73 and CD105 and <2% positivity for haematopoietic markers CD14, CD34 and CD45 confirming that the proliferating cells are relatively pure MSCs (Supplementary Figure S2D).
Supplementary Figure S2: Representative images showing A) Osteogenic differentiation (Alizarin Red S staining); B) Adipogenic differentiation (Oil Red O staining); C) Chondrogenic differentiation (Toluidine Blue staining). Magnification of each image is marked using scale bar; D) Flow cytometry histogram shift of P3 pADMSC characterized using cell surface markers.
Supplementary Figure S3: Representative fluorescent images of control cells Fluorescent micrographs of (A) αSMA (green) in hASMC; (B) Calponin (green) in hASMC; (C) MHC11 (green) in undifferentiated pADMSCs; (D) PDGF R α (green) in undifferentiated pADMSCs. Cells are counterstained with DAPI (blue). Magnification of each image is marked using scale bar.
Supplementary Figure S4: Representative fluorescent images of control cells Fluorescent micrographs of (A) CD 31(green) in HUVEC; (B) eNOS (green) in undifferentiated hADMSCs; (C) VCAM-1(green) in undifferentiated hADMSCs; (D) VE-Cadherin (green) in undifferentiated hADMSCs. Cells are counterstained with DAPI (blue). Magnification of each image is marked using scale bar.
|
SMPC induction |
No. of nucleus/field |
No. of MHC11 stained cells/field |
Percentage of MHC11 stained cells/field |
Average |
SD |
|
Sample 1 |
23 |
21 |
91.3 |
86.5 |
7.96 |
|
Sample 2 |
53 |
41 |
77.3 |
||
|
Sample 3 |
33 |
30 |
90.90 |
Supplementary Table 2: Yield of MHC11 positive cells in differentiated SMPCs.
|
SMPC induction |
No. of nucleus/field |
No. of PDGF Rα stained cells/field |
Percentage of PDGF Rα stained cells/field |
Average |
SD |
|
Sample 1 |
30 |
28 |
93.33 |
86.26 |
6.23 |
|
Sample 2 |
31 |
26 |
83.87 |
||
|
Sample 3 |
38 |
31 |
81.58 |
Supplementary Table 3: Yield of PDGF Rα positive cells in differentiated SMPCs.
|
EPC induction |
No. of nucleus/field |
No. of CD31 stained cells/field |
Percentage of CD31 stained cells/field |
Average |
SD |
|
Sample 1 |
111 |
81 |
73 |
79.08 |
5.34 |
|
Sample 2 |
80 |
65 |
81.25 |
||
|
Sample 3 |
106 |
88 |
83.01 |
Supplementary Table 4: Yield of CD31 positive cells in differentiated EPCs.
|
EPC induction |
No. of nucleus/field |
No. of VCAM1 stained cells/field |
Percentage of VCAM1 stained cells/field |
Average |
SD |
|
Sample 1 |
33 |
27 |
81.81 |
87.6 |
5.07 |
|
Sample 2 |
23 |
21 |
91.3 |
||
|
Sample 3 |
29 |
26 |
89.65 |
Supplementary Table 5: Yield of VCAM1 positive cells in differentiated EPCs.


