Stage-Dependent Topographical and Optical Properties of Plasmodium Falciparum-Infected Red Blood Cells
Article Information
Katharina Preißinger1,2,3,4*, Petra Molnar1,2,3, Beata Vertessy1,2, Istvan Kezsmarki3,4, Miklos Kellermayer 5
1Department of Applied Biotechnology and Food Sciences, BME, 1111 Budapest, Hungary
2Institute of Enzymology, research Center for Natural Sciences, 1111 Budapest, Hungary
3Department of Physics, BME, 1111 Budapest, Hungary
4Department of Experimental Physics V, University of Augsburg, 86159 Augsburg, Germany
5Department of Biophysics and Radiation Biology, Semmelweis University, 1111 Budapest, Hungary
*Corresponding Author: Katharina Preißinger, Department of Experimental Physics V, University of Augsburg, 86159 Augsburg, Germany
Received: 04 August 2021; Accepted: 09 August 2021; Published: 08 September 2021
Citation:
Katharina Preißinger, Petra Molnar, Beata Vertessy, Istvan Kezsmarki, Miklos Kellermayer. Stage-Dependent Topographical and Optical Properties of Plasmodium Falciparum-Infected Red Blood Cells. Journal of Biotechnology and Biomedicine 4 (2021): 132-146.
View / Download Pdf Share at FacebookAbstract
Addressing the challenge of efficient malaria treatment requires in-depth understanding of the parasite maturation during the intra- erythrocytic cycle. Exploring the structural and functional changes of the parasite through the intra-erythrocytic stages and their impact on red blood cells (RBCs) is a cornerstone of antimalarial drug development. In order to precisely trace such changes, we performed a thorough imaging study of RBCs infected by Plasmo-dium falciparum, by using atomic force microscopy (AFM) and total internal reflection fluorescence microscopy (TIRF), supplemented with bright field microscopy (BFM) for stage assignment. This multifaceted imaging approach allows to reveal structure–function relations via correlations of the parasite maturation with morphological and fluore-scence properties of the host RBCs. We established diagnostic patterns characteristic to the parasite stages based on the topographical profile of infected RBCs, which show close correlation with their TIRF map. Furthermore, we found that hemozoin crystals exhibit a strong optical contrast, possibly due to the quen-ching of fluorescence, which can be used to locate hemozoin crystals within the RBCs and following their growth.
Keywords
Malaria; Plasmodium falciparum; Atomic force microscopy; Total internal reflection fluorescence microscopy; Red blood cells
Malaria articles Malaria Research articles Malaria review articles Malaria PubMed articles Malaria PubMed Central articles Malaria 2023 articles Malaria 2024 articles Malaria Scopus articles Malaria impact factor journals Malaria Scopus journals Malaria PubMed journals Malaria medical journals Malaria free journals Malaria best journals Malaria top journals Malaria free medical journals Malaria famous journals Malaria Google Scholar indexed journals Plasmodium falciparum articles Plasmodium falciparum Research articles Plasmodium falciparum review articles Plasmodium falciparum PubMed articles Plasmodium falciparum PubMed Central articles Plasmodium falciparum 2023 articles Plasmodium falciparum 2024 articles Plasmodium falciparum Scopus articles Plasmodium falciparum impact factor journals Plasmodium falciparum Scopus journals Plasmodium falciparum PubMed journals Plasmodium falciparum medical journals Plasmodium falciparum free journals Plasmodium falciparum best journals Plasmodium falciparum top journals Plasmodium falciparum free medical journals Plasmodium falciparum famous journals Plasmodium falciparum Google Scholar indexed journals Atomic force microscopy articles Atomic force microscopy Research articles Atomic force microscopy review articles Atomic force microscopy PubMed articles Atomic force microscopy PubMed Central articles Atomic force microscopy 2023 articles Atomic force microscopy 2024 articles Atomic force microscopy Scopus articles Atomic force microscopy impact factor journals Atomic force microscopy Scopus journals Atomic force microscopy PubMed journals Atomic force microscopy medical journals Atomic force microscopy free journals Atomic force microscopy best journals Atomic force microscopy top journals Atomic force microscopy free medical journals Atomic force microscopy famous journals Atomic force microscopy Google Scholar indexed journals Total internal reflection fluorescence microscopy articles Total internal reflection fluorescence microscopy Research articles Total internal reflection fluorescence microscopy review articles Total internal reflection fluorescence microscopy PubMed articles Total internal reflection fluorescence microscopy PubMed Central articles Total internal reflection fluorescence microscopy 2023 articles Total internal reflection fluorescence microscopy 2024 articles Total internal reflection fluorescence microscopy Scopus articles Total internal reflection fluorescence microscopy impact factor journals Total internal reflection fluorescence microscopy Scopus journals Total internal reflection fluorescence microscopy PubMed journals Total internal reflection fluorescence microscopy medical journals Total internal reflection fluorescence microscopy free journals Total internal reflection fluorescence microscopy best journals Total internal reflection fluorescence microscopy top journals Total internal reflection fluorescence microscopy free medical journals Total internal reflection fluorescence microscopy famous journals Total internal reflection fluorescence microscopy Google Scholar indexed journals Red blood cells articles Red blood cells Research articles Red blood cells review articles Red blood cells PubMed articles Red blood cells PubMed Central articles Red blood cells 2023 articles Red blood cells 2024 articles Red blood cells Scopus articles Red blood cells impact factor journals Red blood cells Scopus journals Red blood cells PubMed journals Red blood cells medical journals Red blood cells free journals Red blood cells best journals Red blood cells top journals Red blood cells free medical journals Red blood cells famous journals Red blood cells Google Scholar indexed journals Polymerase Chain articles Polymerase Chain Research articles Polymerase Chain review articles Polymerase Chain PubMed articles Polymerase Chain PubMed Central articles Polymerase Chain 2023 articles Polymerase Chain 2024 articles Polymerase Chain Scopus articles Polymerase Chain impact factor journals Polymerase Chain Scopus journals Polymerase Chain PubMed journals Polymerase Chain medical journals Polymerase Chain free journals Polymerase Chain best journals Polymerase Chain top journals Polymerase Chain free medical journals Polymerase Chain famous journals Polymerase Chain Google Scholar indexed journals Morphological articles Morphological Research articles Morphological review articles Morphological PubMed articles Morphological PubMed Central articles Morphological 2023 articles Morphological 2024 articles Morphological Scopus articles Morphological impact factor journals Morphological Scopus journals Morphological PubMed journals Morphological medical journals Morphological free journals Morphological best journals Morphological top journals Morphological free medical journals Morphological famous journals Morphological Google Scholar indexed journals RBCs articles RBCs Research articles RBCs review articles RBCs PubMed articles RBCs PubMed Central articles RBCs 2023 articles RBCs 2024 articles RBCs Scopus articles RBCs impact factor journals RBCs Scopus journals RBCs PubMed journals RBCs medical journals RBCs free journals RBCs best journals RBCs top journals RBCs free medical journals RBCs famous journals RBCs Google Scholar indexed journals Microscopy articles Microscopy Research articles Microscopy review articles Microscopy PubMed articles Microscopy PubMed Central articles Microscopy 2023 articles Microscopy 2024 articles Microscopy Scopus articles Microscopy impact factor journals Microscopy Scopus journals Microscopy PubMed journals Microscopy medical journals Microscopy free journals Microscopy best journals Microscopy top journals Microscopy free medical journals Microscopy famous journals Microscopy Google Scholar indexed journals fluorescence articles fluorescence Research articles fluorescence review articles fluorescence PubMed articles fluorescence PubMed Central articles fluorescence 2023 articles fluorescence 2024 articles fluorescence Scopus articles fluorescence impact factor journals fluorescence Scopus journals fluorescence PubMed journals fluorescence medical journals fluorescence free journals fluorescence best journals fluorescence top journals fluorescence free medical journals fluorescence famous journals fluorescence Google Scholar indexed journals
Article Details
Abbreviations
AFM – Atomic force microscopy; BFM – Bright field microscopy; PCR – Polymerase Chain Reaction; RBC – Red blood cell; TIRF – Total internal reflection fluorescence
1. Introduction
Every year, more than 200 million people are infected with malaria. Five species of the Plasmodium genus cause human malaria infection, among which P. falciparum is the most widespread and mainly responsible for severe malaria [1]. The protist is transmitted into the human body by mosquito bite. Following the liver stage, an asexual cycle of the parasites takes place in the blood stream: RBCs are invaded by merozoites. The parasites then mature into rings, trophozoites and finally to schizonts. Subse-quently they multiply, burst out of the host cell and begin the next cycle by invading new RBCs. This so-called intra- erythrocytic cycle has been the subject of intense research because it causes the main clinical symptoms and is the major target of antimalarial treatment and diagnostics. The digestion of hemoglo-bin by all Plasmodium species results in the accumu-lation of a micro- crystalline metabolic bypro-duct, called hemozoin, leading to morphological changes of the infected RBCs. In addition, due to their aniso-tropic magnetic and optical properties, hemozoin crystals have been considered as potential targets for magneto optical diagnosis [2-6], offering an alter-native to the standard bright field microscopy. During the early-ring stage of the parasites, the development of a cavity associated with early- ring forms is observed within the RBCs [7], which spreads and extends in the late- ring stage. Towards the tropho-zoite stage, when a considerable portion of the hemoglobin is already digested, the hemozoin content becomes concentrated in the form of co-aligned crystals within a single food vacuole of the parasite. During the trophozoite stage, the vacuole is settled to the side of the parasite, while growing further in size [7]. The prominent cavity disappears during matura-tion to the schizont stage.
By using AFM, Nagao E. et al. could correlate struct-ural alterations of the host RBCs with develop-mental stages of the parasite and determine their position inside the cell [8]. A closer investigation of the cyto-skeleton of the infected RBCs showed a correlation between changes in mechanical properties and altera-tions in cell morphology [9]. By combining infrared spectroscopy with AFM, Perez-Guaita D. et al. could map chemical and topographical variations over the infected RBCs without the need for contrast materials [10]. In addition to topographical charac-teristics, fluorescent properties were demon-strated to distin-guish between infected and healthy RBCs [11, 12]. The lower overall fluorescence intensity observed in infected cells was ascribed to the quenching of fluo-rescence by hemozoin.
In order to explore Plasmodium-induced morpho-logical and mechanical changes of infected RBCs, we combined AFM [8-10, 13, 14] and TIRF [15, 16] studies on a large number of RBCs containing ring, trophozoite and schizont forms, which were identified by BFM. We could establish a correlation between typical radial topographical profiles of infected RBCs and the Plasmodium development stages. This imag-ing approach facilitates the classification of parasite stages without the need for additional contrast materials, which is a clear advantage with respect to most of the methods commonly used for the identi-fication of malaria developmental stages, such as BFM microscopy on Giemsa-stained smears [17], Polymerase Chain Reaction (PCR) [18] and flow cytometry [19].
2. Morphological Changes in Infected RBCs
At first, we analyse the influence of the parasite maturation on the topography of RBCs. On this basis, we explore how this information can be used to classify the stages according to characteristic para-meters. In this work, we carried out a systematic AFM study on various unstained thin film smears of synchronized P. falciparum cultures, which were characteristic for the different developmental stages, classified by BFM. In total, we analysed the morphological properties of approx. 5300 RBCs. Representative BFM images of uninfected RBCs containing ring, trophozoite and schizont stages are shown in Figure 1(a)-(d). As seen in Figure 1(e), healthy RBCs show almost no surface deflection and appear as nearly flat in their partially dehydrated form within the smear. In the ring stage, a cavity at the position of the ring, typically close to the centre of infected RBCs, was detected. This cavity, being the hallmark of the ring-stage, has a sharp contour, as clearly resolved in Figure 1(f). Upon maturation to the trophozoite stage, the cavity widens, occupying up to half of the cell diameter and moving slightly off- centre, as seen in a topographic image typical to that stage in Figure 1(g). The topography in the schizont stage, displayed in Figure 1(h), reflects another radical transformation. The surface of the RBC becomes flat and featureless again, similarly to the healthy one, albeit displaying strong roughness. In addition, the contour of the cell is less regular, in stark contrast with the nearly cylindrical shape observed for uninfected RBCs and RBCs with earlier-stage para-sites.
To quantify the topographical features of RBCs, we extracted linear height profiles along various cross-sections through the centre of the cell using the custom-developed python program Intersect. The height is measured relative to the flat surface of the substrate. In the present study, we defined 18 radial cross- sections, so that one line profile was obtained in every 10°, as illustrated in Figure 1(e). The 18 height-profile curves obtained for each of the four representative RBCs are plotted in Figure 1(i)-(l). Notably, with the exception of the ring and early trophozoite stage, the typical height profiles are symmetric with respect to the centre of the cell (Figure 2), the typical height profiles are symmetric with respect to the centre of the cell. It is also clear from the height-profile curves that the height shows only weaker variations along the radius for uninfected cells and RBCs with schizonts, while it exhibits a large drop in RBCs with rings and trophozoites around the centre of the cells. By averaging these height-profile curves for a given cell, we can obtain the radial dependence of the height characteristic to that cell, as seen in Figure 1(m)-(q). In the average height profiles of the different stages, we can recognize the typical features already noticed in the 2D images: The flat featureless discoid shape of the uninfected RBC, the sharp central cavity in the ring, which becomes deeper and broader in the trophozoite stage and finally the rough landscape characteristic to the schizont stage.
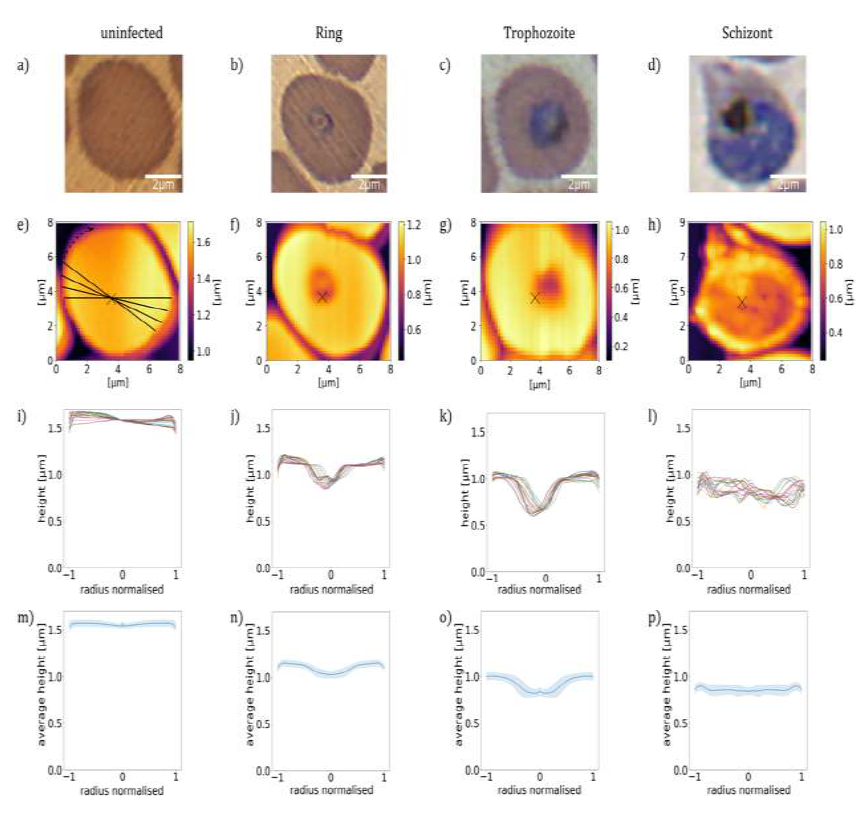
Figure 1: Morphology of RBCs infected by P. falciparum. (a)-(d): BFM images of RBCs in stained smears. (e)-(h): AFM topography images recorded over the same areas as the BFM images above. The centre of the cell is indicated by a black cross. (i)-(l): Radial height profiles of RBCs as obtained by radial cross-sections of the AFM topographic images, normalised to the radius of the cell. Black lines in the (e) indicate the path of the radial cross-sections. (m)-(p): Mean height profiles obtained by averaging the cross-sections (i)-(l). The standard deviation of the height is indicated by the shaded region around the curves. The height is measured relative to the flat surface of the substrate.
The average height of the RBC is gradually reduced from that of the uninfected one in the course of the parasite maturation. Differences in the average radial height profiles between the stages, depicted in Figure 1(m).(q), may be exploited for the stage-specific classification of infected RBCs. One has to note at the same time that by averaging of the radial cuts we lose the information about the asymmetry of the cells, arising from e.g. off-centred parasites, which is particularly important for rings and early trophozoites. However, this information is partially captured by the standard deviation of the height, as represented by the shaded area around the average height- profile curve. The standard deviation is not fully governed by the asymmetry of the height profiles, but short-scale surface roughness can contribute to it too. In the following, we will show that the morphological features discussed here in relation to the exemplary cells of different stages, displayed in Figure 1, are characteristic to the corresponding stages in general.
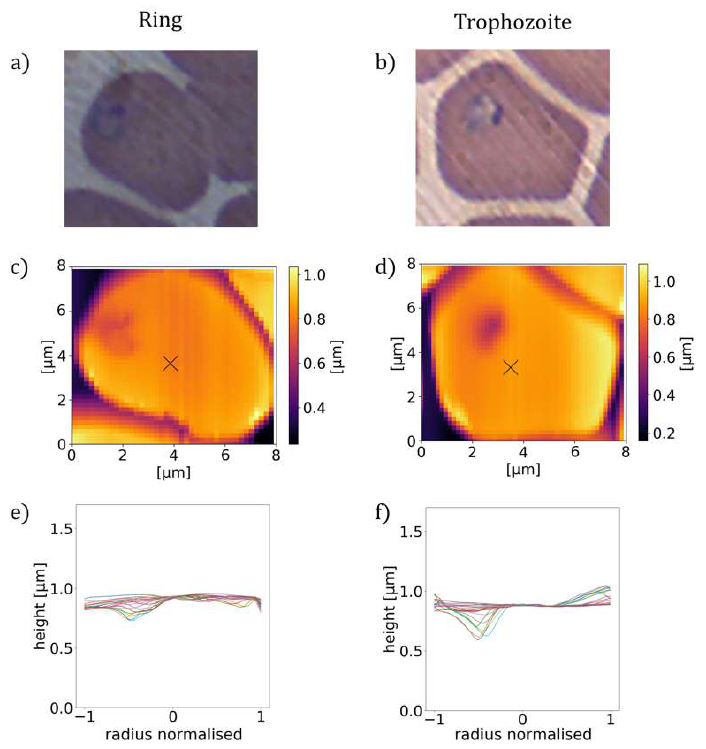
Figure 2: Asymmetric height profiles of P. falciparum-infected RBCs. (a), (b): BFM images of RBCs infected with ring and early trophozoite stage parasites in stained smears. (c), (d): AFM topography images of RBCs containing ring stage parasites (c), and early trophozoite stage parasite (d) together with radial cross-sections (e), (f) showing the asymmetry of the height profiles.

Figure 3: Height profiles of P. falciparum-infected RBCs. Master curves representing the typical height profiles of RBCs containing no parasites (a) and ring (b), trophozoite (c) and schizont (d) stages of P. falciparum. The height profile curves typical for a given stage were obtained by averaging approx. 5300 radial height-profile curves of at least 260 individual RBCs corresponding to the same stage. The shaded regions indicate the standard deviation. The radial height profile curves for individual RBCs are shown in the last row of Figure 1.
For further analysis, using BFM, we sorted all topography images according to the parasite stages into the four categories discussed before (uninfected, ring, trophozoite, schizont). In order to identify key features the different stages, the radial height profiles were determined for every cell by the averaging process described above.
Then, these radial height profiles were averaged for all cells of the same stage, i.e. for 5300 cells in total and at least 260 for each stage, to obtain a master curve describing the typical morphology of a given stage. These master curves, shown in Figure 3(a)-(d), reproduce the key features observed for individual cells of the corresponding stages in Figure 1(m)-(q).
The mean height hmean is nearly the same for the uninfected RBC and for the ring stage, while it shows a significant reduction in the trophozoite and schizont stages. More interestingly, the height drop hdiff from the maximum at the cell edge to the minimum near the centre shows a more pronounced dependence on the stages.
This radial variation of the height is approx. ∼10%, ∼35%, ∼45% and ∼20% of the mean height for the uninfected RBC and for the ring, trophozoite and schizont stages, respectively. These values together with the values of the mean height are also plotted in Figure 4.
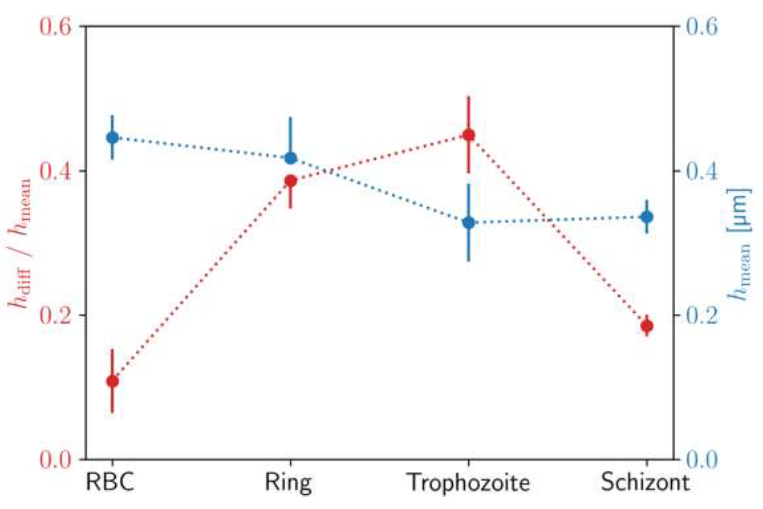
Figure 4: Characteristic identification pattern for height profiles of P. falciparum stages. Mean height hmeanof the RBCs and difference between maximum and minimum height divided hdiffby mean height along the radius for different developmental stages of P. falciparum. The standard deviation of the values is shown in the error bars. These parameters were calculated from the master curve of each stage, shown in Figure 3.
Furthermore, the standard deviation of the height (indicated as a shaded area around the master curves) increases towards the centre in the trophozoite stage, while its radial dependence is weaker in the other three cases. Our observations show that these key features comprise an essential part of the information encoded in the 2D images. In fact, the extraction of characteristic parameters from the AFM images reveals a distinct radial pattern for each stage, thus can potentially be used to distinguish between the stages.
3. Fluorescence Properties of P. falciparum
In the following, we investigate if the maturation of the Plasmodium parasites can be traced via the fluorescent properties of the infected RBCs. Matu-ration of the malaria parasite changes not only the structure, hence the topography of the RBCs but also its optical properties. In TIRF microscopy images of infected RBCs, recorded with an excitation wavelength of 405 nm and shown in Figure 5(e)-(h), foci of fluorescence emission appeared. The 405 nm wavelength was chosen to be in resonance with the strongest absorption peak in protoporphyrin [20, 21]. Simultaneously we recorded BFM images on the same cells, displayed in Figure 5(a)-(d) to identify the stage of the parasites.
In our TIRF study, the sampling layer was approx. 100 nm and the sample was much larger that the excitation volume of the laser. Therefore, the evanescent wave field generated by the laser beam can excite the whole sample and we can exclude a strong influence of an inner filter effect on our measurements. Figure 5(e)-(h) show representative images for each stage out of the approx. 80 RBCs simultaneously investigated by TIRF and BFM.
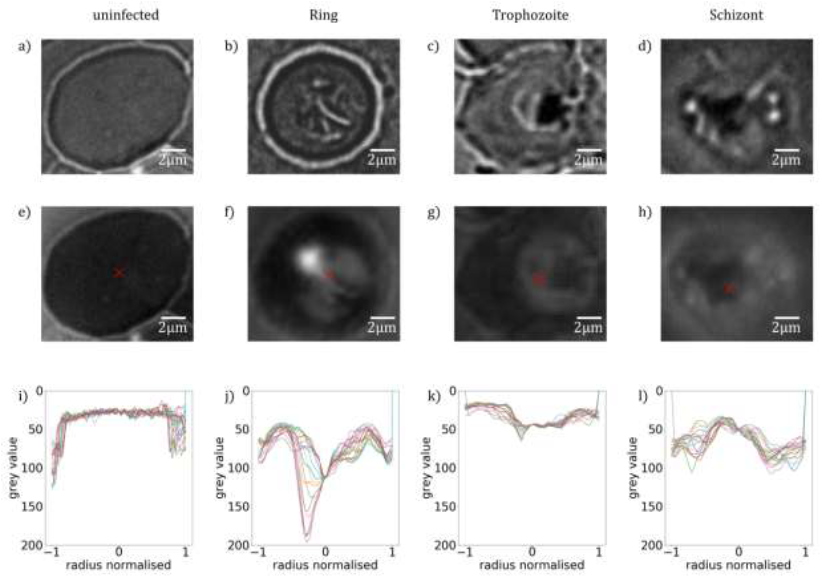
Figure 5: Fluorescence maps of RBCs infected with P. falciparum. BFM (a)-(d) and TIRF images (e)-(h) showing the fluorescence properties of RBCs with no parasite (e), with ring (f), with trophozoite (g) and schizont (h) stage P. falciparum parasites, as studied by TIRF. The red cross marks the centre of the cell. (i)-(l): Radial fluorescence intensity profiles for the different stages, obtained as radial cross-sections of the images above.
We observed a clear variation of the fluorescence pattern upon maturation. The uninfected RBC shows no fluorescence, as evident from the low and uniform signal in Figure 5(e), detected over the whole area of the cell. In the ring stage, a small spot with high fluorescence intensity can be observed in Figure 5(f), which is connected to a more extended region of moderate fluorescence, embedded in the otherwise non-fluorescent cell. A central region in the tropho-zoite stage emits a diffuse signal surrounded by a non- fluorescent edge region of the cell, as seen in Figure 5(g). The diffuse region extends nearly over the cell diameter in the schizont stage, but quenching of the fluorescence is found close to the centre, visible as a dark spot in the middle of Figure 5(h). A similar non-fluorescent region, though smaller, can already be observed in the trophozoite stage. Based on the recorded fluorescence intensity profile, we performed a similar evaluation as for the topography in the AFM images. We cut the cell into radial cross-sections and plot the intensity of the TIRF images along these radial cuts. These radial TIRF profiles are plotted in Figure 5(i)-(l) for each stage. For a more direct comparison with the AFM results, the spectra were inverted, so that the intensity increases from the top to the bottom. The radial TIRF profiles show distinct patterns for each stage and closely resemble the radial height profiles of the corresponding parasite stages (see Figure 1(i)-(l)).
We found a central non-fluorescent region inside the RBCs infected by trophozoite and schizont stages. We expect that the lack of fluorescence correlates with the location of the food vacuole, containing the hemozoin crystals. In fact, the hemozoin is not the source of fluorescence in infected RBCs, as discussed later, though the revelation of the molecular origin of fluorescence goes beyond the scope of the present study.
4. Discussion
By combining AFM, TIRF and BFM, we charac-terized the developmental stages of P. falciparum parasites in thin smears of synchronized cultures. Our data demonstrate that the maturation of the parasite not only changes the morphology of the RBCs but also results in the emergence of fluore-scence emission with a pattern specific to the parasite stages. Via a statistical analysis of the height profiles of RBCs, we could reveal key topographical features.
The average height of the cell, the maximum variation of its height along the radius together with the standard deviations of the radial height profiles are characteristic to the different stages. Our results on morphology support the observations reported about the maturation of malaria parasites by Grüring et al [7]. While the uninfected RBC, the late trophozoite and schizont stages are rather symmetrical to the centre of the cell, the symmetry is usually disrupted in the ring an early trophozoite stage. In addition, the combined BFM and TIRF imaging studies provided information about the auto-fluorescence properties of Plasmodium infected RBCs and their variation with the age of the parasites. We found that uninfected cells emit no detectable fluorescence when excited at 405 nm, while fluorescence emission can be detected in infected RBCs during maturation. The signal changed from a well-defined indentation in the ring stage to a diffuse pattern in the schizont stage. In the TIRF map of trophozoite and schizont stages Figure 6(e) and (f), we identified non-fluorescent regions inside the fluorescent parasite. An additional TIRF study on extracted hemozoin crystals showed no fluorescence emission (see. Figure 6(d)). This imp-lies that we can locate hemozoin in the infected RBCs using TIRF via their non-fluorescent nature, when choosing the excitation wavelength properly.
However, one has to note that TIRF is a surface sensitive method with a penetration depth of ∼ 200 nm [22], which may introduce limitations to its applicability. In addition to its fluorescence contrast, the food vacuole can also be resolved in the topography images, as depicted in Figure 7 for the trophozoite stage.
When comparing the fluorescence maps with the topography images, respectively shown in Figure 5 and 1, we observe a clear correlation. The features characteristic to the different parasite stages appear in the two types of images in a similar fashion. Most interestingly, our hypothesis that the central peak observed in the height profiles for trophozoites and schizonts corresponds to the food vacuole is supported by the TIRF studies. Figure 6(b) and (c) display BFM and TIRF images simultaneously recorded on RBCs containing trophozoites and schizonts, respectively. The food vacuole appears as a dark spot within the parasite in both cases. The non-fluorescent nature of hemozoin is evident in Figure 6(d) using TIRF microscopy on extracted hemozoin crystals. We believe that the darkness of the food vacuole is caused by self-quenching of chemically identical fluorophores. However, the source of fluorescence requires further studies.
Our experiments clearly illustrate the connection of RBC morphology and fluorescence properties to the maturation of P. falciparum. These observations can help to establish structure–function relations, which are useful to reveal the detailed mechanisms governing the intracellular parasite activity and eventually to guide the development of new ant-imalarials. From the statistical difference in the radial height profile of RBCs, we could derive identification patterns characteristic to the different parasite stages. These closely correlate with typical fluorescence maps of the cells. Furthermore, the topographical and optical features provide a tool to locate hemozoin crystals. Revealing connections between the structure and the hemozoin content of RBCs, and their consequences on the optical properties are highly relevant for recent diagnostic schemes targeting at hemozoin, like the rotating-crystal magneto- optical diagnosis [5, 6].
Nevertheless, the present study, performed on fixed cells, has some inherent limitations. Under such conditions, the shape of the RBCs is deformed, i.e. the cells are flattened, and their mechanical properties are also altered by partial dehydration. Furthermore, the smears only show a snapshot of the parasite life cycle. By extending the experiments to living parasites, more detailed and realistic information about the parasite maturation can be obtained. However, performing multi-probe imaging under conditions close to those in the human body requires simultaneous liquid AFM and TIRF studies on parasite cultures, which is a highly challenging task.
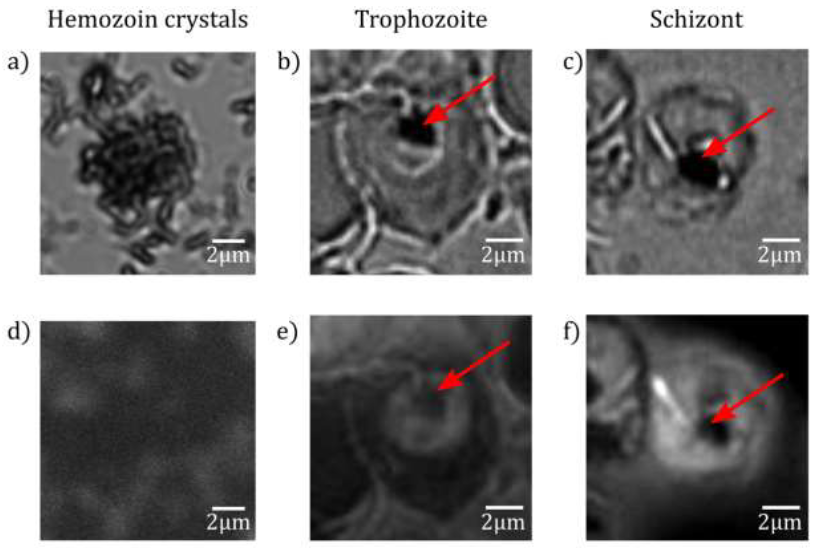
Figure 6: Fluorescence maps of hemozoin crystals. BFM (a)-(c) and TIRF (d)-(f) images of extracted hemozoin crystals. The extracted hemozoin crystals show no fluorescence (d). In the RBC infected with trophozoite (e) and schizont (f), the non-fluorescent regions are indicated by red arrows.
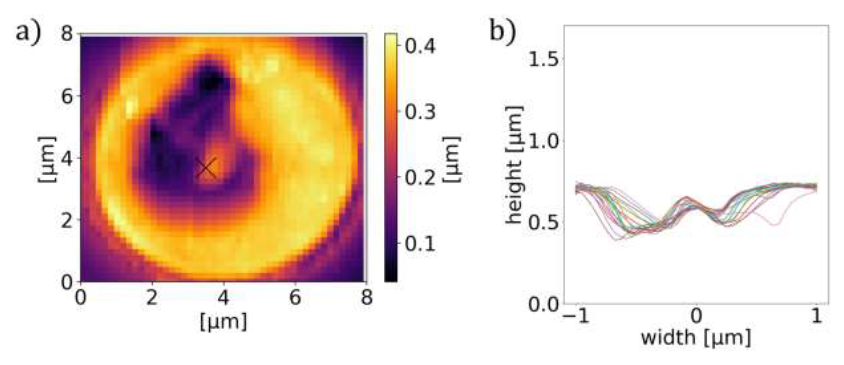
Figure 7: Characteristic cross-section of P. falciparum-infected RBCs. AFM image (a) and the corresponding radial cross-sections of the height (b) for RBCs containing a trophozoite. The cross- section shows a maximum around the centre of the cell in both cases.
5. Methods
5.1 Sample preparation
- falciparum parasites from the laboratory adapted strain 3D7 were cultured in culture medium (Albumax, 25 mg/L Gentamycin, RPMI 1640) and maintained in an atmosphere of 5 % CO2 and 5 % O2 as in previous studies [3, 4, 23]. The cultures were raised to 5 % parasitemia and treated with Percoll or Sorbitol to synchronise the parasites. For the AFM measurements, we sorted the schizont stage parasites from other stages. For this, cultured parasites were added to 5 ml of Percoll and centrifuged, layering them according to their densities.
The schizonts, having the smallest density of the developmental stages, could be recovered from the first layer [24]. After centrifugation, 1.2 µl of the remaining pellet of RBCs with enriched parasitemia were used to make a thin film smear on VWR microscope slides (90° ground edges, nominal thickness 0.8 - 1.0 mm). This procedure was repeated for ring stage parasites, which were sorted by Sorbitol treatment [17]. To classify the parasites after the morphology measurement, the smears were stained with Giemsa’s stain [18].
5.2 Morphological measurements
For the morphological measurements of the dried smears, we used an MFP-3D AFM (Asylum Research, Oxford Instruments). It was operated in AC mode at a scanning speed of 0.25 Hz. Scan areas of 90 x 90 μm were collected to analyse the morphology of RBCs. Each scan was performed with a resolution of 512 x 512 pixels. We used an OTESPA-R3 cantilever from Bruker with a rectangular shape, a tip radius of 7-10 nm, a spring constant of 26 N/m, which was operated at a frequency of 280-300 kHz with a drive amplitude of 250 - 300 mV. For the set up and acquisition of the AFM measurement, we used Igor Pro 6.37.
5.3 Fluorescence measurements
For the analysis of fluorescence properties of P. falciparum, we used a TIRF microscope, which was operated at a wavelength of 405 nm. The smears were prepared on a cover slip and dried in air before the measurement. TIRF microscopy was carried out by using an Olympus IX81 inverted microscope equipped with the TIRF module (Kellermayer et al., Biophys. J. 91, 2665-2677, 2006). An Olympus TIRF objective (UApo N, 100x, 1.49NA) was used through-out the experiments. For excitation, an OMICRON (Rodgau-Dudenhofe, Germany) LaserHub containing four independent laser sources (488 nm 120 mW CW diode, 488 nm 200 mW CW diode, 561 nm 156 mW CW DPSS, 642 nm 140 mM CW diode) was used via a single-mode fiber optic cable coupling to the TIRF module. The lasers were operated at 5% power, controlled by the OMICRON Control Center software (v.3.3.19). TIRF images were collected through a quad-band dichroic mirror and emission filter set (TRF89901-EM-ET- 405/488/561/640, Chroma Technology, Bellows Falls, VT USA), by using an EM- CCD camera (Andor iXon DU-885K-CSO- #VP, Oxford Instruments). To carry out the TIRF measure-ments, the red blood cell smear was prepared on #1 coverslips (nominal thick-ness 150 μm). We mea-sured 26 healthy cells as well as 1 RBC infected with ring, 13 infected with trophozoite and 38 infected with schizont stage parasites.
5.4 Evaluation program Intersect
The data we analysed was obtained from the height trace and the amplitude of each AFM scan. We investigated 3953 healthy cells as well as 328 RBCs infected with ring, 265 infected with trophozoite and 750 infected with schizont stage parasites. The data was opened with Igor Pro 6.37 and exported as space-delimited txt-files. To analyse the txt- files, we wrote the program Intersect, which reads the data and saves it as an array. Then, it is translated to an image. By thresholding this image by a manually chosen height value, we were able to detect all cells in the scan with algorithms from scikit-image. In the resulting binary image, we determined the contour of each cell and marked the cell with a rectangle. Then, we identified the coordinates inside the contour. With those, we calculated the geometric centre rgeo of the cell.

To characterise the cells by height profile, we determined 18 cross-sections through the centre of each cell, which were rotated in the cell plane by an angle of 10°, so that every pixel along the outline of the cell was covered. Each cross-section ends at the contour of the cell and is therefore equal to the perimeter at the position of the cut. To obtain cross-sections of equal length, we determined the cross- sections with the highest number of points and interpolated the ones with a smaller number. Then, we normalised the radius to range from -1 to 1. To describe a single cell, radial sections through the cell were averaged by height. For this, we averaged each point of the cross-section by their position on the along the radius of the cell and calculated the standard deviation.
Subsequently, those sections were radially averaged and then mirrored to represent the average cut through the cell. For the calculation of the master curves, we used the 18 cross-sections and averaged each line for all cells of one stage. From the average 18 cross-sections, we calculated the master curve as the average of each point by position on the cross-section together with the standard deviation. The final curve represents an average cut through a RBC.
Acknowledgements
The research carried out here was supported by the National Research, Development and Innovation Office of Hungary (K119493, VEKOP-2.3.2-16-2017-00013 to BGV, NKP- 2018-1.2.1-NKP-2018-00005), the BME-Biotechnology FIKP grant of EMMI (BME FIKP-BIO), the BME-Nanotechnology and Materials Science FIKP grant of EMMI (BME FIKP-NAT), the National Heart Programme (NVKP-16-1- 2016-0017), K124966 and K135360 to MK, National Bionics Programme ED_17-1-2017- 0009 and SE FIKP-Therapy Grant.
Author Contributions Statement
K.P. and P.M. cultured the parasites and prepared the samples. K.P. and M.K. performed the experiment, K.P. analysed the data. All authors contributed to the discussion and writing of the manuscript. I.K. and M.K. supervised the project. All authors reviewed the manuscript.
Additional Information
Competing Interests
The authors declare no competing interests.
References
- Organization World Health. Malaria (2019).
- Newman DM, et al. A magneto-optic route toward the in vivo diagnosis of malaria: preliminary results and preclinical trial data. Biophys. J 95 (2008): 994-1000.
- Orbán Á, et al. Evaluation of a novel magneto-optical method for the detection of malaria parasites. PLoS ONE 9 (2014): 1-8.
- Orban A, et al. Efficient monitoring of the blood-stage infection in a malaria rodent model by the rotating-crystal magneto-opti-cal method. Sci. Reports 6 (2016): 1-9.
- Butykai A, et al. Malaria pigment crystals as magnetic micro-rotors: Key for high- sensiti-vity diagnosis. Sci. Reports 3 (2013): 1-10.
- Arndt L, et al. Magneto-optical diagnosis of symptomatic malaria in Papua New Guinea. Nat. Commun 12 (2021): 1-10.
- Grüring C, et al. Development and host cell modifications of Plasmodium falciparum blood stages in four dimensions. Nat. comm-unications (2011).
- Nagao E, Kaneko O, Dvorak JA. Plasmo-dium falciparum-infected erythrocytes: Qua-litative and quantitative analyses of parasite-induced knobs by atomic force microscopy. J. Struct. Biol 130 (2000): 34-44.
- Shi H, et al. Life Cycle-Dependent Cyto-skeletal Modifications in Plasmodium falci-parum Infected Erythrocytes. PLoS ONE 8 (2013): 1-10.
- Perez-Guaita D, et al. Multispectral Atomic Force Microscopy-Infrared Nano-Imaging of Malaria Infected Red Blood Cells. Anal. Chem 90 (2018): 3140-3148.
- Masilamani V, et al. Fluorescence spectral diagnosis of malaria–a preliminary study. Diagn. Pathol (2014): 1-7.
- Opoku-ansah J, Eghan MJ, Anderson B, et al. Laser-Induced Autofluorescence Techni-que for Plasmodium falciparum Parasite Density Estimation. Appl. Phys. Res 8 (2016): 43-51.
- Nanoscience Instruments. Atomic force microscopy (2019).
- Scudiero L, et al. Comparisons of the topographic characteristics and electrical charge distributions among Babesia- infected erythrocytes and extraerythrocytic merozoi-tes using AFM. J. Microsc 271 (2018): 84-97.
- Ross ST, Schwartz S, Fellers T J, et al. Total internal reflection fluorescence (TIRF) microscopy (2019).
- Fish KN. Total internal reflection fluore-scence (TIRF) microscopy. Curr Protoc Cytom. 2009 Oct;Chapter 12: Unit12.18 (2009).
- Shute PE, Maryon ME. Laboratory technique for the study of malaria (J. and A. Churchill, London, 1960), 2nd edn.
- Kasetsirikul S, Buranapong J, Srituravanich W, et al. The development of malaria diag-nostic techniques: A review of the appro-aches with focus on dielectrophoretic and magnetophoretic methods. Malar. J 15 (2016): 358.
- Kollipara P. IR Spectroscopy quickly detects malaria at early stages (2014).
- Hennig G, et al. Dual-wavelength excitation for fluorescence-based quantification of zinc protoporphyrin IX and protoporphyrin IX in whole blood. J. Biophotonics 524 (2014): 514-524.
- Roberts DW, et al. Red-light excitation of protoporphyrin IX fluorescence for sub-surface tumor detection. J. Neurosurg 128 (2018): 1690-1697.
- Ockenga W. Total internal reflection fluo-rescence (TIRF) (2012).
- TragerW, Jensen J. Human malaria parasites in continuous culture. Science 193 (1976): 73-675.
- Rivadeneira EM, Wasserman M, Espinal CT. Separation and Concentration of Schizonts of Plasmodium falciparum by Percoll Grad-ients. The J. Protozool 30 (1983): 367-370.
