Scrutinising the COVID-19 Data on 10.676.000 Cases. A Novel Method using Retrospective, Population-based Descriptive Study for Data Quality Surveillance and a Review at 181.426.000 Cases
Article Information
Oriol Gallemí Rovira*
IQS School of Engineering, Ramon Llull University, Barcelona, Spain
*Corresponding Author: Oriol Gallemí Rovira, IQS School of Engineering, Ramon Llull University, Via Augusta 390, E-08017, Barcelona, Spain
Received: 07 July 2021; Accepted: 16 August 2021; Published: 01 December 2021
Citation: Oriol Gallemí Rovira. Scrutinising the COVID-19 Data on 10.676.000 Cases. A Novel Method using Retrospective, Population-based Descriptive Study for Data Quality Surveillance and a Review at 181.426.000 Cases. Archives of Clinical and Medical Case Reports 5 (2021): 906-926.
View / Download Pdf Share at FacebookAbstract
Background: Reports on the detected positive patients with COVID-19 are as per today the best estimation of a country spread of the pandemic. In order to evaluate the early indicators for true lethality and recovery time, the data where the model is built must be quality checked. Each country sets different procedures and criteria for fatality count due to COVID-19 and the health system is stressed due to insufficient testing capabilities, untracked infectious and premature discharges. In this paper the dynamics behind such data quality issues are discussed throughout the clinical course to support better modeling and decision-making processes in a stressed healthcare system.
Methods: Based on data compiled and relayed by the Johns Hopkins University, tracking COVID-19 over 10.675.596 infections (July, 1st, 2020), the data is clustered and compared with discrete regression. Regression parameters are restricted by a time interval of 1 day and must be consistent and explanatory on the diagnostic (i.e. a fatality cannot occur before the patient displays symptoms). Cumulative infection curves are taken and built by holding a zero when the infections were lowest at the northern hemisphere. Data is picked from JHU consolidated repository. Infection synthetic curves are built from the Fatality count and the Recovered patient count. The adjusted parameters are τ=time to fatality (days), δ=time to discharge of recovered patients (days) and φ=case fatality rate (CFR in per unit, P.U.). Therefore, the discharge rate (recovery rate) is forced to be (1- φ). Also, a recovery coverage is set in order to determine the number of untracked discharged patients.
Using forward or backward calculations have no influence than the time reference. In both circumstances, time from Onset and Symptoms are neglected and shall be added if suc
Keywords
COVID-19; Infections
COVID-19 articles; Infections articles
SARS-CoV-2 articles SARS-CoV-2 Research articles SARS-CoV-2 review articles SARS-CoV-2 PubMed articles SARS-CoV-2 PubMed Central articles SARS-CoV-2 2023 articles SARS-CoV-2 2024 articles SARS-CoV-2 Scopus articles SARS-CoV-2 impact factor journals SARS-CoV-2 Scopus journals SARS-CoV-2 PubMed journals SARS-CoV-2 medical journals SARS-CoV-2 free journals SARS-CoV-2 best journals SARS-CoV-2 top journals SARS-CoV-2 free medical journals SARS-CoV-2 famous journals SARS-CoV-2 Google Scholar indexed journals COVID-19 articles COVID-19 Research articles COVID-19 review articles COVID-19 PubMed articles COVID-19 PubMed Central articles COVID-19 2023 articles COVID-19 2024 articles COVID-19 Scopus articles COVID-19 impact factor journals COVID-19 Scopus journals COVID-19 PubMed journals COVID-19 medical journals COVID-19 free journals COVID-19 best journals COVID-19 top journals COVID-19 free medical journals COVID-19 famous journals COVID-19 Google Scholar indexed journals pandemic articles pandemic Research articles pandemic review articles pandemic PubMed articles pandemic PubMed Central articles pandemic 2023 articles pandemic 2024 articles pandemic Scopus articles pandemic impact factor journals pandemic Scopus journals pandemic PubMed journals pandemic medical journals pandemic free journals pandemic best journals pandemic top journals pandemic free medical journals pandemic famous journals pandemic Google Scholar indexed journals pneumonia articles pneumonia Research articles pneumonia review articles pneumonia PubMed articles pneumonia PubMed Central articles pneumonia 2023 articles pneumonia 2024 articles pneumonia Scopus articles pneumonia impact factor journals pneumonia Scopus journals pneumonia PubMed journals pneumonia medical journals pneumonia free journals pneumonia best journals pneumonia top journals pneumonia free medical journals pneumonia famous journals pneumonia Google Scholar indexed journals Prolotherapy articles Prolotherapy Research articles Prolotherapy review articles Prolotherapy PubMed articles Prolotherapy PubMed Central articles Prolotherapy 2023 articles Prolotherapy 2024 articles Prolotherapy Scopus articles Prolotherapy impact factor journals Prolotherapy Scopus journals Prolotherapy PubMed journals Prolotherapy medical journals Prolotherapy free journals Prolotherapy best journals Prolotherapy top journals Prolotherapy free medical journals Prolotherapy famous journals Prolotherapy Google Scholar indexed journals treatment articles treatment Research articles treatment review articles treatment PubMed articles treatment PubMed Central articles treatment 2023 articles treatment 2024 articles treatment Scopus articles treatment impact factor journals treatment Scopus journals treatment PubMed journals treatment medical journals treatment free journals treatment best journals treatment top journals treatment free medical journals treatment famous journals treatment Google Scholar indexed journals CT articles CT Research articles CT review articles CT PubMed articles CT PubMed Central articles CT 2023 articles CT 2024 articles CT Scopus articles CT impact factor journals CT Scopus journals CT PubMed journals CT medical journals CT free journals CT best journals CT top journals CT free medical journals CT famous journals CT Google Scholar indexed journals lymphadenopathy articles lymphadenopathy Research articles lymphadenopathy review articles lymphadenopathy PubMed articles lymphadenopathy PubMed Central articles lymphadenopathy 2023 articles lymphadenopathy 2024 articles lymphadenopathy Scopus articles lymphadenopathy impact factor journals lymphadenopathy Scopus journals lymphadenopathy PubMed journals lymphadenopathy medical journals lymphadenopathy free journals lymphadenopathy best journals lymphadenopathy top journals lymphadenopathy free medical journals lymphadenopathy famous journals lymphadenopathy Google Scholar indexed journals surgery articles surgery Research articles surgery review articles surgery PubMed articles surgery PubMed Central articles surgery 2023 articles surgery 2024 articles surgery Scopus articles surgery impact factor journals surgery Scopus journals surgery PubMed journals surgery medical journals surgery free journals surgery best journals surgery top journals surgery free medical journals surgery famous journals surgery Google Scholar indexed journals Torticollis articles Torticollis Research articles Torticollis review articles Torticollis PubMed articles Torticollis PubMed Central articles Torticollis 2023 articles Torticollis 2024 articles Torticollis Scopus articles Torticollis impact factor journals Torticollis Scopus journals Torticollis PubMed journals Torticollis medical journals Torticollis free journals Torticollis best journals Torticollis top journals Torticollis free medical journals Torticollis famous journals Torticollis Google Scholar indexed journals
Article Details
1. Introduction
Beginning in December 2019, a cluster of cases of pneumonia with unknown cause was reported in Wuhan, in the Hubei province of China and by December 31st, the Chinese government raised its concerns to the WHO and closed the potential source, a trade market from Wuhan. On January 23rd, China declares a local lockdown and by January 25th an extended lockdown with more restrictive measures in place. By January 30th, WHO does not consider to be a Public Health Emergency of International Concern [3]. A novel virus form denominated SARS-CoV-2 is sequenced and found to be fast adapting to new species infection, being humans among its hosts which develop the denominated COVID-19 disease. WHO declares the pandemic status by March 11th 2020 [4]. Since the Chinese alert, the number of cases has exhibited a pandemic profile worldwide with an estimated CFR above 2%, and a strong human-to-human transmission, and weaker to human-to-animal.
1.1 Research in context
1.1.1 Evidence before this study: Before this study, we searched Google Scholar, Elsevier and Springer repositories until March 25th, 2020 for articles describing the COVID-19 clinical course, symptomatic features, prognosis and epidemic modeling. SARS and MERS keywords were also used to extend the search on useful articles and lessons learnt from the past outbreaks. Data is updated as per June 28th 2021 from the JHU and the Spanish Health Ministry. Diverse data sources were found and the Johns Hopkins University repository on Github was selected for its continuous efforts to refine and curate the data released.
1.1.2 Added value of this study: We developed a tool to validate raw data quality and to build reliable estimators for real infections in a control region. As collateral outputs, we have estimates of COVID-19 features as Time to Fatality, Time to Recovery and Case Fatality Rate as well as a minimum Infections estimator. Such indicators can be used to assess detection procedures, having a large population of over 181.426.000 detected infections worldwide. Our findings emphasize the relevance of proper data collection in early stages of an outbreak and provide insights on the procedures during the expansion, to validate the healthcare measures in place and its effects, suggesting potential improvement paths and proposing further lines of study to support fast data-driven, effective and efficient decision-making under pressure.
1.1.3 Implications of all the available evidence: COVID-19 has a fast cycle on elder and sensitive subjects, leading to sudden ARDS (Acute Respiratory Distress Syndrome) and fast death since onset. By including data validation in early stage, the healthcare system capacity can be quickly prepared for the wave, triggering the response procedures earlier. We focused our expert research on data and modelling, in order to define a clinical course based on reliable sources [5-7] to feed an explainable and actionable numerical model and contrast different data sources and to assess both the data quality and the clinical course estimators. Estimating the real number of infections is found to be of paramount relevance in order to stop COVID expansion and other estimators [8] under study can complement the minimum found with the explained method. Our main goal is to support decision-making and to deliver open tools for procedure setup and early actuation.
2. Methods
2.1 Study design
Based on data compiled and relayed by the Johns Hopkins University, tracking COVID-19 over 4.540.000 cases (march 27th, 2020), the data is clustered and compared with discrete regression. For reference, the same method is also applied to selected regions on 181.426.000 cases. Regression parameters are constrained by a time interval of 1 day and must be meaningful for the diagnostic (i.e. a fatality cannot occur before the patient displays symptoms). Cumulative infection curves are taken and built. Infection baseline is based on the country official declaration. Infection synthetic curves are built from the Fatality count and the Recovered patient count. The adjusted parameters are τ=time to fatality (days), δ=time to discharge of recovered patients (days) and φ=case fatality rate (CFR in per unit, P.U.). Therefore, the discharge rate is forced to be (1- φ). Estimating the case fatality rate (CFR) during an outbreak is a complex work as data is incomplete, inconsistent, delayed and biased. Once the outbreak is complete, the CFR best estimator is:

As the epidemic is still ongoing, estimators can be inconsistent and misleading as the data is strongly deformed by detection bias and delays:
- Incomplete: Sample size is small to be not representative of a larger population. Studies of a few individuals deliver wide Confidence Intervals (CI) which make them insufficiently representative. To complete the sample, testing must be extended. Comparing national standard mortality deviations against Counted Fatalities from Detected Cases can estimate the degree of data completeness.
- Inconsistent: Each hospital, province and state set different standards for prognosis and considers admissions and discharges upon a wide spectrum of diagnose.
- Delayed: Admissions are accepted once symptoms become evident. Therefore, the incubation period is completed and beyond. Recovered patients are discharged upon symptomatic relief after hospitalization time, albeit the viral load may still be present in the recovered patient.
- Biased: Patients attending the hospital are mobility constrained. Elder and younger patients use to be accompanied, exposing young adults to infection. This is a potential source of biased sample demographics attended at the hospital with an over-representation of mid-aged patients over a true population pyramid. Another bias is that there is no control group in the general population and there is no way to precisely quantify the real spread of COVID-19 at the moment of writing.
To provide a meaningful CFR and Hospitalization Rate (HR), time and bias must be included in the time-count model. The reconstruction formulas for infections become (Eq.1) and (Eq.2):

Using forward or retrospective formulas has no other influence than the time reference. In both circumstances, time from Onset and Symptoms are neglected and shall be added if the Onset date aims to be plot. Cumulative figures are used to reduce the deviation and to provide the best estimator possible at the present time. Delays allow to compare figures belonging to the same date of detection, regardless of their origin. In case of consistent data, Infections, Recovered and Fatalities should add up and have a similar pattern (which can be studied with Pearson coefficient if so required), because of its intrinsic correlation:

As the country with more tests conducted per capita is statistically closer to have a CFR in the order of magnitude of the IFR, an estimated minimum number of infections for the country i is computed by the use of the equation.

A zero reference was forced on July 1st 2020 as new procedures entered and the northern hemisphere registered its minimum rate over the pandemic. The method simply adds the Counted infections to a zeroed synthetic function.
2.2 Data acquisition and processing
Consolidated data is taken from the JHU repository with the Countries’ cumulated Infected, Recovered and Fatality cases. From such and using the correction formulas and adjusted to an integer number of days, the values of τ=time to fatality (days), δ=time to discharge of recovered patients (recovery, days) and φ=case fatality rate are computed.
2.3 Statistical analysis
Preliminary filtering was done with Office 365. Heuristic adjustments were done for curve fitting. Use of discrete number of days (integer) to minimize noise was chosen over moving average windows or spline generation for interpolation. Kaplan-Meier estimators are not used as the unknown infections is likely much higher and the method does nor appropriately work with censored values above 40% [9]. To note, in Hong-Kong SARS, the estimated censored rate was of 86%.
2.4 Role of the funding source
There was no funding source for this study. The author had access to the Johns Hopkins University repository [10] on Github and had the final responsibility for submission of the article.
3. Results
181.425.785 patients positively diagnosed with COVID-19 are taken as a baseline population. The Infected curve is reconstructed from the Fatalities curve and from the Recovered (discharged) curve. Country figures display a wide range of parameter magnitudes while the fit has a good adjustment. US has a Time to Fatality of 5 days and a Time to recover of 20 days with a CFR of 4%. Contagion is still growing and more datapoints are needed to properly reconstruct the curve from recovered patients. Belgium is presented as a case with a 2020 32% Hospitalization Rate, 7 days to fatality and 6 days to recovery. By 2021, the figures changed to 25% hospitalization rate, 17 days to fatality and 22 days to recovery. Italy has a perfect match on diagnose and fatalities. Its HC system became overwhelmed by mid-April 2020 reaching its absolute minimum HR. The model shows 5 days to fatality and 10 days of hospitalization to recovery. By 2021 τ=14 days and δ=31 days to discharge. France has early detected gaps and pitfalls on its methodology and proceeded to correct and fix testing and accounting. The 7-day cycle was noticeable but credible in 2020 with an hospitalization rate of 41%, 10 days to fatality and 11 days to recovery as per may 14th. By 2021, τ=11 days and δ=12 days to discharge. Spain had by March 24th 2020 a τ=7 days and δ=11 days to discharge with a CFR of 21%. Being all three curves consistent, it replicates the European fit, with the only differences of parametrization. Spain has modified the testing, diagnose and accounting methods in several stages, which instead of matching the fatality curve as France, is forcing to match the infections curve since late April 2020. The below exposed in mid-2020 parameters include 67% HR, 3 days to fatality and 11 days to recovery. By 2021 τ=11 days and δ=12 days to discharge.
The German case is also worth an analysis as it displays a consistent inconsistency since early April 2020 when the gap between detected infections and corresponding reconstructed fatalities mismatch. The country correlated an astounding HR of 97% with 10 days to fatality and 17 days to recovery curve. By 2021, figures were unrealistic τ=29 days and probable δ=18 days with an HR of 100%. South Korea had a τ=7 days and δ=25 days with a CFR of 1%. It displays data consistency until March 11th. After the date, official infections remain below the reconstructed curve from fatalities and above the recovered reconstructed curve. To remark that data from May 14th is keeping the same inconsistency level. A note on the accounting and diagnostics could be of interest as the curves’ shape differs heavily and are potentially belonging to different causes. By 2021 τ=12 days and δ=13 days to discharge. Infections are underestimated when the system is stressed. CFR has raised to 1,9% of confirmed cases. Rest of the world has a Time to fatality of 6 days and a Time to recover of 16 days with a CFR of 7% on march 24th. The reconstructed infectious curves match the declared infections overall. By May 14th the worldwide curves display a HR of 60% (matching infections), with 7 days to fatality, 20 days to recovery and a CFR of 8,9% however with an increasing gap between infections and fatalities, potentially due to better diagnosis and a limited control over COVID-19 spread.

Figure 1: USA status as per March 27th 2020. Note the missing recovered figures.
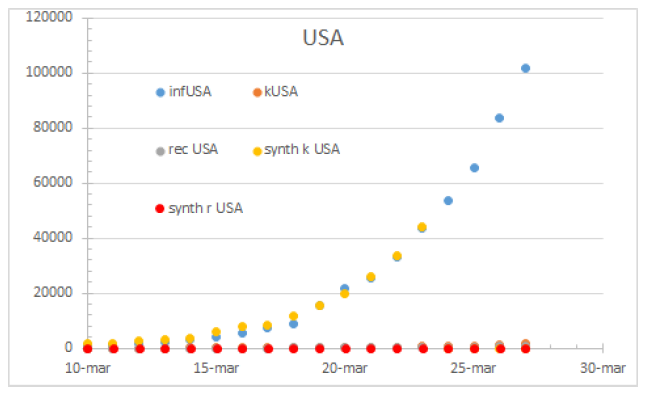
Figure 2: Status of the USA on May 14th 2020. Note the 28% hospitalization rate on April 26th.
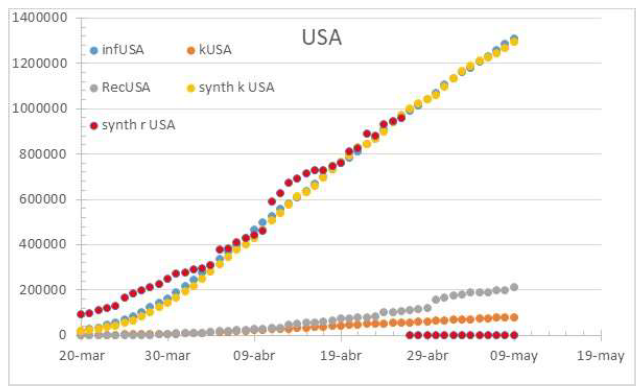
Figure 3: Status of the USA on July 1st 2021. Recovered data is missing and the fatality count has an increasing offset.
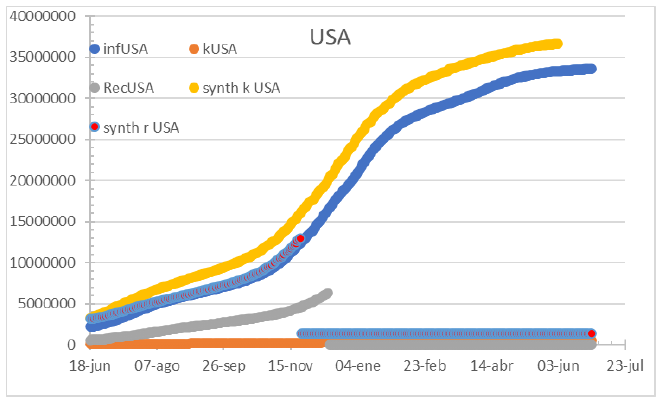
Figure 4: The Belgium case exhibits a fast path to diagnose which patients are more severely affected. May 14th 2020.
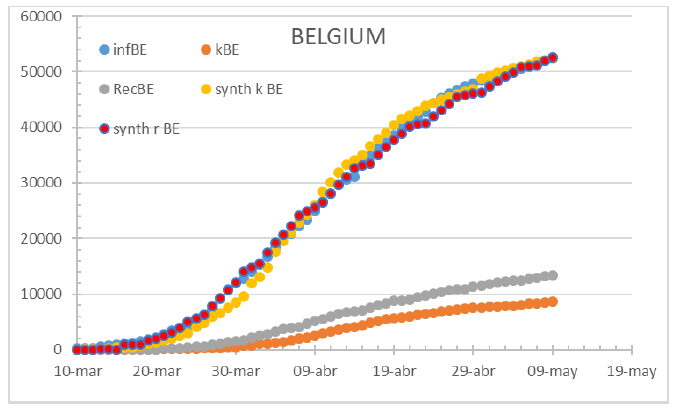
Figure 5: Status of Belgium on July 1st 2021. When focus is on care, detection fails, and indexes are underestimating.
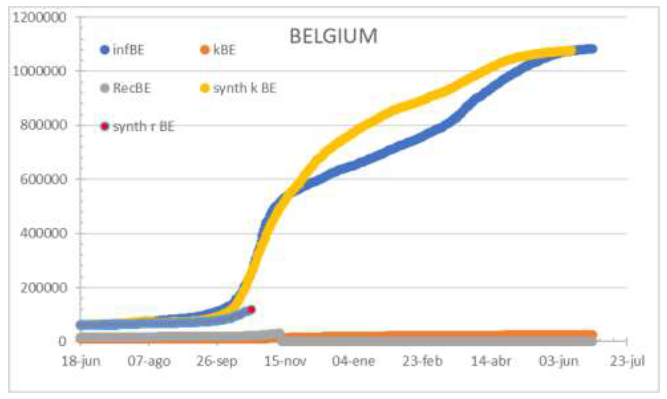
Figure 6: Italy on May 24th, 2020. To note the coverage variation along the infection, still under 70%.
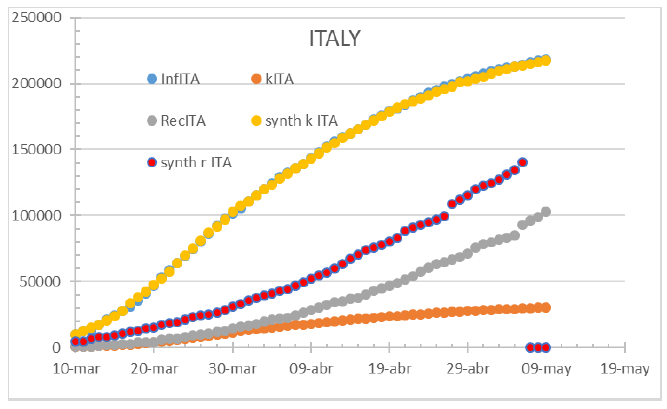
Figure 7: Italy on July 1st, 2021. HC covers 100%. Curves match.
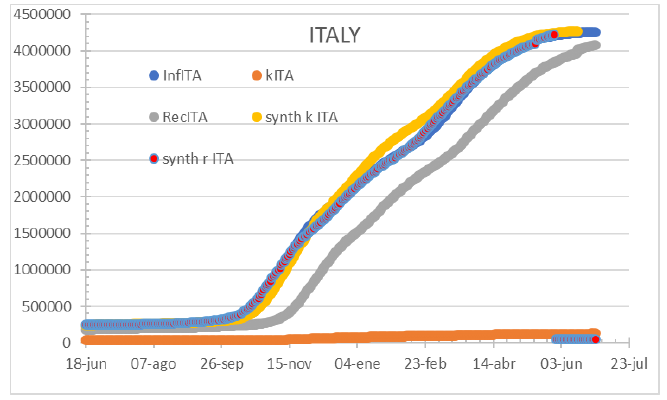
Figure 8: Status of France by May 14th, 2020.
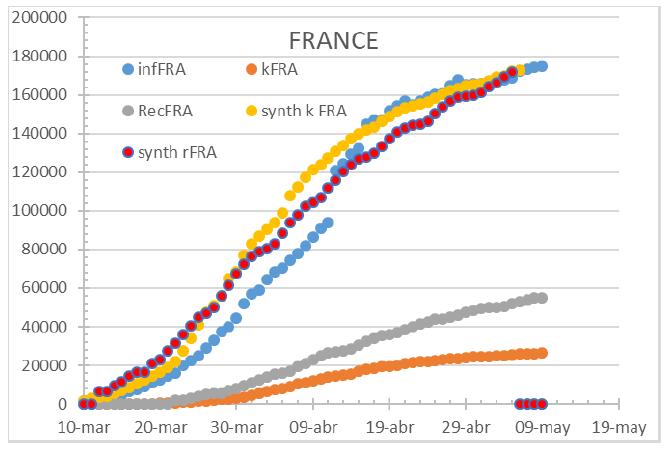
Figure 9: Status of France by July 2nd 2021. As HC services get stressed, infections are underestimated.
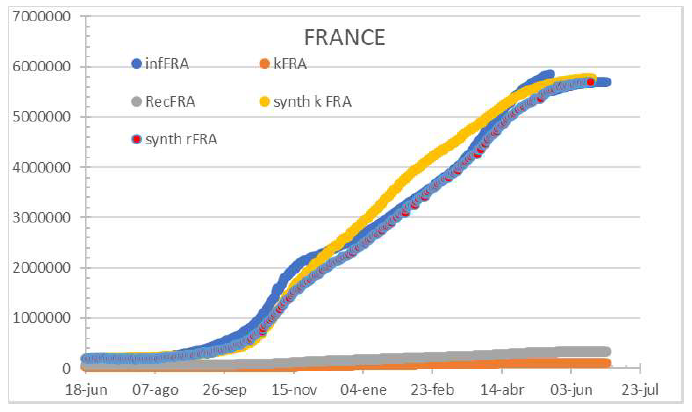
Figure 10: Spain by March 24th 2020. Unbiased information delivers overlapping curves with a 100% hospitalization rate.
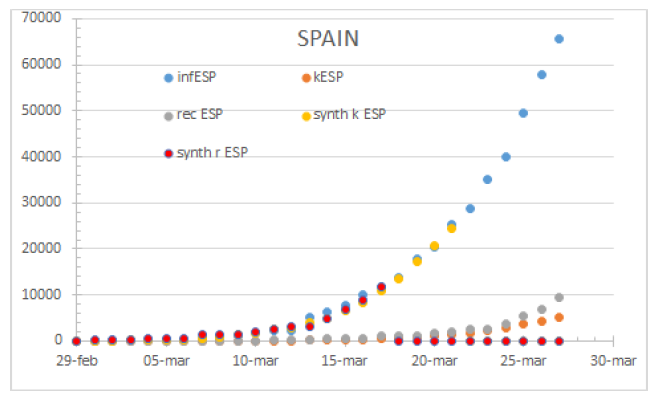
Figure 11: The updated accounting method triggers a gap between fatalities and unrealistically lowering infections.
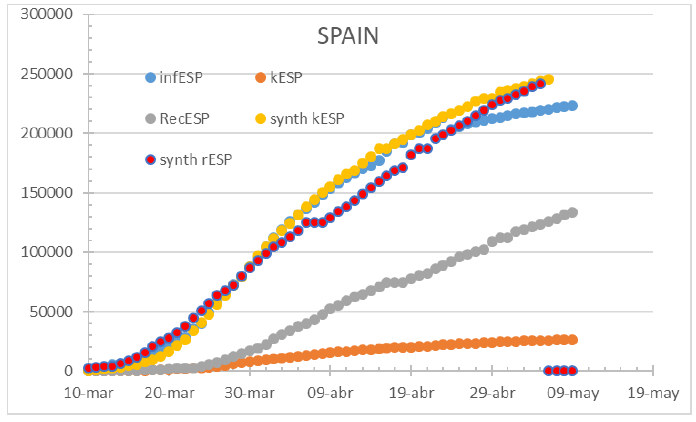
Figure 12: Spain status as July 1st 2021. Counting methodology changes generate inconsistent models increasing the gap between detected infections and confirmed deaths.
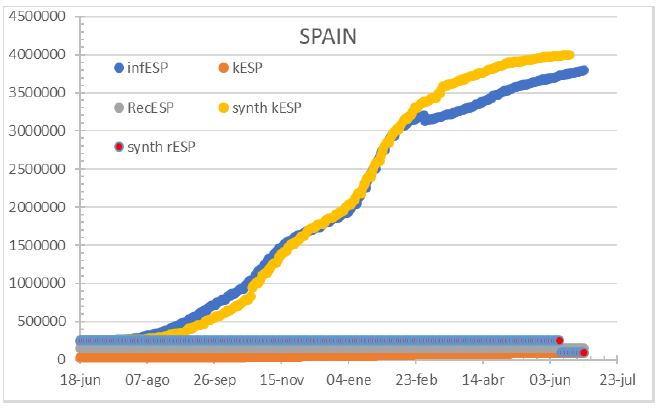
Figure 13: Germany should have around 250k infections and is reporting 70% of it as per May 14th 2020. A more detailed analysis on the methodology changes since April 5th should be required to understand the mismatch.
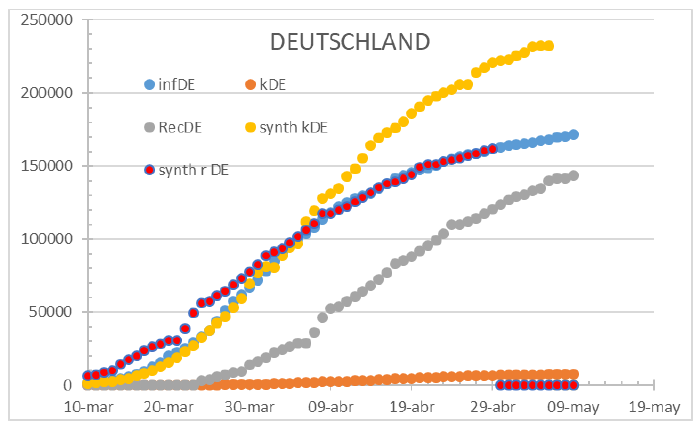
Figure 14: Germany status on July 1st 2021. Testing underestimates infections when stress is added to the system. Discharge and Confirmed infection curves perfectly overlap. Therefore, the fatalities were undetected as displayed.
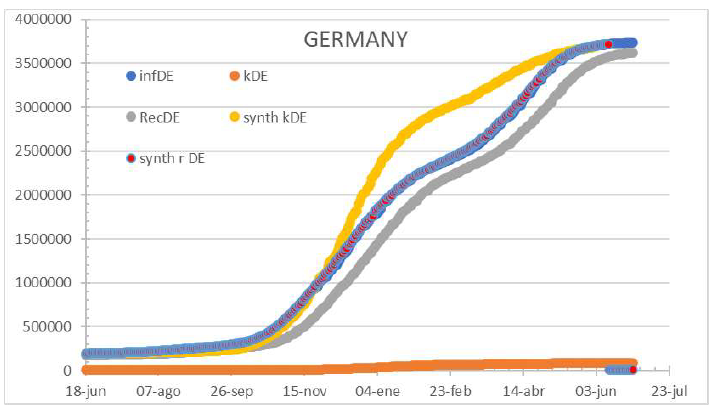
Figure 15: South Korea status by March 24th, 2020.
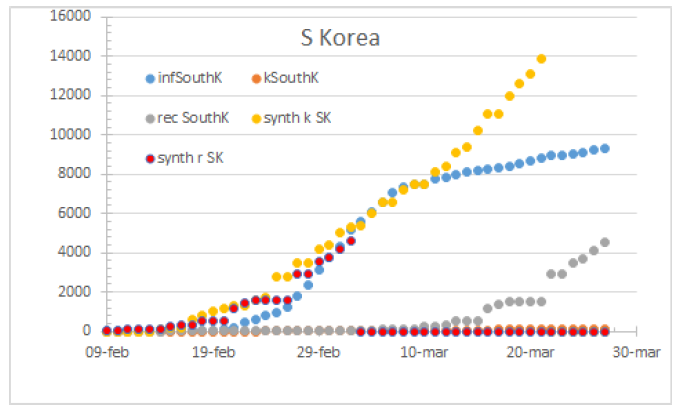
Figure 16: South Korea by May 14th. 91% HR, 4 days to fatality, 24 days to recovery.
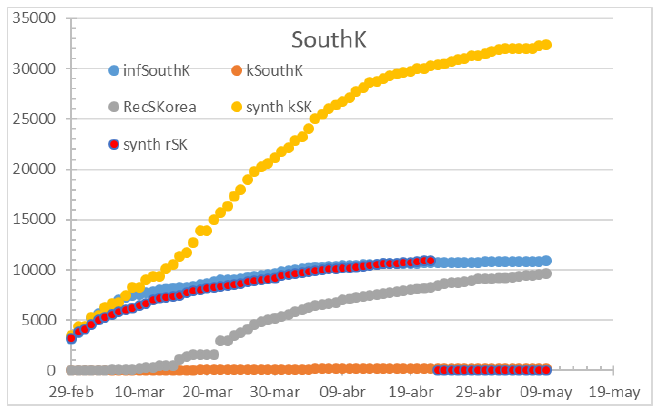
Figure 17: Status of South Korea on July 1st 2021.
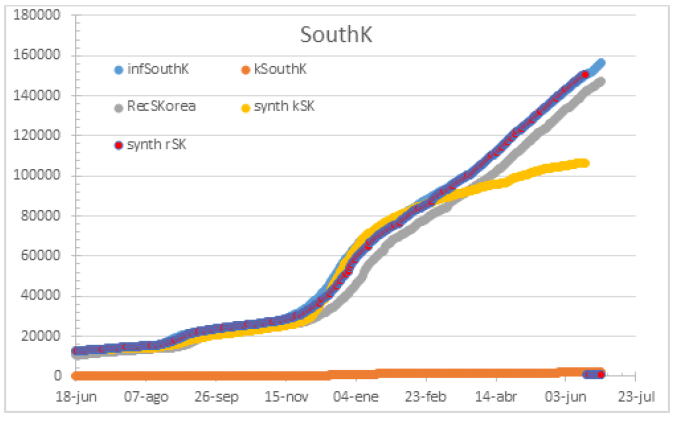
Figure 18: Rest of the world by March 24th. 100% HR.
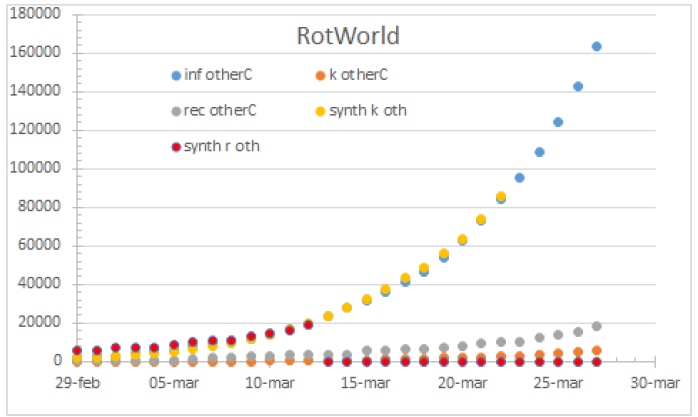
Figure 19: Worldwide status by July, 1st ,2021.
The coefficients used to build up the reconstructed curves are respectively:
|
Ttrecov δ |
CFR ? |
TtDead τ |
|
|
SKR |
25 |
1% |
7 |
|
JPN |
22 |
5% |
6 |
|
CHI |
21 |
4% |
8 |
|
USA |
20 |
4% |
5 |
|
RotWorld |
16 |
7% |
6 |
|
DE+FR+ITA |
15 |
9% |
4 |
|
ESP |
11 |
21% |
7 |
Table 1: Coefficients used on March 24th 2020.
|
Ttrecov δ |
CFR ? |
HC covera |
TtDead τ |
|
|
SKR |
24 |
1% |
0,91 |
4 |
|
World |
20 |
9% |
0,6 |
7 |
|
USA |
20 |
7% |
0,28 |
5 |
|
DEU |
17 |
3% |
0,97 |
10 |
|
FRA |
11 |
16% |
0,41 |
10 |
|
ESP |
11 |
11% |
0,67 |
3 |
|
ITA |
10 |
14% |
0,65 |
5 |
|
BE |
6 |
17% |
0,324 |
7 |
Table 2: Coefficients used on May 14th 2020.
|
Ttrecov δ |
CFR ? |
HC covera |
TtDead τ |
|
|
ITA |
31 |
2% |
100% |
14 |
|
USA |
22 |
1% |
55% |
26 |
|
BEL |
22 |
25% |
25% |
17 |
|
ESP |
19 |
1% |
100% |
12 |
|
GER |
18 |
2% |
100% |
29 |
|
SKR |
13 |
2% |
100% |
12 |
|
FRA |
12 |
1% |
5% |
11 |
|
World |
12 |
2% |
60% |
8 |
Table 3: Coefficients used on July 2nd 2021, including the forced zero on July 1st 2020 to eliminate initial bias.
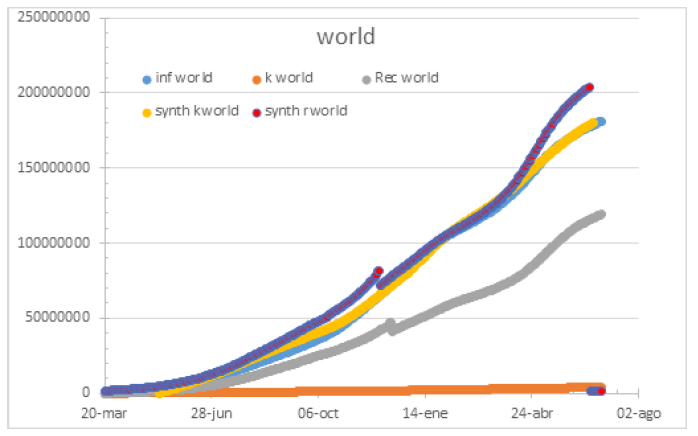
Figure 20: CFR Vs Recovery time by March 24th 2020.
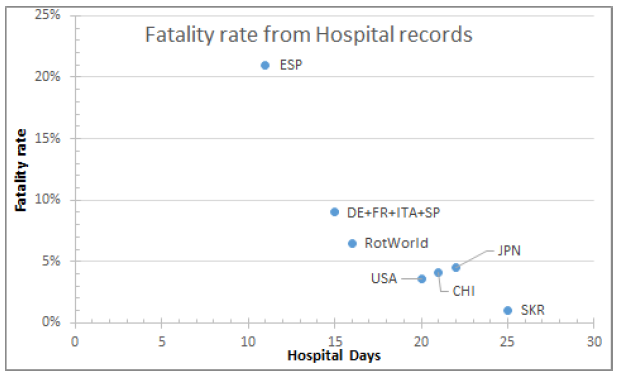
Figure 21: CFR Vs Recovery time May 14th 2020.
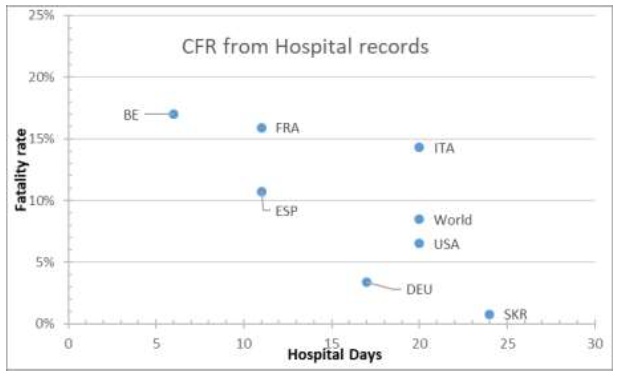
Figure 22: CFR Vs Recovery time by July 1st 2021.
The figures represent Time to Recovery as the time lapse from hospital admission of positive cases to hospital discharge and the Time to Fatality is the time lapse between hospital admission of positive cases to fatality record, and plotting the fatality rate against the variable Time to Recovery, the figure is generated. Figures display that the fatality rate is negatively correlated as the hospitalization period is longer. Once a stabilization period is set, CFR converge to a rate of 1,8% of detected infections. Different procedures may set the divergence on hospitalization time. In Spain, the annual mortality anomaly is of 42.021, having a 94% of data coverage, leading to 45.000 anomalous fatalities in the period 28/06/2020-27/06/2021. The official fatality figure in reported and confirmed cases counts to 52.436 casualties.
4. Discussion
Data provided from official sources is consistent both in Europe and the US reporting on COVID-19. The information quality is better when HC is not under heavy stress. Then, infections are underestimated, and the pandemic spread is bigger than the data shows. This indicates the suitability of data for the pandemic parametrization on initial data analysis, but not in the middle of a wave. The gap between declared and real infections can be represented as initial diagnostics were lagging the disease and once procedures were in place, the time to detection was increased, giving additional control over the situation. The South Korean case displays a severe dissonance in the COVID-19 early stages. While the fatalities curve shows a controlled-infection pattern (constant fatality rate) the declared infection points to a controlled stagnation pattern. Also, the underestimated recovery rate means that some COVID-19 positive patients were never discharged from the hospital, which is unlikely to happen.
The average τ=12 days and δ=13 remain in line with the published clinical course for COVID-19 and makes it consistent with ICU data, stressing the relevance of monitoring the patients’ 2 weeks after detection. Plotting hospital days (stay) Vs CFR shows how the overall HC system is overwhelmed. At the pandemic first strike, Spanish lethality was tenfold beyond countries as Japan in 2020. Actually, what can be appreciated in the figures is that countries with completely saturated or unprepared healthcare system do experience a much higher mortality, potentially explained because overwhelmed Healthcare services are prone to decrease its patient stay and filter its admissions, focusing on the most critical ones, which on its turn are more likely to die. Patients are discharged faster and CFR is increased. Therefore, correlation between CFR and the time to recovery is not causal but explicative. Such an indicator can work for COVID-19 to measure efficiency on detections and national healthcare system overload. Roughly, the overall trend is to increase CFR by 1 point as the stay is shortened by 1 day. This estimator can be used to compute the effective number of hospital beds required to face a given pandemic infection or to determine the HC system capacity provided a fixed number of stations (beds).
Therefore, the fatality rate against the hospital days curve is displaying the overwhelming of a healthcare system and it is not true to the real CFR of the COVID-19 unless close to the X-axis. The following lines of the study will focus on the data and the parameter adjustment. The presented methodology for a first quality assessment demonstrates when data can be fed straightforward to a model in order to compute the epidemiological parameters and when the data requires preprocessing before feeding any realistic model or if the data is not even suitable for, as the South Korea and German cases. Hence, anomalies as detected indicate that an evolved method to correct the baseline data must be applied to match consistently and understandably the curves with the reconstructions of such.
So far, CFR has to be considered a bad estimator for IFR (infection fatality rate) as the data is incomplete in many cases and the preclinical cases are unknown. The singularity of Spain, counting more fatalities by confirmed cases than the anomalous mortality for the overall population points to this fact. However, the ratio from highest to lowest CFR can be a potential estimator on the real Infectivity where testing was not being conducted extensively Vs a full-population testing, providing a figure for total infected people at a given date, which can be contrasted with other methodologies.
Contributors
OGR has developed and implemented the algorithms and made the data analysis and included corrections to feed the epidemiological models. A special mention to the effort of the JHU staff for gathering and curating the datasets on GitHub.
Declaration of Interests
The author declares no competing interests.
Acknowledgments
I have to thank all colleagues who helped me during the current study and the ones which proposed improvements and future research paths. I am also grateful to the many front-line medical staff who provided first-hand information and also for their outstanding and continuous dedication well before and beyond this outbreak.
Funding
No specific funding is raised.
References
- Gallemi Rovira O. Scrutinising the COVID-19 data on 590.000 cases. A retrospective, population-based descriptive study for data quality surveillance and a review at 4.540.000 cases. medRxiv (2020).
- Secretaria de Estado de Sanidad. Actualización no 410. Enfermedad por el coronavirus (COVID-19). Cent Coord Alertas y Emergencias Sanit (2021): 1-2.
- Statement on the second meeting of the international health regulations emergency committee (2020).
- WHO DG’s opening remarks at the media briefing on COVID-19 (2020).
- Young BE, Ong SWX, Kalimuddin S, et al. Epidemiologic Features and Clinical Course of Patients Infected With SARS-CoV-2 in Singapore. JAMA (2020).
- Zhou F, Yu T, Du R, et al. Clinical course and risk factors for mortality of adult inpatients with COVID-19 in Wuhan, China: a retrospective cohort study. Lancet 395 (2020): 1054-1062.
- Yang X, Yu Y, Xu J, et al. Clinical course and outcomes of critically ill patients with SARS-CoV-2 pneumonia in Wuhan, China: a single-centered, retrospective, observational study. Lancet Respir Med (2020).
- Verity R, Okell LC, Dorigatti I, et al. Estimates of the severity of COVID-19 disease. medRxiv (2020).
- Ghani AC, Donnelly CA, Cox DR, et al. Methods for Estimating the Case Fatality Ratio for a Novel, Emerging Infectious Disease. Am J Epidemiol 162 (5): 479-486.
- Dong E, Du H, Gardner L. An interactive web-based dashboard to track COVID-19 in real time. Lancet Infect Dis (2020).
