Prevalence and Risk Factors of Diabetes Mellitus Among the Inhabitants of Kumasi Metropolis
Article Information
Agbogli H. K, Annan R, Agyeman-Duah E*, Mak-Mensah E. E
Department of Biochemistry and Biotechnology, College of Science, Kwame Nkrumah University of Science and Technology, Kumasi-Ghana.
*Corresponding Author: Agyeman-Duah E, Department of Biochemistry and Biotechnology, College of Science, Kwame Nkrumah University of Science and Technology, Kumasi-Ghana
Received: 10 May 2017; Accepted: 10 August 2017; Published: 17 August 2017
View / Download Pdf Share at FacebookAbstract
In Ghana, there is an increasing prevalence of diabetes mellitus (DM) in the adult population, which stood at 3.35% by the end of 2013. About 8000 deaths were reported from diabetes in 2013. Changing dietary patterns and lifestyles are associated with the upsurge of DM and in Kumasi the prevalence is 9%. This work sought to determine DM prevalence and associated risk factors among adults in the Kumasi metropolis. The study involved 113 adults from the Oforikrom sub metro. Body Mass Index (BMI) were calculated from weight and height. Venous blood samples were collected for the determination of fasting blood glucose (FBG) using a spectrophotometer. Systolic and diastolic pressures were determined and socio-demographic data were collected using questionnaires. Mean age of participants was 41.8±1.3 years (females=44.9 and males=34.6, p<0.001), mean BMI was 27.3±0.6 kg/m2 (females=29.4 versus males=22.5 kg/m2, p<0.001) and mean FBG was 4.93±0.1 mmol/L (females= 4.97 versus males=4.84, p=0.55). Prevalence of hypoglycemia was 11.5%, normoglycaemia 74.3%, prediabetes 10.7% and diabetes was 3.5%. Close to 35% and 27% were obese and overweight respectively. More females were overweight or obese (82.3%) than the males (15%), p<0.001. Binary regression analysis showed gender as the only significant predictor of high FBG, with females having a 2.76 (95% CI 0.6, 12.7) increased odds of having high FBG compared to males. BMI, age, exercise, family history and diet were not significant predictors of FBG. In this population there was 3.5% observed prevalence of DM, similar to national prevalence, high prevalence of overweight and obesity, associated with female gender.
Keywords
Diabetes Mellitus; Body Mass Index; Blood Glucose; Blood Pressure; Obesity
Article Details
Introduction
Diabetes mellitus is a metabolic disorder characterized by chronic hyperglycemia and disturbances of carbohydrate, fat and protein metabolism resulting from defects in insulin secretion, insulin action, or both [1]. In Ghana, diabetes and hepatitis is a major health challenge [2]. Diabetes is reported in over 354,000 adults, aged 20-79 in 2012 and 6,973 deaths were recorded as a result. It is further estimated that over 292,450 people have undiagnosed diabetes. The cost per person for healthcare with respect to diabetes was estimated at 141.76 USD [3].
A three year study by Danquah et al. [4] indicated that 6% of the people in Kumasi have type II DM. This study reveals advanced age, obesity, family history of DM, smoking and alcohol, lack of physical activity, poor nutrition during pregnancy, ethnicity and low income levels as the factors responsible for the disease. Studies revealed glucose abnormalities in people who smoke. It was concluded that smoking is a modified risk of type II diabetes [5]. The effects of diabetes is a long term development of retinopathy, nephropathy and neuropathy and an increased risk of cardiac, peripheral arterial and cerebrovascular diseases [3]. Diabetes increases the risk of death among individuals and is the sixth leading cause of death in the US in the year 2000. Adults with diabetes are prone to death or stroke. Other complications relating to diabetes include high blood pressure, amputations and complications in pregnancy [6]. The aim of this study is to determine the prevalence and study the risk factors for type II diabetes mellitus among inhabitants in some selected suburbs of Kumasi.
Methodology
This study was a cross-sectional study conducted on adults living in Oforikrom Sub Metro (Kumasi-Ghana). A total of 113 participants were recruited for the study area. The participants of the study were selected randomly from the two communities (Susuanso and Oforikrom).
Participants recruited for present study excluded tertiary students living (temporal) in the locality as well as those below 18 years. Pregnant women and visibly sick/ill people were also excluded from the present study.
A sample size of 151 participants, which represented 0.5% of the total population was determined at a confidence level of 95% with an error margin of 7.98%. This was calculated using the Complete Survey Software Solution created by Creative Research Systems (2012). The sample population was chosen based on random selection of houses at the two communities. The participants were tested for fasting blood sugar at very hours of the day (before sunrise). Venous blood samples were collected after 8 to 12 hours of overnight fast for the determination of fasting
blood glucose using a spectrophotometer. Body weight and height were determined, and BMIs calculated. Systolic and diastolic pressures were determined and socio-demographic data were collected using questionnaires. Questionnaires centered on socioeconomic details, dietary management, lifestyles, health history, disease awareness and family history of diabetes mellitus.
The results obtained were analyzed using the SPSS software, version 16.0. T-tests, tests for correlation, regression analysis and crosstab analyses were used to compare the various parameters and relationships. The p-values obtained are used to test for the significance of the results.
Results
The total number of participants recruited in this study was 113 and the demographics are represented in Table 1. Out of the 113 subjects, 79 (69.9%) were females and 34 (30.1%) are males. The mean age of the study participants was 42 (±1.28) years with a significant age difference between the males and the females (Table 2). All participants for this study were non-smokers, 74 (65.5%) participants exercise either frequently, 1 time/week, 2-4 times/week or monthly while 38(33.6%) participants were not. Only 5 (4.4%) participants take alcohol, whether monthly or frequently while 108 (95.6%) do not take alcohol. Eleven (9.7%) participants answered no to maintaining healthy body weight, 66 (58.4%) participants answered yes to maintaining healthy body weight whilst 36 (31.9%) participants had no idea whether they were maintaining a healthy body weight or not (Table 2).
|
Variables |
Frequency (N) |
Percentages (%) |
|
|
SEX |
Male Female |
34 |
30.1 |
|
Age group |
18-34 |
37 |
32.7 |
|
35-54 |
57 |
50.5 |
|
|
?55 |
19 |
16.8 |
|
|
Occupation |
Manual |
54 |
47.8 |
|
Sedentary /manual |
19 |
16.8 |
|
|
Unemployed |
7 |
6.2 |
|
|
Level of Education |
Basic |
61 |
54 |
|
No education |
19 |
16.8 |
|
|
Tertiary |
9 |
8 |
|
|
Family history of diabetes |
NO YES |
71 |
62.8 |
Table 1: Demographic and lifestyle characteristic of study subjects
Table 1 indicates the various age groups of the study population. Of the 113 people studied, 23.0% are in the age group 18-30 years, 36.3% in 31-45 years, 31.9% lie in the 46-60 years group and the rest of the 8.8% are above the age 60 years.
From Table 2, it shows that the mean age of the female is statistically higher than that of the male, also the DBP of females is statistically higher than that of males and it shows there is a significant difference between the mean of DBP of females and males. There was no significant difference in the mean of SBP, alcohol, and exercise for both males and females. However, there mean BMI was significantly higher in females than in males (p<0.05).
|
Variable |
Male |
Female |
Total |
p-value |
|
AGE (YEARS) LIFESTYLE BP (mmHg) BMI(kg/m) FBS (mmol/L) (%) |
18-77
24 (70.6)
67.06 (2.2)
1(2.9)
4(11.8) |
18-77
50 (63.2)
75.13 (1.4)
1(1.3)
9(11.4) |
18-80
74 (65.5)
72.70(1.2)
2(1.8)
13(11.5) |
0.000
0.329
0.002
0.000 |
Table 2: Demographics of Age, Lifestyle, Blood Pressure, Mass Index and Blood Sugar among Male and Female Participants
DBP = Diastolic Blood Pressure; SBP = Systolic Blood Pressure; BMI = Body Mass Index; SEM = Standard Error of Mean; FBS = Fasting Blood Sugar
From Table 2, the prevalence of obesity is at 27.4%, which are all females with no male being obese (0.0%), overweight was at 35.4% of which male accounted for 15% and females 85%. Of the 35.4% with healthy weight, males constitute 67.5% whiles females accounted for 32.5% and 1.8% were underweight and this was equally shared by males and females. This indicated that of the female population, 39.2% are obese, 41.8% overweight, 17.7% normal weight and 1.3% underweight. None of the males are obese, 17.6% overweight, 79.4% normal weight and 2.9% underweight.
Of the total study population, 4 are diabetic representing 3.5% and of these, 2 are males and 2 females. The pre- diabetes is 10.7% and of these 5 (41.7%) were male and 8 (58.3%) females and with the hypoglycemic group, there were 6 (46.2%) and 7 (53.8%) for males and females respectively. This accounts for 11.5% of the study population. The rest of the population has normal blood glucose and this represented 74.3% of which females constitute 71.4% and males 28.6%. This shows that of the male population, 11.8% are hypoglycemic, 70.5% normoglycaemic, 11.8%
pre-diabetic and 5.9% diabetic. The females also revealed that 2.5% diabetic, 10.1% pre-diabetic, 76% have normal blood glucose and 11.4% are hypoglycemic (Table 2).
The age of the study was done in the age group 18-80 years with the mean age being 41.5±1.4 years for the non- diabetic group and 43.4±3.0 for the hyperglycemic group. The mean BMI obtained were 27.4±0.6 and 26.9±1.2 for the non-diabetic and hyperglycemic respectively. The mean FBS are 4.6 (SEM=0.05) for the non-diabetics and 7.1 (SEM=0.53) for the hyperglycemic (Table 3).
|
VARIABLES |
NON-DIABETIC (n=97) |
HYPERGLYCAEMIC (n=16) |
|
AGE(years) |
18.0-80.0 |
24.0-66.0 |
|
Range |
||
|
Mean (SEM) |
41.5(1.39) |
43.4(3.04) |
|
BMI(kg/m2) |
18.04-51.11 |
19.4-38.6 |
|
Range |
||
|
Mean (SEM) |
27.4(0.62) |
26.9(1.19) |
|
FBS(mmol/L) |
3.14-5.53 |
5.6-13.1 |
|
Range |
||
|
Mean (SEM) |
4.6 (0.05) |
7.1(0.53) |
Table 3: Mean FBS, BMI and Age Demographics of Diabetics and Non-diabetic participants
The participants who engaged in physical activity of some sort was 62.8% and 84.5% of this has normal blood sugar whiles 15.5% has abnormal blood sugar. 37.2% of the study population have a family history of the disease of which 21.4% have abnormal levels of blood glucose and 78.6% have normal blood glucose. Only 5.3% have taken alcohol and out of these, 83.3% had normal sugar levels and 16.7% abnormal sugar levels (Table 4). In this the abnormal blood sugar levels are those with FBG of at 5.6mmol/L based on the classification by the American Diabetes Association [7].
|
FBS |
Physical activity |
Family History |
Alcohol |
|||
|
YES (%) |
NO (%) |
YES |
NO |
YES |
NO |
|
|
Normal Abnormal Total |
60(84.5) 30(85.7) |
33(78.6) 63(88.7) |
5(83.3) 92(86) |
|||
Table 4: Risk factors and FBS distribution
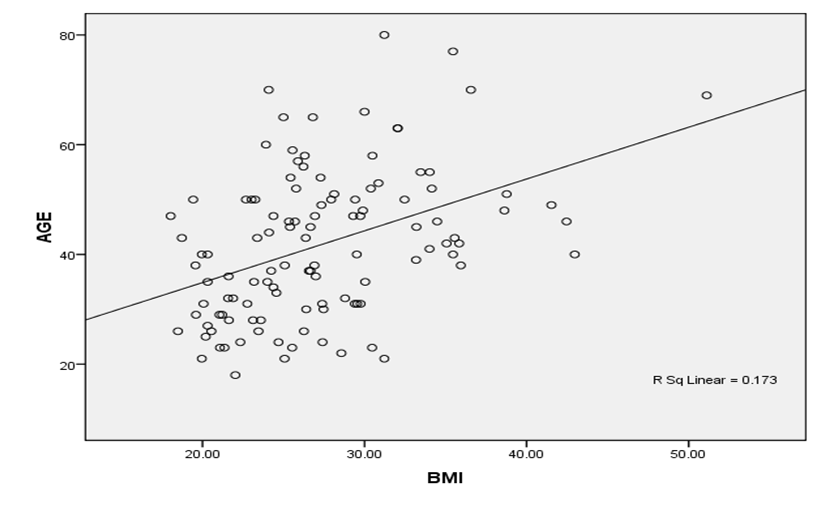
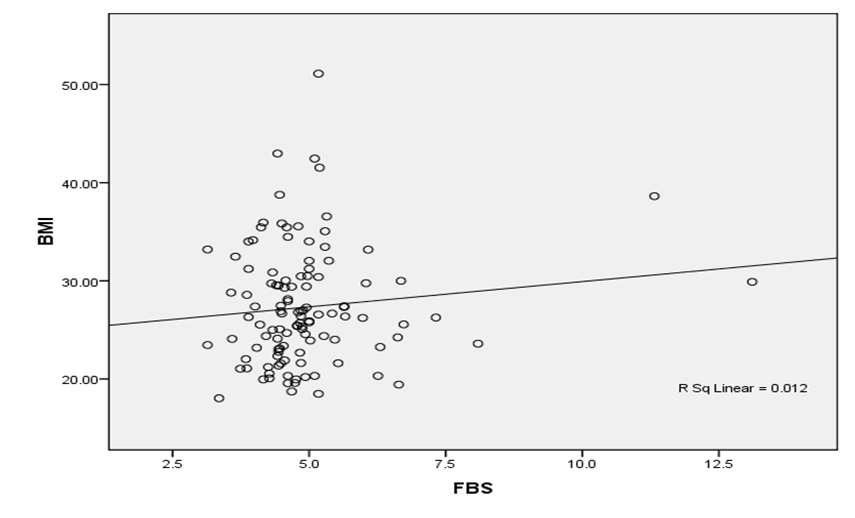
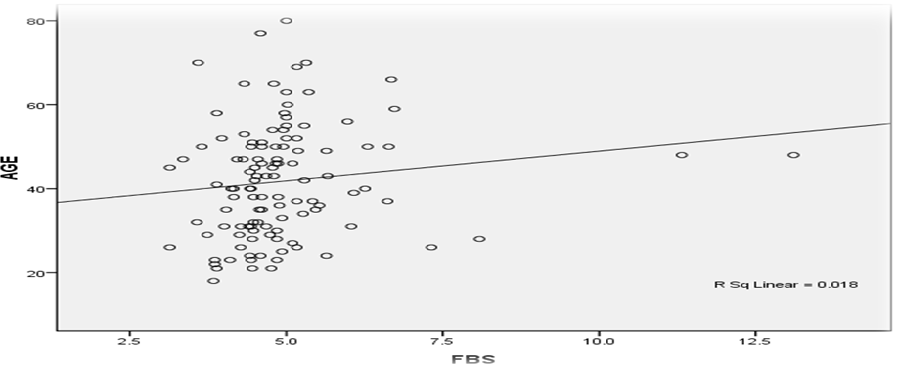
Figure 1 shows that there is a weak direct correlation between age and BMI, Age and FBS, and BMI and FBS. These associations are weak as the correlation coefficients are less than 0.5 (Spearman’s r =0.417) as seen in Figures 1, 2 and 3. The r square value obtained was also less than 0.5.

Figure 1: Correlation between Age and BMI

Figure 2: Correlation between BMI and FBS

Figure 3: Correlation between Age and FBS

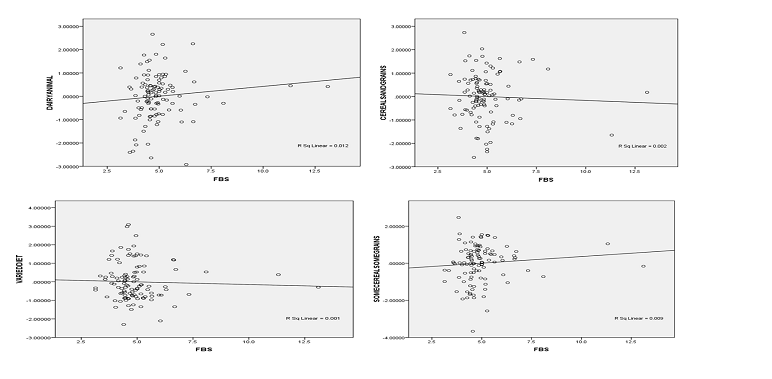
Figure 4: Correlation between various dietary patterns and FBS
Figure 4 shows no relation between the diets of the participants and the blood glucose. The R square linear values for the various dietary patterns were all below 0.5. The various R square values are varied diet (0.001), cereal and grains (0.002), diary animal (0.012) and some cereals and some grains (0,009). The r square linear values obtained for the various food diets were much smaller than the standard figure of 0.5, which indicate the degree of linearity.
Discussion
The study revealed a prevalence of 3.5% for diabetes mellitus and 10.7%% of pre-diabetes. The prevalence of 3.5% of diabetes compares well with the national figure for Ghana of 3.35% by the International Diabetes Federation (IDF) in the year 2012 [3]. This figure was concluded based on the World Health Organization’s and IDF’s definition of fasting blood glucose of 7.0mmol/L and above as being diabetic. This prevalence cannot be associated with the risk factors of physical activity, aging, gender, obesity, dietary patterns and family history. This is because of the weak association between these factors and the fasting blood glucose results.
It is estimated that the prevalence of diabetes mellitus is similar in women and men [8]. This study showed that the prevalence of the diseases in males and females is the same. Increasing age is associated with the prevalence of diabetes mellitus for both males and females [9]. This study shows that diabetes prevalence is the same for both
genders and it is inconsistent with other studies which indicated that more women are prone to the disease than males [8, 9].
The prevalence of pre-diabetes is a major concern for public health policy [1]. It is diagnosed when there is hyperglycemia which is not sufficient to be classified as diabetes. It is categorized as Impaired Fasting Glucose (IFG) or Impaired Glucose Tolerance (IGT) and it is diagnosed as fasting blood glucose between 5.6 and 6.9 mmol/L [7]. The pre-diabetic condition is a risk factor for the development of diabetes and other cardiovascular diseases [10].
People with pre-diabetes are at 50% risk of developing type II diabetes mellitus within a 10 year period [11]. The high prevalence of obesity and overweight in the study participants put them at high risk of developing type II diabetes and this group forms an important target for interventions geared towards reducing the development of diabetes mellitus. Of the pre-diabetes prevalence of 10.7%, 58.3% are females and considering the high levels of obesity and overweight in the female population, it can be stated that the females are more prone to developing type II diabetes as compared to their male counterparts. This is because, obesity/overweight has been observed to be noted before a rise in diabetes and other cardiovascular diseases [12].
The increasing trend in modernization has its own benefits and demerits. From the results obtained, it is evident that a sedentary lifestyle is associated with obesity and the development of diabetes [4]. The most useful way of expressing obesity is the body mass index (BMI). The index is the body weight divided by the square of the height in meters (weight/ (height)2). A BMI between 18.5 and 24.99 is considered a healthy weight and this is associated with lower risk of developing type II diabetes [13]. BMI of at least 30kg/m2 is defined as obesity and it is implicated in the development of diabetes and increased mortality [13, 14). For a BMI range of 35-50 kg/m2, the relative risks range from 2 to 8 for the development of type II DM and this contrasts with the low risk of people with healthy body weight [13].
There is an increasing sedentary lifestyle and obesity in most parts of Ghana especially in the urban settings [15]. In this study, the mean BMI for males and females are 22.5±0.4 and 29.4± 0.65 (p=0.00) respectively. The BMI is also dependent on the age of the participants. This was revealed with the positive correlation between age and BMI (p=0.002). This shows that the mean for females is significantly higher than that of the males. There is a high level of overweight in the study population as indicated by the prevalence of 34.5% and the prevalence of obesity is at 27.4%. This shows that more than half of the study population are abnormally heavy. The females are found to be overweight and obese than their male counterparts. This compared with similar findings reported in other studies [16].
The increased prevalence of obesity has been observed to be noted before a rise in the occurrence of diabetes, hypertension and other non-communicable diseases. The most notable risk of developing type II diabetes mellitus is
obesity and the risk attributed to obesity is as a much as 75% [17, 18]. This then shows that a higher percentage of the female study participants are prone to developing type II diabetes mellitus if measures are not put in place to reduce it.
A study by Perry et al. [12] revealed that BMI is not associated with FBG. Other studies, however revealed increase association of obesity and overweight with the development of diabetes mellitus [4]. This study on the contrary, showed a weak association of obesity and overweight with the Fasting blood glucose results (p=0.12).
The study revealed that 64.6% of the people are involved in some form of exercise and 35.4% had no form of exercise. Out of the group involved in physical activity, 15.1% had abnormal levels of fasting blood glucose and 12.5% of the non-physically active have abnormal blood glucose. However, physical activity has no bearing on the fasting blood 35 glucose (p=0.94) and this contrasts studies that show that engaging in some physical activity reduces the risk of developing diabetes mellitus [19]. It must be noted that developing the disease does not only depend on lack of physical activity.
In most studies relating the physical activities, roles in reducing diabetes, it was observed that the level of blood glucose reduces as people engaged in some of exercise regime [20, 21]. These studies were on people with the disease already and physical activity was used as a form of intervention to reduce the risk of developing the type II diabetes mellitus. It can be seen that physical activity alone does not prevent the development of the disease, but other factors play major roles.
For the people with pre-diabetes and diabetes, engaging in some sort of physical activity would help reduce the risk of developing type II diabetes. Involving in more physical engagements would help them improve on the sensitivity of the tissues to insulin action. This is linked to the regulation of body weight, decreased adiposity, glucose tolerance and fibrinolytic and endothelial function [20].
In order to associate the effect of the various dietary patterns on fasting blood glucose, a partial correlation test was done using the various diets of the study participants. The outcome showed that there is a positive association between the various diet patterns. But the association is statistically insignificant. This is because the various p- values obtained were greater than 0.05. A further analysis of the various diets and the fasting blood glucose was carried out. The outcome revealed that there is a weak correlation between the blood sugar and diets of the people. However, the relation is statistically insignificant as the correlation coefficient, r, was less than the 0.5. This indicated that the effect of diet was not pronounced. In contrast, literature indicated that the diet of people has a bearing on the fasting blood glucose. Studies by Salmerón et al. [22] and Montonen et al. [23] showed that consumption of foods rich in red meat, dairy products and high glycemic index is an independent risk of developing type II diabetes mellitus. The same studies also revealed consuming foods rich in fruits, vegetables and high cereal fibers are able to reduce the risk of developing type II diabetes mellitus [23].
The current study shows the association, but it is a weak relation. It could be due to the sample population being low, therefore not much data was available. It could also be that most of the foods consumed are cereal and grain based, thereby provide enough fiber for the consumer. High fiber from cereals and grains help reduce the demand for insulin after meal and increases the sensitivity of the target cells and tissues to insulin action [23].
Conclusion
It is concluded from the study that the prevalence of diabetes stands at 3.5% and pre-diabetes is at 10.7%. The study revealed that diabetes and pre-diabetes are not associated with age, gender and BMI. The prevalence is weakly associated with lack of physical activity, diet and family history of diabetes mellitus as well. The prevalence of obesity was found to be 27.4% and overweight was at 34.3%. This indicated that over half of the population are obese and overweight.
Acknowledgement
The authors would like to acknowledge the staff of the Clinical Analysis Laboratory of the Department of Biochemistry and Biotechnology, KNUST for their assistance in this project.
Conflict of Interest
The authors declare no conflict of interest
References
- World Health Organization. Use of glycated haemoglobin (HbA1c) in the diagnosis of diabetes mellitus.
- Duah AA, Nsiah K, Agyeman-Duah E. Using Various Serological Markers to Characterize Hepatitis B-Infected Patients Who Visit Clinical Analysis Laboratory, KNUST. Archives of Microbiology & Immunology 1 (2017): 50-57.
- International Diabetes Federation. IDF Diabetes Atlas, 5th ed. International Diabetes Federation. (2012): 10-16.
- Danquah I, Bedu-Addo G, Terpe KJ, et al. Diabetes mellitus type 2 in urban Ghana: characteristics and associated factors. BMC Public Health 12 (2012): 210.
- Willi C, Bodenmann P, et al. Active smoking and the risk of type 2 diabetes. JAMA: the journal of the American Medical Association 298 (2007): 2654-2664
- Urrutia?Rojas X. Menchaca J. Prevalence of risk for type 2 diabetes in school children. Journal of school health 76 (2006): 189-194.
- American Diabetes Association. Standards of Medical care in Diabetes, Diabetes Care, 27 (2004): Suppl. 515.
- Wild S, Roglic G, et al. Global prevalence of diabetes. Estimates for the year 2000 and projections for 2030.
- King H, Aubert RE, Herman WH. Global burden of diabetes, 1995-2025: prevalence, numerical estimates, and projections. Diabetes Care 21 (1998): 1414-1431.
- American Diabetes Association. Diagnosis and Classification of Diabetes Mellitus. Diabetes Care 35 (2008): 64-71.
- Nichols GA, Hillier TA. Brown JB. Progression from newly acquired IFG to type 2 diabetes mellitus. Diabetes Care 30 (2007): 228-233
- Perry, John RB, et al. Stratifying type 2 diabetes cases by BMI identifies genetic risk variants in LAMA1 and enrichment for risk variants in lean compared to obese cases. PLoS genetics 8 (2012): e1002741.
- Astrup A. Finer N. Redefining type 2 diabetes:‘diabesity’ or ‘obesity dependent diabetes mellitus’? Obesity Reviews 1 (2000): 57-59.
- Edelstein SL, Knowler WC, Brain RP, et al. Predictors of progression from impaired glucose tolerance to NIDDM: an analysis of six prospective studies. Diabetes 46 (1997): 701-710.
- Liu S, Manson JE. Dietary carbohydrates, physical inactivity, obesity, and the ‘metabolic syndrome’as predictors of coronary heart disease. Current opinion in lipidology 12 (2001): 395-404.
- Owiredu WKBA, Adamu MS, Amidu N, et al. Obesity and Cardiovascular Risk Factors in a Pentecostal Population in Kumasi-Ghana. Journal of Medical Sciences 8 (2008): 682-690.
- Amoah AG, Owusu SK, Schuster DP, Osei K. Pathogenic mechanism of type 2 diabetes in Ghanaians?the importance of beta cell secretion, insulin sensitivity and glucose effectiveness. South African Medical Journal 92 (2002): 377-384.
- Edelstein SL, Knowler WC, et al. Predictors of progression from impaired glucose tolerance to NIDDM: an analysis of six prospective studies. Diabetes 46 (1997): 701-710.
- Manson JE, Spelsberg A. Primary prevention of non-insulin- dependent diabetes mellitus. Am J Prev Med 10 (1994): 172-184.
- Pan XR., Li GW, Hu YH, et al. Effects of diet and exercise in preventing NIDDM 42 in people with impaired glucose tolerance: the Da Qing IGT and Diabetes Study. Diabetes care 20 (1997): 537-544.
- Bassuk SS, Manson JE. Epidemiological evidence for the role of physical activity in reducing risk of type 2 diabetes and cardiovascular disease. Journal of Applied Physiology 99 (2005): 1193-1204.
- Salmerón J, Ascherio A, et al. Dietary fiber, glycemic load, and risk of NIDDM in men. Diabetes care 20 (1997): 545-550.
- Montonen J, Knekt P, Härkänen T, et al. Dietary patterns and the incidence of type 2 diabetes. American Journal of Epidemiology 161 (2005): 219-227.
