Mutation Characteristics of the MYC Proximal Network and its Implications for Immunotherapy in Human Cancer
Article Information
Shuwei Ren†, 1, Yuanmei Zhang†, 2, Yan Ouyang†, 1, Chi Zhang3, Yi Su1, Xiaona Shi1, Yanhong Xiao*, 1, Yongsheng Huang*, 4
1Department of Clinical Laboratory, The Sixth Affiliated Hospital, Sun Yat-sen University, Guangzhou, Guangdong 510655, China.
2Department of Blood Transfusion, Shanghai Tenth People’s Hospital, School of Medicine, Tongji
University, Shanghai 200000, China.
3Gynecology Department, Taiyuan Maternal and Child Health Hospital, Taiyuan, Shanxi 030000, China.
4Cellular & Molecular Diagnostics Center, Sun Yat-Sen Memorial Hospital, Sun Yat-Sen University, Guangzhou 510120, China.
†Equally contributed to this work
*Corresponding author 1: Yongsheng Huang, Cellular & Molecular Diagnostics Center, Sun Yat-Sen Memorial Hospital, Sun Yat-Sen University, Guangzhou 510120, China. E-mail: huangysh65@mail.sysu.edu.cn
*Corresponding author 2: Yanhong Xiao, Department of Clinical Laboratory, The Sixth Affiliated Hospital, Sun Yat-sen University, Guangzhou, Guangdong 510655, China. E-mail: xiaoyh3@mail.sysu.edu.cn
Received: 07 March 2024; Accepted: 15 March 2024; Published: 27 March 2024
Citation: Shuwei Ren, Yuanmei Zhang, Yan Ouyang, Chi Zhang, Yi Su, Xiaona Shi, Yanhong Xiao, Yongsheng Huang. Mutation Characteristics of the MYC Proximal Network and its Implications for Immunotherapy in Human Cancer. Fortune Journal of Health Sciences. 7 (2024): 164-177.
View / Download Pdf Share at FacebookAbstract
Background: The proximal MYC network (PMN), formed by MYC, related transcription factors, and coregulatory proteins, has been implicated in cancer. However, it is lacking systematic assessment of the effect of the mutation of PMN-related genes on immune checkpoint inhibitor (ICI) response.
Methods: To explore this, a discovery cohort that patients with whole-exome sequencing (WES) and ICI-treated clinical information were integrated. Another independent pan-cancer cohort that patients with next-generation sequencing (NGS) data were collected for further verification. The Cancer Genome Atlas (TCGA) cohort was used to analyze mutation frequency and genomic mutation characteristics. The anti-tumor immunity and molecular mechanism analysis was performed using the public available single-cell RNA-seq, tissue RNA-seq, and ChIP-seq data.
Results: Among the 13 PMN-related genes, MGA has the highest mutation frequency (8%). A higher objective response rate (ORR, 56.7% vs 29.3%) and durable clinical benefit (DCB, 67.9% vs 43.6%) were found in MGA-mutated (MGA-MUT) patients. Compared with MGA-wildtype (MGA-WT) patients, MGA-MUT patients obtained a longer overall survival time. Multivariate regression analysis showed that MGA mutation was an independent prognostic factor in ICI-treated patients. Furthermore, MGA-MUT patients have more mutation events in the genome with a higher mutation frequency of several genes (such as TTN, MUC16, and LRP1B, etc). A higher tumor mutation burden (TMB) and neoantigens were detected in MGA-MUT patients. MGA-MUT patients have more abundance in immune cells (including CD8+ T cells and macrophages). Most of the cytotoxic activity, immune checkpoint, and chemokine genes were upregulated in the MGA- MUT tumors. At the single-cell level, MGA was mainly expressed on most immune cells, including CD8 Tex, NK cell, monocyte/macrophage, etc. Mechanistically, several anti-tumor immunity pathways were enhanced in MGA-MUT tumors.
Conclusions: MGA-MUT is favorable to immunotherapy across multiple cancer types, which might be a predictive biomarker for patients’ clinical outcomes.
Keywords
The proximal MYC network, MGA, Immune checkpoint inhibitor, Pan-cancer
The proximal MYC network articles, MGA articles, Immune checkpoint inhibitor articles, Pan-cancer articles
Article Details
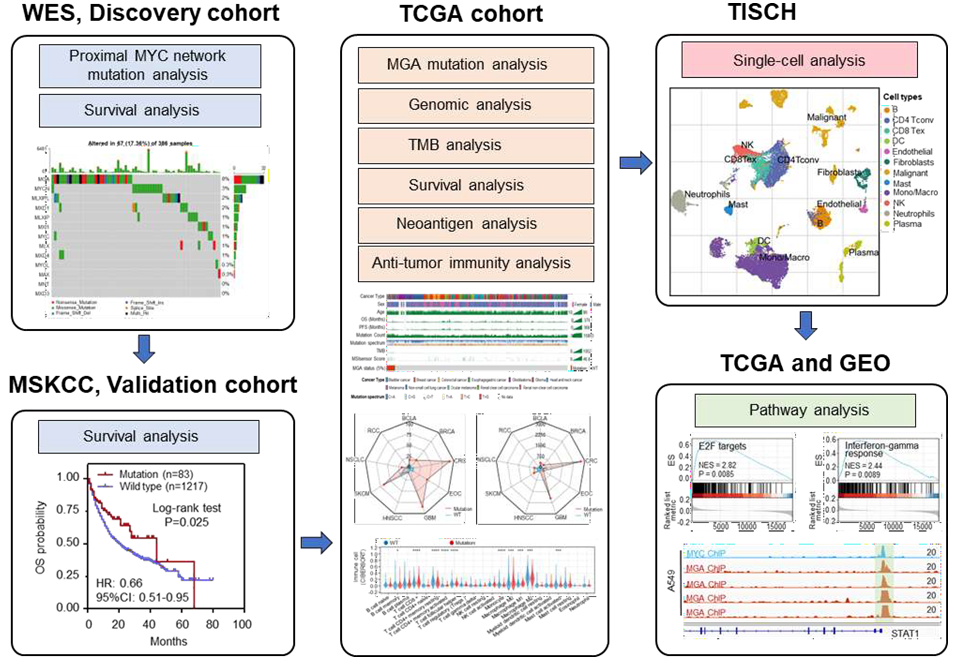
Graphical Abstract
Highlights
- MGA is the most frequently mutated gene in the proximal MYC network.
- MGA mutation associated with favorable clinical outcomes in patients with tumors.
- MGA is associated with immune cell infiltration and increased immunogenicity.
- Many immune-related pathways were enriched in MGA mutation tumors.
Introduction
Although immune checkpoint inhibitor (ICI) treatments (including Anti-PD1/L1 and Anti-CTLA4) represent significant innovations in therapy strategies in human solid tumors, some patients still present poor outcomes in clinical application [1-3]. Therefore, it is urgent to discover biological indicators to predict the ICI response. Recently, researchers have proposed many indicators for the use of immunotherapy, including PD1/PD-L1 expression, microsatellite instability (MSI), tumor mutation load (TMB), neoantigen load (NAL), and gene expression profiles [4-9]. However, there are still great limitations in the clinical use of these predictors. For instance, regardless of the PD1/PD-L1 expression levels, some patients also gained efficacious clinical outcomes in ICI treatment, while a few other patients even occurred paradoxical progressive disease [10-12]. Although MSI-high (MSI-H) has been adopted by a large number of clinicians as an indication for ICI treatment, it is mainly detected in adenocarcinoma (such as colorectal adenocarcinoma and gastric adenocarcinoma) [13, 14], which limits its utility in the non-adenocarcinoma tumors. The TMB, NAL, and gene expression profiles present enormous intra/intratumor heterogeneity and their cutoff value is not standardized across multiple cancer types, which limits their application in clinical practice. Therefore, to maximize the clinical benefits, it is necessary to further explore new biomarkers for the prediction of ICI treatment.
Initially, the genetic alterations of the MYC gene and its paralogs (MYCN and MYCL) were identified across multiple cancers and led to tumorigenesis [15, 16]. The role of MYC as a transcription factor in many studies is usually considered in isolation [17]. Subsequently, an increasing number of studies have considered the function of MYC in the context of related transcription factors and co-regulatory proteins network that have the potential to affect the MYC signals. This network is considered as proximal MYC network (PMN), including MAX, MGA, MXD1, MXD3, MXD4, MXI1, MNT, MLX, MLXIP, and MLXIPL [16, 18]. As an important
regulatory network in vivo, PMN is involved in a variety of physiological activities, including signal transduction, cell metabolism, and differentiation, tumorigenesis [16, 19, 20]. For example, the Myc/Max network co-repression of mismatch repair gene expression by hypoxia in cancer cells [19]. MLX and other members of the PMN regulate the metabolism and differentiation in both spermatogenesis and male germ cell tumors [20]. However, the mutant characteristics of PMN and their clinical significance in ICI treatment in human solid tumors remain unknown. Here, we performed a systematic assessment to identify the mutation of MYC and PMN for predicting the clinical outcomes of ICI treatment across multiple cancers. Among the 13 PMN-related genes, MGA mutation (MGA-MUT) functioned as an independent prognostic biomarker and predicted a higher objective response (ORR) and durable clinical benefit (DCB) rate. The genomic signatures with more mutation events were found in MGA-MUT tumors. A comprehensive analysis indicated that MGA-MUT is associated with enhanced immunogenicity (including TMB, tumor NAL, and immune cell infiltration level) and several anti-tumor immunity pathways, which might be critical for predicting immunotherapy and improving the prognosis of patients.
Materials and Methods
Discovery Cohort
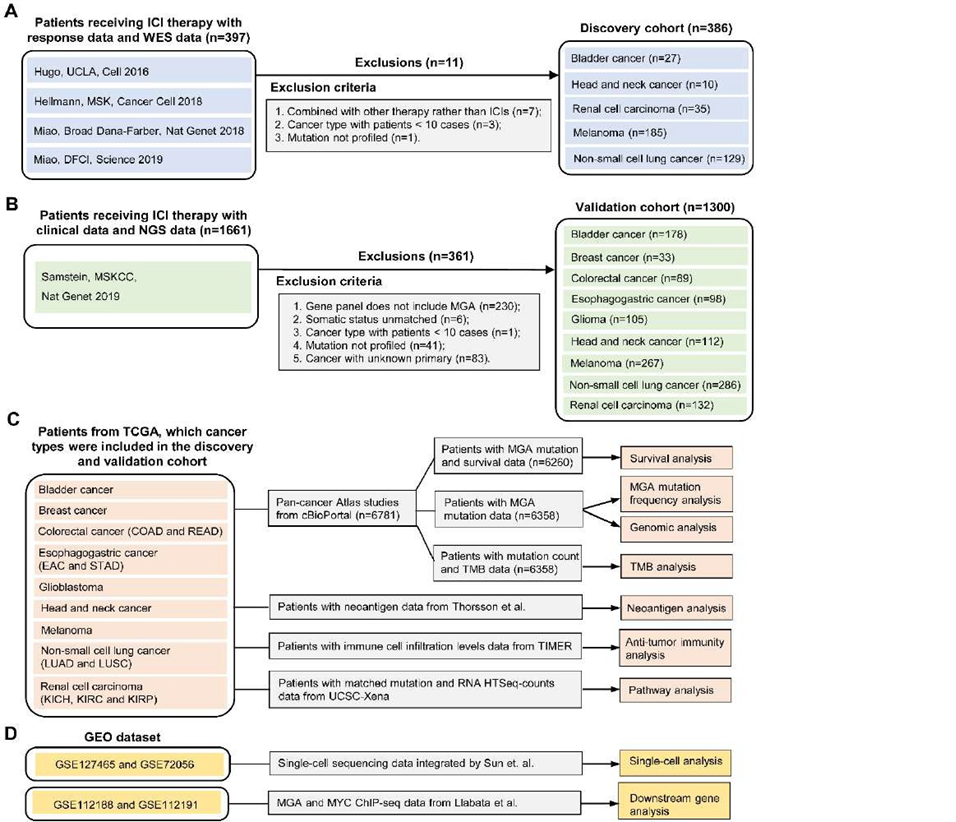
To evaluate the predictive power of MYC proximal network genes’ mutation in immunotherapy response, seven published studies were collected as discovery cohorts [21-24]. Among them, four studies (Rizvi et al., Snyder et al., Van Allen et al., and Miao et al.) have been consolidated and integrated by Miao et. al [24]. The whole exome sequencing (WES) data and clinical information of 397 patients were downloaded from cBioPortal (Figure 1A) [21-24]. The MSKCC cohort missed the overall survival (OS) data, while the UCLA cohort missed the progression-free survival (PFS) data. After data collation and integration, a total of 386 patients were collected (Figure 1A). The main clinical outcomes included PFS, OS, objective response rate (ORR), and durable clinical benefit (DCB). The ORR was assessed by the RECIST version 1.1 [25]. We defined complete response (CR), partial response (PR), or stable disease (SD) lasting longer than 6 months as DCB while considering the progression of disease (PD) or SD lasting less than 6 months as no durable benefit (NDB). The not evaluable (NE) was identified as patients who had not progressed and were censored before 6 months of follow-up.
Validation cohort
Another independent ICI-treated cohort from the MSKCC was used for validation. A total of 1661 patients were performed with MSK-IMPACT panels [4]. The genomic data and OS data of these patients were obtained from cBioPortal [4]. According to inclusion criteria, a total of 1300 patients were collected in the validation cohort (Figure 1B), including bladder cancer (BLCA, n=178), breast cancer (BRCA, n=33), colorectal cancer (CRC, n=89), esophagogastric cancer (EOC, n=98), Glioma (GMB, n=105), head and neck cancer (HNSC, n=112), melanoma (n=267), non-small cell lung cancer (NSCLC, n=286), and renal cell carcinoma (RCC, n=132).
The Cancer Genome Atlas (TCGA) cohort
In 33 types of TCGA cancers, we selected 6781 patients with tumor types in the discovery and validation cohort. Using cBioPortal online tools [26], we download the somatic mutation and clinical data of these patients. After data collation and integration, the mutation frequency of MGA, the association of MGA-MUT and genomic alteration, TMB, and OS were analyzed. We obtained the available neoantigen data from the Thorsson et al. study [27]. The immune cell infiltration levels of patients were obtained from TIMER2.0 [28]. The level 3 RNA-seq data were downloaded from the UCSC Xena data portal [29]. Figure 1C presents the TCGA data analysis process.
Single-cell analysis of MGA expression
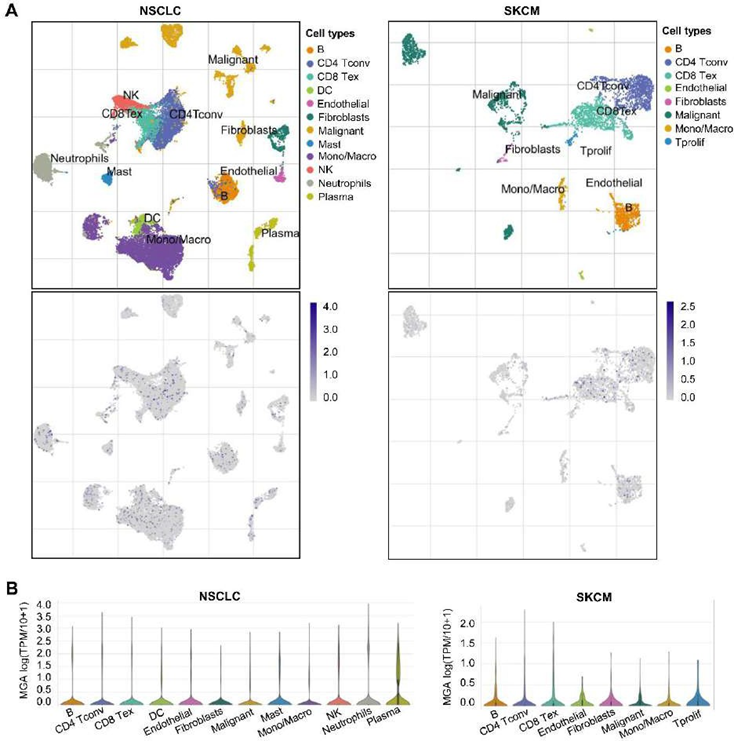
To analyze the expression level of MGA in different immune cells, we performed a single-cell analysis by tumor immune single-cell hub (TISCH) [30]. By means of the“dataset” module, we analyzed the expression of MGA at the single-cell level in the NSCLC_GSE127465 and SKCM_GSE72056 datasets with the “major-lineage” annotated cell types[31, 32].
Immune microenvironment and functional enrichment analysis
As for anti-tumor immunity, we performed a multi-directional analysis, which included the immune cell infiltration levels, TMB, neoantigen, and the expression of immune-related genes. The immune cell infiltration levels were evaluated by the CIBERSORT computational algorithm [33]. Based on previous studies, we classified immune-related genes into different types [27]. The functional enrichment analysis was performed by gene set enrichment analysis (GSEA), which used the hallmark gene sets from the Molecular Signatures Database [34]. To investigate the potential regulatory mechanisms of MGA, the ChIP-seq data from the GEO (GSE112188 and GSE112191) datasets were downloaded (Figure 1D) [35].
Statistical analysis
We used the R software and GraphPad Prism for statistical analyses. The ORR and DCB in MGA-MUT and MGA-WT patients were analyzed by Fisher’s exact test. As for immune cell infiltration levels, TMB, neoantigen, and the expression of immune-related genes between MGA-MUT and MGA-WT, we performed analysis by the Mann-Whitney U test. Kaplan–Meier methodology was used for survival analysis. A cox proportional hazards model was applied to multivariate survival analysis. P<0.05 was considered statistically significant.
Figure 1: Flowchart of this study design
(A) The discovery cohort including seven published WES studies. Among them, four studies (Rizvi et al., Snyder et al., Van Allen et al., and Miao et al.) have been consolidated and integrated by Miao et al. The MSK cohort missed the OS data, while the UCLA cohort missed the PFS data. (B) A total of 1300 immune checkpoint inhibitors treated patients from the MSKCC cohort were validation cohorts, which contain the NGS data and clinical information. (C) TCGA pan-cancer dataset that the tumor types appeared in the discovery and validation cohort. (D) The single-cell sequencing data of NSCLC and SKCM were obtained from GSE127465 and GSE72056. The MGA and MYC ChIP-seq data from Llabata et al. were obtained from GSE112188 and GSE112191.
Results
Identification of MGA-MUT benefit for immunotherapy in the discovery cohort
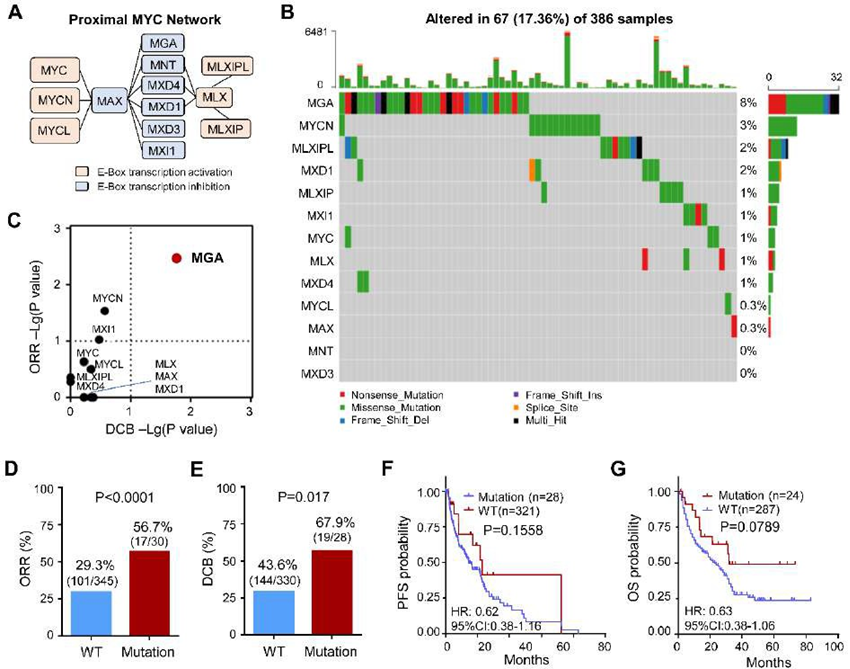
The MYC proximal network genes include MYC/MYCN/MYCL, E-Box transcription activation (MLX, MLXIP, MLXIPL) and E-Box transcription inhibition (MAX, MGA, MNT, MXD4, MXD1, MXD3, MXI1) (Figure 2A). To evaluate the effects of the mutation of MYC proximal network genes in response to immunotherapy, 386 ICI-treated patients across five types of cancers were selected as the discovery cohort (Figure 1A). The somatic variation of MYC proximal network genes was analyzed using the WES data. The mutant profiles of MYC proximal network genes are shown in Figure 2B. A total of 67 (17.36%) patients detected MYC proximal network genes’ mutation, which mutation types contain missense, nonsense, frameshift, and splice site variation (Figure 2B). Notably, the mutation frequency of MGA was 8%, while other MYC proximal network genes were all less than 5% (Figure 2B).
To evaluate the effect of MYC proximal network genes’ mutation on clinical outcomes in ICI-treated patients, the ORR and DCB of each patient based on this gene mutation status was assessed. The ORR of MGA and MYCN in mutation groups was evidently higher than the wild-type group, respectively (Figure 2C). Notably, only the DCB of MGA in mutation groups was significantly higher than in the wild-type group (Figure 2C). Compared with the MGA-WT group, both the ORR and DCB of MGA in the MGA-MUT group were significant, respectively (Figure 2D-E). Therefore, we focused on MGA for further investigations in this study. Furthermore, we analyzed the PFS and OS between the MGA-MUT and MGA-WT groups. Although there was no difference, a longer PFS (HR=0.62, 95%CI: 0.38-1.16) and OS (HR=0.63, 95%CI: 0.38-1.06) was found in MGA-MUT than those in MGA-WT patients (Figure 2F-G). These indicated that MGA-MUT is favorable to clinical outcomes in patients with ICI therapy.
Figure 2: MGA-MUT benefit for immunotherapy in the discovery cohort
(A) The diagram of the proximal MYC network. (B) The proximal MYC network-related genes’ mutation characteristic in tumors. (C) The clinical responses (ORR) and durable clinical benefit (DCB) of MYC network-related genes’ mutation in the discovery cohort. (D-E) The proportions of ORR and DCB in MGA-MUT and MGA-WT patients. (E) The Kaplan-Meier curves of PFS between MGA-MUT and MGA-WT patients. (F) The Kaplan-Meier curves of OS between MGA-MUT and MGA-WT patients. PFS, progression-free survival; OS, overall survival; HR, hazard ratio.
The validation of the MGA-MUT predictive ability in the MSKCC cohort
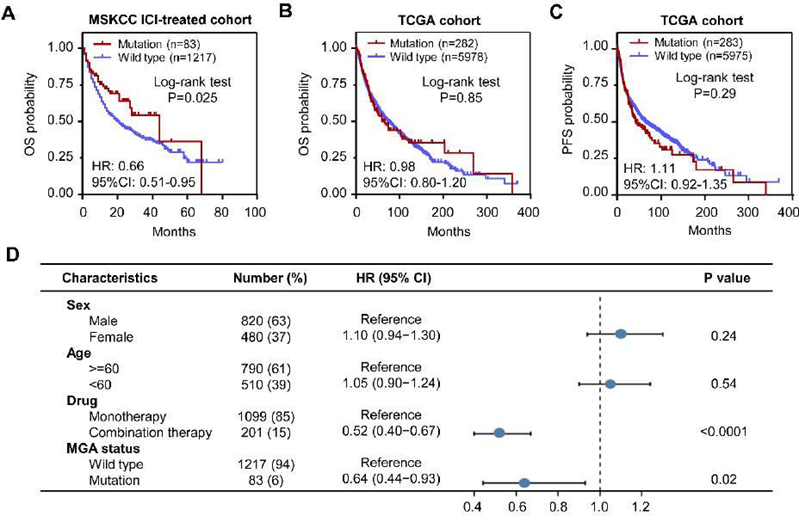
To verify the results, we performed the survival analysis in an independent validation cohort, which included BLCA(n=178), BRCA (n=33), CRC (n=89), EOC (n=98), GBM (n=105), HNSCC (n=112), melanoma (n=267), NSCLC (n=286), and RCC (n=132) (Figure 1B). Obviously, ICI-treated patients with MGA-MUT obtained longer OS time than those MGA-WT patients (HR = 0.66, 95%CI: 0.51-0.95, P=0.025) (Figure 3A). However, in a nonICI-treated cohort (TCGA), there were no differences in OS and PFS between MGA-MUT and MGA-WT patients (Figure 3B-C). To assess whether MGA-MUT is an independent prognostic factor in an ICI-treated cohort, we performed a univariate Cox regression analysis. Notably, MGA-MUT patients also had longer OS time than those MGA-WT patients (HR = 0.64, 95%CI: 0.44-0.93, P=0.02) (Figure 3D). These results indicate that MGA-MUT is beneficial to the clinical outcome of ICI-treated patients.
Figure 3: Validation the predictive power of MGA-MUT
(A) The Kaplan-Meier curves of OS between MGA-MUT and MGA-WT patients in the MSKCC ICI-treated cohort. (B) The Kaplan-Meier curves of OS and PFS between MGA-MUT and MGA-WT patients in the TCGA cohort. (C) Multivariate analysis of factors associated with OS in the MSKCC ICI-treated cohort. PFS, progression-free survival; OS, overall survival; HR, hazard ratio.
The genomic mutation characteristics of patients with MGA-MUT
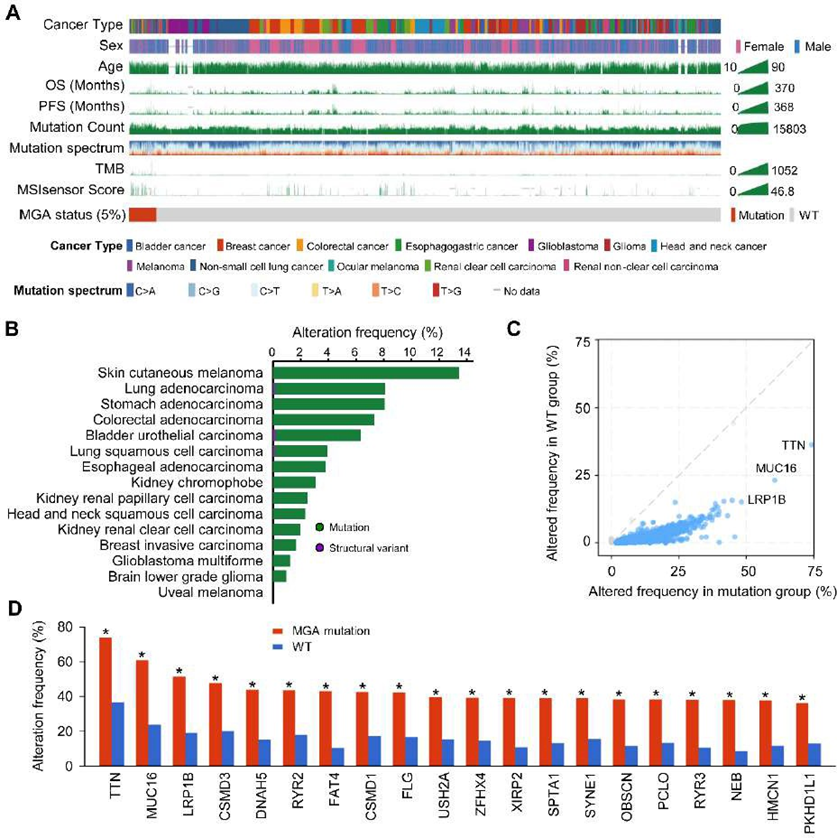
To explore the genomic signatures associated with MGA-MUT, the genomic data from the TCGA cohort were used. We collected the cancer types that appeared in the discovery and validation cohort, which including BLCA, BRCA, CRC, EOC, GBM, HNSCC, melanoma, NSCLC, and RCC (Figure 1C). A mutational landscape of patients with MGA-MUT and several clinical information (such as sex, age, OS, PFS, TMB, etc) was shown in Figure 4A. Among the 6358 patients, there are 5% of patients detected MGA-MUT (Figure 4A). Notably, among these tumors, the highest mutation frequency was present in skin cutaneous melanoma (more than 12%) (Figure 4B).
Next, the genomic mutation characteristics were analyzed between MGA-MUT and MGA-WT patients. Compared with MGA-WT patients, MGA-MUT patients have more mutation events in the genome, which include the mutation of TTN, MUC16, LRP1B, etc (Figure 4C). Figure 4D presents the top 30 mutated genes with the most significant mutation differences between MGA-MUT and MGA-WT patients. These genomic mutation characteristics indicated that MGA-MUT might be associated with the genomic alteration.
of ICI-treated patients.Figure 4: Genomic landscape of MGA in the TCGA cohort
(A) The clinical characteristics of MGA-MUT and MGA-WT patients in the TCGA cohort, of which including cancer type, sex, age, OS, PFS, mutation count, mutation spectrum, TMB, and MSI MANTIS score. (B) The alteration frequency of MGA across multiple cancers. (C) Different mutated genes between MGA-MUT and MGA-WT patients. (D) The top 20 genes with the most significant frequency of variation in the MGA-MUT patients. *, P < 0.05.
MGA-MUT is associated with tumor immune microenvironment (TME)
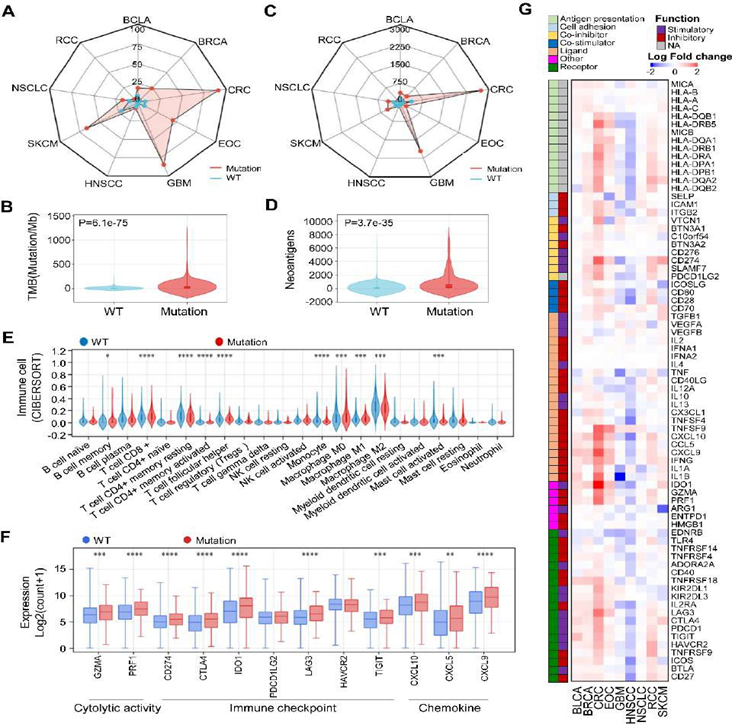
The tumor cell produces tumor neoantigens when the cell occurs genetic mutation, which is recognized by the immune system. Tumor neoantigens play an invaluable role in an immune response. Based on this, we hypothesized that the MGA-MUT patients with more mutation events in the genome may have a different TME. To address this, we first performed a TMB analysis in the TCGA cohort. Notably, MGA-MUT patients (especially CRC, EOC, GBM, and SKCM) have a higher TMB than those in MGA-WT patients (Figure 5A-B). Then we analyzed the tumor neoantigens and found that neoantigens were also higher in MGA-MUT tumors than those in MGA-WT tumors, especially in CRC and GBM (Figure 5C-D). The elevation of TMB and tumor neoantigens in MGA-MUT tumors suggests that MGA-MUT might be associated with TME. To investigate the TME, we use the CIBERSORT method to calculate the 24 immune cell infiltration levels of TCGA patients. Compared with MGA-WT patients, MGA-MUT patients have more abundance in CD8+ T cells, T follicular helper cells and macrophages, etc (Figure 5E). Also, a lower abundance of B memory cells, CD4+ memory resting T cells, and mast-activated cells were found in MGA-MUT tumors (Figure 5E). In immunotherapy, several genes are used as indicators in immune response, which mainly includes cytotoxic activity (GZMA, PRF1), immune checkpoint (CD274, CTLA4, IDO1, PDCD1LG2, LAG3, HAVCR2, TIGHT), and chemokine (CCL5, CXCL9, CCL10). Furthermore, we found that most of the cytotoxic activity, immune checkpoint, and chemokine genes were upregulated in the MGA-MUT tumors (Figure 5F). Furthermore, we analyzed the expression of immune-related genes in each cancer type. Except for GBM and HNSCC, the expression of stimulatory immunomodulators was generally upregulated in MGA-MUT tumors (Figure 5G). These results indicated that MGA-MUT is associated with anti-tumor immunity.
Figure 5: MGA-MUT was associated with enhanced anti-tumor immunity
(A-B) The wind rose map of TMB and tumor neoantigens in MGA-MUT and MGA-WT patients. (C-D) The distribution of TMB and tumor neoantigens in MGA-MUT and MGA-WT tumors. (E) The infiltration levels of 22 immune cell types in MGA-MUT and MGA-WT tumors. Mann- Whitney U test; NS, not significant; *, P < 0.05; **, P < 0.01; ***, P < 0.001; ****, P < 0.0001. (D) The expression of immune-related genes in MGA-MUT and MGA-WT tumors. Mann-Whitney U test; **, P < 0.01; ***, P < 0.001; ****, P < 0.0001. (E) The heatmap of expression of immune-related genes (log2-transformed fold change) in MGA-MUT and MGA-WT patients across multiple cancers.
Expression of MGA based on single-cell RNA-seq (scRNA) analysis
We further analyzed the effects of MGA on the TME using a public single-cell database. We analyzed the expression of MGA on different immune cells in NSCLC and SKCM and found that MGA was mainly expressed on most immune cells, including CD4+ T conventional T (Tconv) cell, CD8 Tex, NK cell, and monocyte/macrophage, etc (Figure 6). The expression of MGA in most immune cells further indicated that MGA is associated with TME.
MGA-MUT is associated with immune-related pathways
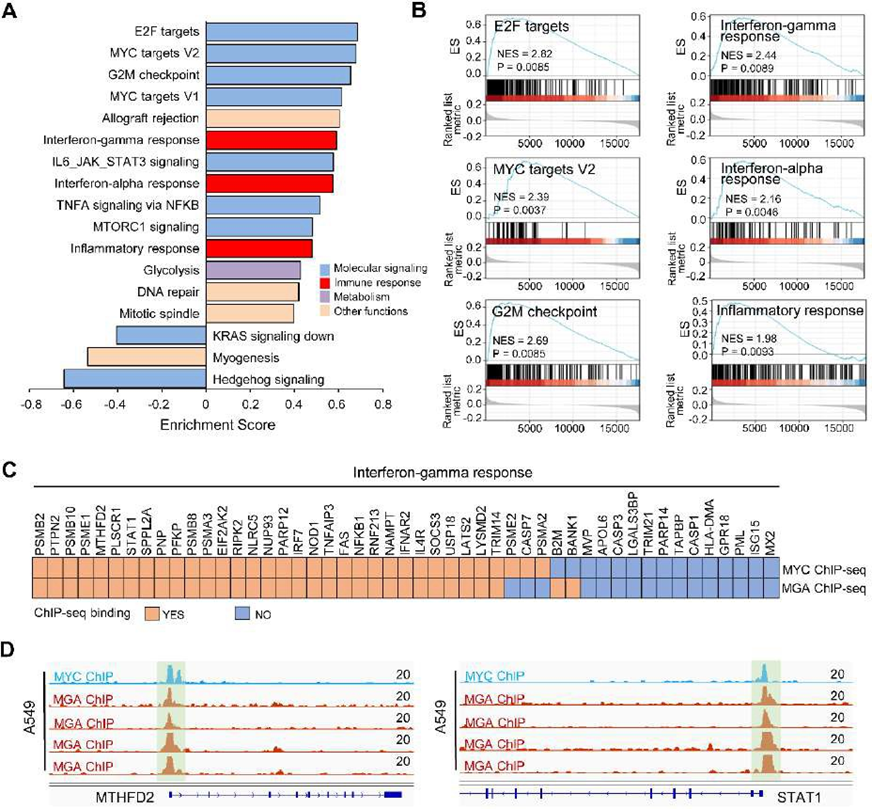
We used TCGA RNA-seq data and GEO ChIP-seq data for mechanistic analysis. The TCGA patients were divided into MGA-MUT and MGA-WT groups. Then we performed GSEA and found that several molecular signaling pathways were enriched in MGA-WT tumors, including E2F targets, MYC targets V2, and G2M checkpoint, etc (Figure 7A-B). In addition, immune-related pathways (such as interferon-gamma response, interferon-alpha response, and inflammatory response) were also significantly enriched in MGA-MUT groups (Figure 7A-B). As a member of the MYC proximal network, whether MGA affects MYC singling. To address this, we analyzed the MGA and MYC ChIP-seq data. Notably, most of the genes in the interferon-gamma response pathway were co-bound by MGA and MYC (Figure 7C-D). These results suggest that MGA binding to MYC-bound genomic sequences antagonizes MYC signaling, and then alters the immune-related pathways.
Figure 7: MGA-related pathway analysis
(A) Pathway enrichment analyses were performed by GSEA between MGA-MUT and MGA-WT tumors. The results that adjust P value < 0.01 were shown. The significant pathways were divided into four groups: molecular signaling (blue), immune response (red), Metabolism (purple), and other functions (brown). (B) The significant immune response pathways of GSEA plot. (C) The ChIP-seq showed that MYC and MGA co-binding to most genes in the interferon-gamma response pathway. (D) MYC and MGA co-binding to the promoter of MTHFD2 and STAT1.
Discussion
With the development of NGS, many gene panels based on different genes have been applied in clinical practice. However, it is not clear which patients with specific genetic mutations would benefit from ICI treatment. Here, we systematically integrated both WES and NGS data and comprehensively evaluated the association between the mutation status of MYC and PMN-related genes and immunotherapy responses across multiple cancers. After systematic analysis, we identified that MGA-MUT is significantly associated with better clinical outcomes (including ORR and DCB) in tumor patients with ICI treatment. This is the first systematic assessment of MYC and PMN-related genes status in multiple solid cancers, which enhanced our understanding of the function of MYC and PMN in tumors and provided better guidance for the clinical immunotherapy of patients. The function of MYC oncogene in tumorigenesis, metastasis, prognosis as well as therapy resistance is relatively clear [36]. As a regulatory network, PMN is extremely important for the regulation of MYC signals. Previous studies of MYC and PMN in cancer mainly focused on tumorigenesis, cell metabolism, and differentiation [16, 19, 20]. Here, we systematically evaluated the mutant characteristics of MYC and PMN-related genes in multiple solid cancers and identified MGA-MUT is beneficial to patients with ICI treatment. Although MGA-MUT often occurred in solid tumors, MGA-MUT did not affect the non-ICI-treated patients’ clinical outcomes in our study, which suggests that the function of MGA-MUT is significantly effective in ICI treatment. Sun etc. al found that MGA-MUT patients are also beneficial for ICI treatment in non-squamous NSCLC. These further illustrated that MGA-MUT can be used as a predictive biomarker for ICI response in human solid cancers, which need further clinical and preclinical validation.
To date, somatic mutations drive the production of neoantigens in tumor cells, which affect the efficacy of ICI treatment [37, 38]. Here, we found that MGA-MUT patients have a higher neoantigen than those MGA-WT patients, suggesting MGA-MUT patients have different genomic characteristics. Indeed, MGA-MUT patients have more mutation events in the genome, which include the mutation of TTN, MUC16, LRP1B, etc. These special genomic characteristics may drive the production of neoantigens in tumor cells, which is beneficial to ICI treatment in solid tumors. Indeed, among these special genomic characteristics, several mutations are associated with favorable immunotherapy. For example, LRP1B mutations are associated with favorable outcomes to ICI across multiple cancer types [39, 40]; MUC16 mutations are associated with better survival outcomes in patients with gastric cancer [41]. In addition to genomic signatures, we found that the main mutant type of MGA is a missense mutation, which may also produce tumor neoantigens. TME refers to the presence of non-cancerous cells and their components, including various immune cells and cytokines. The continuous interaction between tumor cells and TME was comprehensively involved in tumorigenesis, progression, metastasis, and response to therapy [42, 43]. Previous studies reported that MGA loss significantly accelerates the progression and invasiveness in NSCLC [44, 45]. However, these studies did not consider the effect of TME on tumors. When the TME and ICI treatment is taken into account, MGA inactivation may have the opposite function. Indeed, Sun et al. indicated that MGA mutation correlates with higher TMB and elevated neoantigen in NSCLC, and its mutation is beneficial to ICI therapies in patients [46]. Here, we identified that MGA-MUT patients had higher infiltration levels of antitumor immune cells, including CD8+ T cells, T follicular helper cells, and macrophages, etc. Moreover, MGA-MUT patients had favorable clinical outcomes in ICI-treated patients. These results further validated MGA-MUT associated with TME. Indeed, except for the immune cells, immune-related genes was universally upregulated in MGA-MUT tumors. Furthermore, scRNA data showed MGA expression in most immune cells. The alterations of immune cells and immune-related genes cause anti-tumor immunity and then benefit ICI treatment.
Mechanically, we found that MGA-WT tumors were enriched in E2F targets, MYC targets V2, and G2M checkpoint pathways, which are highly opposite to the MYC signals. Previous studies indicated that MGA opposes to the MYC oncoprotein and interacts with a noncanonical PCGF6- PRC1 complex to participate in gene repression [35]. Indeed, we also found that MYC-activated genes were bound by MGA, suggesting a negative regulator of MYC signals appeared. Indeed, MAX mutant tumors had ASCL1/NEUROD1 characteristics and lacked MYC transcriptional activity in small-cell lung cancer [45]. Here, we found that MGA-MUT patients had special genomic characteristics, which are associated with high levels of TMB and neoantigens as well as TME. Consistently, immune-related pathways (such as interferon-gamma response, interferon-alpha response, and inflammatory response) were also significantly enriched in MGA-MUT tumors. However, a more detailed mechanism of MGA-MUT in ICI treatment needs further study. In the real world, although PD1/PD-L1 protein expression, TMB, and MSI are widely used in clinical practice [4, 5, 47], there are some objective limitations. For instance, different PD1/PD-L1 antibodies staining varies greatly, resulting in the interpretation of PD1/PD-L1 protein expression depending on an experienced clinical pathologist. As a relatively reliable indicator of ICI treatment, TMB requires detecting large genomic regions, which is undoubtedly expensive. MSI-H was mainly detected in adenocarcinoma (such as colorectal adenocarcinoma, gastric adenocarcinoma, etc.)[13, 14], which limits its utilization in non-adenocarcinoma, including squamous cell carcinoma, clear cell carcinoma, etc. Among these limitations, gene mutation detection based on NGS/PCR has great advantages. Here, MGA-MUT is conducive to ICI treatment, which MGA gene detection may be used in the selection of immunotherapy patients. Of course, large-scale studies need to be verified in the future.
Conclusion
Here, we systematically analyzed the mutation characteristics of MYC and PMN genes and identified MGA-MUT favorable outcomes to ICI across multiple cancer types. Furthermore, MGA-MUT is associated with TME and several immune response pathways, which increases our understanding of PMN genes in ICI treatment.
Acknowledgments
We would like to thank the authors of previous studies and the staff members of the cBioPortal, TCGA, UCSC Xena data portal, and CIBERSORT portal for providing available data. We thank the authors of previous studies for providing available data.
Authors’ Contributions
Study administration, validation, and design: Yanhong Xiao and Yongsheng Huang. Methodology, acquisition, and interpretation of data: Shuwei Ren, Yan Ouyang, and Chi Zhang. Writing-original manuscript: Shuwei Ren. Study supervision: Yongsheng Huang. All authors read and approved the final manuscript.
Funding
This study was supported by funding from the National Natural Science Foundation of China (82203435, 82203703), Guangdong Basic and Applied Basic Research Foundation (2021A1515111138), China Postdoctoral Science Foundation (2022M713576, 2022T150757).
Data availability
Data are available in a public, open access repository.
Ethics approval and informed consent
The study was conducted in accordance with the Helsinki Declaration.
Consent for publication
Not applicable.
Competing interest
The authors declare that the research was conducted in the absence of any commercial or financial relationships that could be construed as a potential conflict of interest.
Availability of data and Materials
All of the data in this study were described in the “Methods” section.
References
- Kennedy LB, Salama AKS. A review of cancer immunotherapy toxicity. CA: a cancer journal for clinicians 70 (2020): 86-104.
- Liu L, Bai H, Wang C, Seery S, Wang Z, Duan J, et al: Efficacy and Safety of First-Line Immunotherapy Combinations for Advanced NSCLC: A Systematic Review and Network Meta-Analysis. Journal of thoracic oncology: official publication of the International Association for the Study of Lung Cancer 16 (2021): 1099-1117.
- Tan AC, Bagley SJ, Wen PY, Lim M, Platten M, Colman H, et al: Systematic review of combinations of targeted or immunotherapy in advanced solid tumors. Journal for immunotherapy of cancer 9 (2021).
- Samstein RM, Lee CH, Shoushtari AN, Hellmann MD, Shen R, Janjigian YY, et al: Tumor mutational load predicts survival after immunotherapy across multiple cancer types. Nat Genet 51 (2019): 202-206.
- Ready N, Hellmann MD, Awad MM, Otterson GA, Gutierrez M, Gainor JF, et al, First-Line Nivolumab Plus Ipilimumab in Advanced Non- Small-Cell Lung Cancer (CheckMate 568): Outcomes by Programmed Death Ligand 1 and Tumor Mutational Burden as Biomarkers. Journal of clinical oncology: official journal of the American Society of Clinical Oncology 37 (2019): 992-1000.
- Weng J, Li S, Zhu Z, Liu Q, Zhang R, Yang Y. Exploring immunotherapy in colorectal cancer. J Hematol Oncol 15 (2022): 95.
- Ott PA, Bang YJ, Piha-Paul SA, Razak ARA, Bennouna J, Soria JC, et al, T-Cell-Inflamed Gene-Expression Profile, Programmed Death Ligand 1 Expression, and Tumor Mutational Burden Predict Efficacy in Patients Treated With Pembrolizumab Across 20 Cancers: KEYNOTE-028. Journal of clinical oncology: official journal of the American Society of Clinical Oncology 37 (2019): 318-327.
- Davoli T, Uno H, Wooten EC, Elledge SJ. Tumor aneuploidy correlates with markers of immune evasion and with reduced response to immunotherapy. Science 355 (2017).
- Hakimi AA, Voss MH, Kuo F, Sanchez A, Liu M, Nixon BG, et al. Transcriptomic Profiling of the Tumor Microenvironment Reveals Distinct Subgroups of Clear Cell Renal Cell Cancer: Data from a Randomized Phase III Trial. Cancer Discov 9 (2019): 510-525.
- Ferris RL, Blumenschein G Jr, Fayette J, Guigay J, Colevas AD, Licitra L, et al. Nivolumab for Recurrent Squamous-Cell Carcinoma of the Head and Neck. N Engl J Med 375 (2016): 1856-1867.
- Bauml J, Seiwert TY, Pfister DG, Worden F, Liu SV, Gilbert J, et al. Pembrolizumab for Platinum- and Cetuximab-Refractory Head and Neck Cancer: Results from a Single-Arm, Phase II Study. Journal of clinical oncology: official journal of the American Society of Clinical Oncology 35 (2017): 1542-1549.
- Harrington KJ, Ferris RL, Blumenschein G Jr, Colevas AD, Fayette J, Licitra L, et al: Nivolumab versus standard, single-agent therapy of investigator's choice in recurrent or metastatic squamous cell carcinoma of the head and neck (CheckMate 141): health-related quality-of-life results from a randomised, phase 3 trial. The Lancet Oncology 18 (2017): 1104-1115.
- van Velzen MJM, Derks S, van Grieken NCT, Haj Mohammad N, van Laarhoven HWM: MSI as a predictive factor for treatment outcome of gastroesophageal adenocarcinoma. Cancer Treat Rev 86 (2020): 102024.
- Luchini C, Brosens LAA, Wood LD, Chatterjee D, Shin JI, Sciammarella C, et al. Comprehensive characterisation of pancreatic ductal adenocarcinoma with microsatellite instability: histology, molecular pathology and clinical implications. Gut 70 (2021): 148-156.
- Stine ZE, Walton ZE, Altman BJ, Hsieh AL, Dang CV. MYC, Metabolism, and Cancer Cancer Discov 5 (2015): 1024-1039.
- Schaub FX, Dhankani V, Berger AC, Trivedi M, Richardson AB, Shaw R, et al. Pan-cancer Alterations of the MYC Oncogene and Its Proximal Network across the Cancer Genome Atlas. Cell Syst 6 (2018): 282-300.e282.
- Shih DJH, Nayyar N, Bihun I, Dagogo-Jack I, Gill CM, Aquilanti E, et al. Genomic characterization of human brain metastases identifies drivers of metastatic lung adenocarcinoma. Nat Genet 52 (2020): 371-377.
- Conacci-Sorrell M, McFerrin L, Eisenman RN. An overview of MYC and its interactome. Cold Spring Harbor perspectives in medicine 4 (2014): a014357.
- Bindra RS, Glazer PM. Co-repression of mismatch repair gene expression by hypoxia in cancer cells: role of the Myc/Max network. Cancer letters 252 (2007): 93-103.
- Carroll PA, Freie BW, Cheng PF, Kasinathan S, Gu H, Hedrich T, et al. The glucose-sensing transcription factor MLX balances metabolism and stress to suppress apoptosis and maintain spermatogenesis. PLoS biology 19 (2021): e3001085.
- Rizvi NA, Hellmann MD, Snyder A, Kvistborg P, Makarov V, Havel JJ, et al. Cancer immunology. Mutational landscape determines sensitivity to PD-1 blockade in non-small cell lung cancer. Science 348 (2015): 124-128.
- Snyder A, Makarov V, Merghoub T, Yuan J, Zaretsky JM, Desrichard A, et al. Genetic basis for clinical response to CTLA-4 blockade in melanoma. N Engl J Med 371 (2014): 2189-2199.
- Van Allen EM, Miao D, Schilling B, Shukla SA, Blank C, Zimmer L, et al. Genomic correlates of response to CTLA-4 blockade in metastatic melanoma. Science 350 (2015): 207-211.
- Miao D, Margolis CA, Vokes NI, Liu D, Taylor-Weiner A, Wankowicz SM, et al. Genomic correlates of response to immune checkpoint blockade in microsatellite-stable solid tumors. Nat Genet 50 (2018): 1271-1281.
- Hugo W, Zaretsky JM, Sun L, Song C, Moreno BH, Hu-Lieskovan S, et al. Genomic and Transcriptomic Features of Response to Anti-PD-1 Therapy in Metastatic Melanoma. Cell 165 (2016): 35-44.
- Gao J, Aksoy BA, Dogrusoz U, Dresdner G, Gross B, Sumer SO, et al. Integrative analysis of complex cancer genomics and clinical profiles using the cBioPortal. Science signaling 6 (2013): pl1.
- Thorsson V, Gibbs DL, Brown SD, Wolf D, Bortone DS, Ou Yang TH, et al. The Immune Landscape of Cancer. Immunity 48 (2018): 812-830.e814.
- Li T, Fu J, Zeng Z, Cohen D, Li J, Chen Q, et al. TIMER2.0 for analysis of tumor- infiltrating immune cells. Nucleic acids research 48 (2020): W509-w514.
- Goldman MJ, Craft B, Hastie M, Repecka K, McDade F, Kamath A, et al. Visualizing and interpreting cancer genomics data via the Xena platform. Nature biotechnology 38 (2020): 675-678.
- Sun D, Wang J, Han Y, Dong X, Ge J, Zheng R, et al. TISCH: a comprehensive web resource enabling interactive single-cell transcriptome visualization of tumor microenvironment. Nucleic acids research 49 (2021): D1420-d1430.
- Zilionis R, Engblom C, Pfirschke C, Savova V, Zemmour D, Saatcioglu HD, et al. Single-Cell Transcriptomics of Human and Mouse Lung Cancers Reveals Conserved Myeloid Populations across Individuals and Species. Immunity 50 (2019): 1317-1334.e1310.
- Tirosh I, Izar B, Prakadan SM, Wadsworth MH, 2nd, Treacy D, et al. Dissecting the multicellular ecosystem of metastatic melanoma by single-cell RNA-seq. Science (New York, NY) 352 (2016): 189-196.
- Chen B, Khodadoust MS, Liu CL, Newman AM, Alizadeh AA. Profiling Tumor Infiltrating Immune Cells with CIBERSORT. Methods in molecular biology (Clifton, NJ) 1711 (2018): 243-259.
- Subramanian A, Tamayo P, Mootha VK, Mukherjee S, Ebert BL, Gillette MA, et al. Gene set enrichment analysis: a knowledge-based approach for interpreting genome-wide expression profiles. Proc Natl Acad Sci USA 102 (2005): 15545-15550.
- Llabata P, Mitsuishi Y, Choi PS, Cai D, Francis JM, Torres-Diz M, et al. Multi-Omics Analysis Identifies MGA as a Negative Regulator of the MYC Pathway in Lung Adenocarcinoma. Molecular cancer research MCR 18 (2020): 574-584.
- Duffy MJ, O’Grady S, Tang M, et al. MYC as a target for cancer treatment. Cancer treatment reviews 94 (2021): 102154.
- Schumacher TN, Schreiber RD: Neoantigens in cancer immunotherapy. Science 348 (2015): 69-74.
- Jiang T, Shi T, Zhang H, Hu J, Song Y, Wei J, et al. Tumor neoantigens: from basic research to clinical applications. J Hematol Oncol 12 (2019): 93.
- Brown LC, Tucker MD, Sedhom R, Schwartz EB, Zhu J, Kao C, et al. LRP1B mutations are associated with favorable outcomes to immune checkpoint inhibitors across multiple cancer types. J Immunother Cancer 9 (2021).
- Cheng Y, Tang R, Li X, Wang B, Cheng Y, Xiao S, et al. LRP1B is a Potential Biomarker for Tumor Immunogenicity and Prognosis of HCC Patients Receiving ICI Treatment. Journal of hepatocellular carcinoma 9 (2022): 203-220.
- Li X, Pasche B, Zhang W, Chen K. Association of MUC16 Mutation with Tumor Mutation Load and Outcomes in Patients with Gastric Cancer. JAMA oncology 4 (2018): 1691- 1698.
- Zhang Y, Zhang Z. The history and advances in cancer immunotherapy: understanding the characteristics of tumor-infiltrating immune cells and their therapeutic implications. Cellular & molecular immunology 17 (2020): 807-821.
- Bader JE, Voss K, Rathmell JC: Targeting Metabolism to Improve the Tumor Microenvironment for Cancer Immunotherapy. Mol Cell 78 (2020): 1019-1033.
- Mathsyaraja H, Catchpole J, Freie B, Eastwood E, Babaeva E, Geuenich M, et al. Loss of MGA repression mediated by an atypical polycomb complex promotes tumor progression and invasiveness. eLife 10 (2021).
- Llabata P, Torres-Diz M, Gomez A, Tomas-Daza L, Romero OA, Grego-Bessa J, et al. MAX mutant small-cell lung cancers exhibit impaired activities of MGA-dependent noncanonical polycomb repressive complex. Proceedings of the National Academy of Sciences of the United States of America 118 (2021).
- Sun L, Li M, Deng L, Niu Y, Tang Y, Wang Y, et al. MGA Mutation as a Novel Biomarker for Immune Checkpoint Therapies in Non-Squamous Non-Small Cell Lung Cancer. Front Pharmacol 12 (2021): 625593.
- Rizzo A, Ricci AD, Brandi G: PD-L1, TMB, MSI, and Other Predictors of Response to Immune Checkpoint Inhibitors in Biliary Tract Cancer. Cancers 13 (2021).

