Microwave Assisted Synthesis of Graphene/SnO2 Nanocomposite and its Structural, Dielectric and Electrical Properties
Article Information
Moheeta Khan1, 2*, Azra Parveen1
1Department of Applied Physics, Z.H. College of Engg. &Tech., Aligarh Muslim University, U.P, India
2Department of Education, Aligarh Muslim University, Aligarh, India
*Corresponding author: Moheeta Khan, Department of Education, Aligarh Muslim University, Aligarh, 202002, India
Received: 17 December 2019; Accepted: 28 December 2019; Published: 11 January 2020
Citation:
Moheeta Khan, Azra Parveen. Microwave Assisted Synthesis of Graphene/SnO2 Nanocomposite and its Structural, Dielectric and Electrical Properties. Journal of Nanotechnology Research 2 (2020): 010-024.
View / Download Pdf Share at FacebookAbstract
Graphene-metal nanocomposites are the best candidates for the greater sensitivity for various applications. We have prepared Graphene-Tin Oxide (G/SnO2) nanocomposite by using facile eco-friendly Anton-Paar microwave synthesis reactor method. X-ray diffraction patterns revealed the formation of G/SnO2 nanocomposite. The scanning electron microscopy and transmission electron microscopy images show a uniform distribution of nano-needles on the graphene surface and the average particle size was found to be in the range of 3-5 nm. The G/SnO2 composite shows an enhanced optical property, i.e., tunability in the band of pristine SnO2 nanoparticles while in contacted with graphene. The dielectric properties of the G/SnO2 nanocomposite were measured in the frequency ranges of 75Hz to 4MHz and real value of dielectric constant is found to be 1200, which is quite larger than that of pristine SnO2 nanoparticle, i.e., 12. Further, AC conductivity analysis revealed that the G/SnO2 is two orders conductive than the pristine SnO2. This work may offer an effective and economically viable for the preparation of graphene/metal-oxide nanocomposites for various applications.
Keywords
Eco-friendly method, Graphene, Nanocomposite
Eco-friendly method articles Eco-friendly method Research articles Eco-friendly method review articles Eco-friendly method PubMed articles Eco-friendly method PubMed Central articles Eco-friendly method 2023 articles Eco-friendly method 2024 articles Eco-friendly method Scopus articles Eco-friendly method impact factor journals Eco-friendly method Scopus journals Eco-friendly method PubMed journals Eco-friendly method medical journals Eco-friendly method free journals Eco-friendly method best journals Eco-friendly method top journals Eco-friendly method free medical journals Eco-friendly method famous journals Eco-friendly method Google Scholar indexed journals Graphene articles Graphene Research articles Graphene review articles Graphene PubMed articles Graphene PubMed Central articles Graphene 2023 articles Graphene 2024 articles Graphene Scopus articles Graphene impact factor journals Graphene Scopus journals Graphene PubMed journals Graphene medical journals Graphene free journals Graphene best journals Graphene top journals Graphene free medical journals Graphene famous journals Graphene Google Scholar indexed journals Nanocomposite articles Nanocomposite Research articles Nanocomposite review articles Nanocomposite PubMed articles Nanocomposite PubMed Central articles Nanocomposite 2023 articles Nanocomposite 2024 articles Nanocomposite Scopus articles Nanocomposite impact factor journals Nanocomposite Scopus journals Nanocomposite PubMed journals Nanocomposite medical journals Nanocomposite free journals Nanocomposite best journals Nanocomposite top journals Nanocomposite free medical journals Nanocomposite famous journals Nanocomposite Google Scholar indexed journals Physics articles Physics Research articles Physics review articles Physics PubMed articles Physics PubMed Central articles Physics 2023 articles Physics 2024 articles Physics Scopus articles Physics impact factor journals Physics Scopus journals Physics PubMed journals Physics medical journals Physics free journals Physics best journals Physics top journals Physics free medical journals Physics famous journals Physics Google Scholar indexed journals biomedical articles biomedical Research articles biomedical review articles biomedical PubMed articles biomedical PubMed Central articles biomedical 2023 articles biomedical 2024 articles biomedical Scopus articles biomedical impact factor journals biomedical Scopus journals biomedical PubMed journals biomedical medical journals biomedical free journals biomedical best journals biomedical top journals biomedical free medical journals biomedical famous journals biomedical Google Scholar indexed journals biological articles biological Research articles biological review articles biological PubMed articles biological PubMed Central articles biological 2023 articles biological 2024 articles biological Scopus articles biological impact factor journals biological Scopus journals biological PubMed journals biological medical journals biological free journals biological best journals biological top journals biological free medical journals biological famous journals biological Google Scholar indexed journals nanocomposites articles nanocomposites Research articles nanocomposites review articles nanocomposites PubMed articles nanocomposites PubMed Central articles nanocomposites 2023 articles nanocomposites 2024 articles nanocomposites Scopus articles nanocomposites impact factor journals nanocomposites Scopus journals nanocomposites PubMed journals nanocomposites medical journals nanocomposites free journals nanocomposites best journals nanocomposites top journals nanocomposites free medical journals nanocomposites famous journals nanocomposites Google Scholar indexed journals hydrazine monohydrate articles hydrazine monohydrate Research articles hydrazine monohydrate review articles hydrazine monohydrate PubMed articles hydrazine monohydrate PubMed Central articles hydrazine monohydrate 2023 articles hydrazine monohydrate 2024 articles hydrazine monohydrate Scopus articles hydrazine monohydrate impact factor journals hydrazine monohydrate Scopus journals hydrazine monohydrate PubMed journals hydrazine monohydrate medical journals hydrazine monohydrate free journals hydrazine monohydrate best journals hydrazine monohydrate top journals hydrazine monohydrate free medical journals hydrazine monohydrate famous journals hydrazine monohydrate Google Scholar indexed journals large exotherm articles large exotherm Research articles large exotherm review articles large exotherm PubMed articles large exotherm PubMed Central articles large exotherm 2023 articles large exotherm 2024 articles large exotherm Scopus articles large exotherm impact factor journals large exotherm Scopus journals large exotherm PubMed journals large exotherm medical journals large exotherm free journals large exotherm best journals large exotherm top journals large exotherm free medical journals large exotherm famous journals large exotherm Google Scholar indexed journals crystalline articles crystalline Research articles crystalline review articles crystalline PubMed articles crystalline PubMed Central articles crystalline 2023 articles crystalline 2024 articles crystalline Scopus articles crystalline impact factor journals crystalline Scopus journals crystalline PubMed journals crystalline medical journals crystalline free journals crystalline best journals crystalline top journals crystalline free medical journals crystalline famous journals crystalline Google Scholar indexed journals
Article Details
Moheeta Khan1, 2*, Azra Parveen1
1Department of Applied Physics, Z.H. College of Engg. &Tech., Aligarh Muslim University, U.P, India
2Department of Education, Aligarh Muslim University, Aligarh, India
*Corresponding author: Moheeta Khan, Department of Education, Aligarh Muslim University, Aligarh, 202002, India
Received: 17 December 2019; Accepted: 28 December 2019; Published: 11 January 2020
1. Introduction
Over the decade, graphene has emerged as a promising nano-platform with enormous potential for biomedical applications and translational research because of its excellent physical, chemical, and mechanical properties [1-4]. Graphene is a novel two-dimensional nano-material composed of sp2-bonded carbon atoms, possesses a number of extraordinary electronic, optical, and thermal properties. A lot of interesting work has been carried out to explore the graphene for widespread biomedical applications, ranging from drug/gene delivery, biological sensing and imaging, antibacterial materials, to biocompatible scaffold for cell culture [3-5]. It is also known to have tremendous kind of properties such as high mobility of charge carriers of ~2×105 cm2 V-1s-1 with intrinsic biocompatibility, low cost and scalable production, and facile biological/chemical functionalization [6].
As a new kind of carbon material, graphene has shown a wealth of exceptional properties and a variety of promising potential applications. Moreover, graphene is also established as composites with several semiconducting and metal oxides [7]. For example, Graphene-Tin Oxide (G/SnO2) nanocomposite, which has been explored as an efficient material for Lithium-ion batteries application [8]. It is notably that there are few studies related to the Graphene with SnO2 for different applications [8-11]. Hence, this require to develop reliable, facile and environmental-friendly methods to synthesize this nanocomposite. Generally, the synthesis methods of G/SnO2 nanocomposite were either tedious (including synthesizing graphene sheets and preparing nanocomposites) or needed dangerous reagents. In this work, we have performed a detailed analysis on graphene/SnO2 nanocomposite system by using SnO2 as a model semiconductor and development of Eco-friendly Green Synthesis method. The in-situ growth of SnO2 leads to the formation of uniform nanoparticles on graphene oxide (GO). Further, the SnO2 formation helps to prevent not only the aggregation of the GO but also the aggregation of SnO2 nanoparticles.
2. Synthesis of Graphene-SnO2 Nanocomposite
2.1 Preparation of graphene Oxide
A concentrated H2SO4 (100 mL) was added to a mixture of graphite flakes (3.0 g, 1 wt. equivalent) and HNO3 (25 mL), and the mixture was cooled to 0°C. KMnO4 (9.0 g, 3 wt. equivalent) was added slowly in portions to keep the reaction temperature below 20°C. The reaction was warmed to 35°C and stirred for 30 min and simultaneously water (130 mL) was added slowly, producing a large exotherm to 90°C. External heating was introduced to maintain the reaction temperature at 90°C for 15 min and cooled down the reaction using a water bath for 10 min. Additionally, water (420mL) and 30% H2O2 (3mL) were added, producing another exotherm. After air cooling, the mixture was purified (sifting, filtration, multiple washings, centrifugations and decanting, vacuum drying) and left with the 1.2 g of solid graphene oxide i.e., GO.
2.2 Preparation of graphene/SnO2 (G/SnO2) composite
To synthesize G/SnO2 nanocomposite, 0.2 g of GO and 0.7 g (2 mmol) of SnCl45H2O were added to 60 mL of de-ionized water followed by sonication for 30 min. Then, 50 mL of hydrazine monohydrate (80 wt. %) was added to mineralize the tin (Sn) ions. After 15 min of stirring (at 70°C), the mixture was transferred into the Anton pear monoreactor with a capacity of 30 mL and reacted under hydrothermal conditions at 200°C for 1h. The Anton paar monowave reactor was slowly cooled down to room temperature, and a black-colored product (i.e., G/SnO2) was isolated by filtration and dried at 60°C for 12 h. The whole synthesis process is demonstrated in schematically in Figure 1.
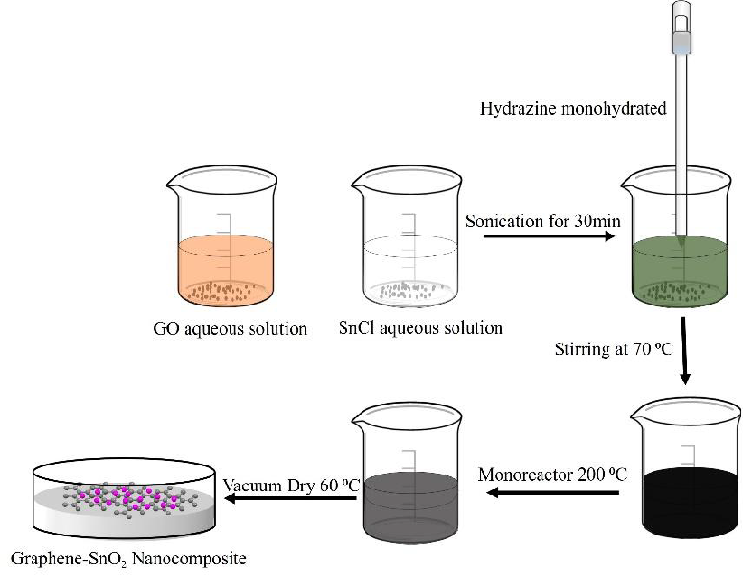
Figure 1: Formation mechanism of G/SnO2 nanocomposite.
3. X-ray Diffraction (XRD)
Figure 2 show the XRD patterns of graphene oxide (GO), SnO2 nanoparticle, and G/SnO2 nanocomposite. The diffraction peaks of crystalline SnO2 nanoparticles are clearly distinguishable. All strong diffraction lines can be indexed to the standard tetragonal SnO2 phase (JCPDS card no. 41-1445), indicating their strong crystalline nature. For pure GO, (002) reflection at 2θ = 10.4800 indicating a pure GO consists of multi-graphene oxide layer stacked together confirms from the other reports[8]. Further, GO is indeed reduced during hydrazine treatment. This diffraction peak around 10.480° for GO was shifted to a higher angle of around 24.475°, indicating that the GO was reassembled into graphene nanosheets (GNs). It can be noticeable in the G/SnO2 nanocomposite which shows diffraction peaks of SnO2 and G which shows agglomeration of GNs and SnO2 nanoparticles. The mean crystallite size of bare SnO2 and G/SnO2 are estimated to be 34 nm and 21.42 nm based on the Debye Scherrer formula[12].

Where, ‘D’ is the crystalline size of the particle, k is structure factor which is taken to be 0.94 for the crystalline systems, ‘λ’ is wavelength of Cu-Kα, ‘β’ is full width at half maxima and ‘θ’ is the diffraction angle. The shrink of the particle size of SnO2 is understandably due to the confinement of graphene sheet.
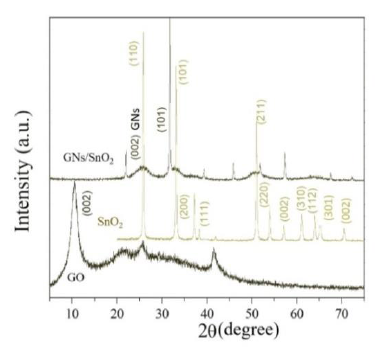
Figure 2: XRD patterns of SnO2, GO and G/SnO2 nanocomposite.
4. Scanning Electron Microscopy (SEM)
Figure 3 show the SEM images for G/SnO2 nanocomposite sample. It reveals that the G/SnO2 has a wavy shape consisting of various sheets arranged in a disordered manner while it seems that the tiny SnO2 nanoparticles homogeneously distributed on the graphene nanosheets. It is visible that the shape of graphene is crumpled paper-like and has many folded edges which also show agglomeration of carbon nanoparticles as predicted by XRD discussed in the prevision section. These results show that the SnO2 nanoparticles can be uniformly distributed on graphene through the interaction between graphene and SnO2 nanoparticles [6, 13]. Figure 3(c) shows the corresponding energy-dispersive X-ray spectrum (EDS) of GNs/SnO2 samples. Only Sn, C, and O elements are detected which further proves that there is no other impurities present in the sample. EDS elemental mappings for the elements Sn, O and C are shown in Figure 3 (d-f). The bright regions correspond to the presence of the elements Sn, O and C and indicate that the elements are distributed uniformly throughout the sample. The background signal in C mapping comes from the carbon conductive tape used to stick the sample with the sample holder.
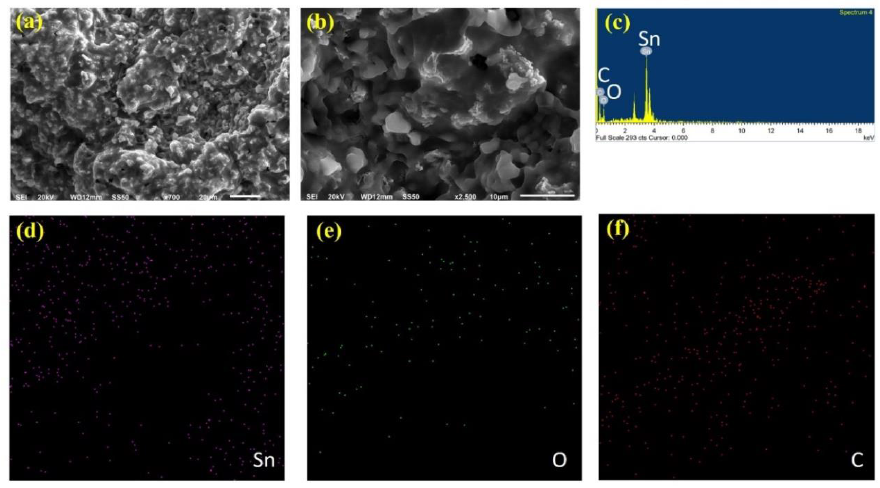
Figure 3: (a-b) Homogeneous distribution of SnO2 nanoparticles on G; (c) Energy-dispersive X-ray spectrum; (e-f) are the elemental mapping of Sn, O and C.
5. Transmission Electron Microscopy (TEM)
Figure 4 shows the images acquired at the edges of G/SnO2 composites. The composites are formed by several graphene sheets stacked together with SnO2 particles needle like shaped homogeneously dispersed at their surface (dark shapes). In TEM images, it appears that the SnO2 nanocrystals are distributed on the surface of the graphene nanosheets and the diameters of the SnO2 nanorods are measured to be less than 16 nm which is in good agreement with XRD data analysis. In Figure. 4(b), two distinct signatures exhibits such as void contain graphene sheets and needle like shape of SnO2. The former is due to the stacked and curled graphene sheets few layers as can be seen in Figure 4 (d), whereas in the latter, the SnO2 nano-needle surrounded by graphene sheets. The voids between them come from monolayer sheet that are not completely anchored by SnO2 nano-needle Figure 4 (c).

Figure 4: (a) Graphene interaction with SnO2 Nano-needle. (b) Edges of GNs/SnO2 nanocomposites. (c) Graphene sheet and SnO2 Nano-needle. (d) Graphene sheets of few layers.
6. UV-Visible Spectroscopy
Energy emission of grown nanoparticles were analyzed by UV-Vis spectroscopy. Figure 5 shows the UV-Vis spectra of G/SnO2 nanocomposite, GO and SnO2 nanoparticles samples. As excepted, GO exhibits strong band centered at 230 nm, corresponding to π–π* transitions of the aromatic C C band. It is clearly seen that the absorption peak shifted to 250 nm indicating the reduction of GO and that the product is capable of absorbing visible light. These results shows the endorsement synthesis of G/SnO2 nanocomposite. The electronic band gap (Eg) of the SnO2 and G/SnO2 nanocomposite were determined by employing Tauc relationship,

Where is the photon energy, α is the absorption coefficient, and B is constant. The absorption coefficient can be written as α = 2.303A/t, where A is absorbance and t is the thickness of the cuvette used in the measurement. Figure 5 (a) shows the UV-Vis absorption spectra from three different samples where the absorption peaks corresponds to the GO and G/SnO2 clearly differentiate the band gap energies. The vs energy gap Eg shown in Figure 5(b) and the extrapolation of the linear region on the X-axis gives the values of the optical band gap. The values of Eg of the SnO2 is found to be 3.85 eV which is matched with the reported results [14, 15]. The red shift was observed for G/SnO2 nanocomposite and band gap energy was estimated to be 3.66 eV. Reduction of band gap of bare SnO2 nanoparticles by introducing of graphene sheet (a zero band gap system) effectively introduced metastable stages among the valence and conduction bands.
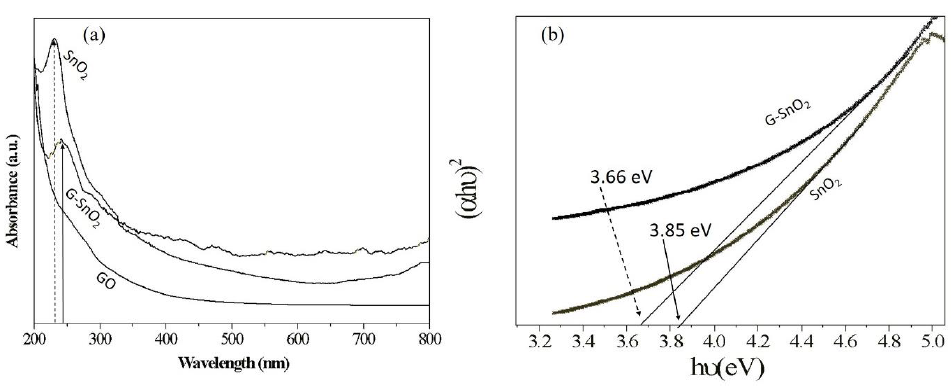
Figure 5: (a) UV-Vis spectrograph of SnO2, GO and G/SnO2 nanocomposite. (b) (αhν)2 vs. Eg plot for bandgap energy calculation.
7. Fourier Transform Infrared (FTIR): Functional Analysis
Figure 6 shows the fingerprint of bonding in the GO, SnO and G/SnO2 nanocomposite systems. We are mainly interested to look the vibrational bonds of formation of graphene from GO when it reduced while it contacted with SnO2 nanoparticles. Peak around 3450 cm-1 is attributed to O-H stretching vibrations of adsorbed water molecules and structural OH groups which exhibits with large intensity in SnO2 nanoparticles and broader in GO due to large oxygen environment but it get reduced to G/SnO2 nanocomposite. The C-O stretching vibration observed around 1080 cm-1 which is not present in the nanocomposite sample which means the formation of G in nanocomposite sample [16] and confirm the adhesion of the graphene to SnO2 nanoparticles as discussed in the previous sections. Moreover, on adding SnO2 into the GO solution, a strong Sn-O-Sn anti-symmetric vibration peak is observed at 585 cm-1 which resemble to bare SnO2 nanoparticle corresponding change in nanocomposite [15]. No bonding confirmation is observed between graphene and SnO2. Further, it is important to see that the peaks of carboxyl group suppressed significantly and a new peak at 1640 cm-1 appears, corresponding to the skeletal vibration of graphene [17].
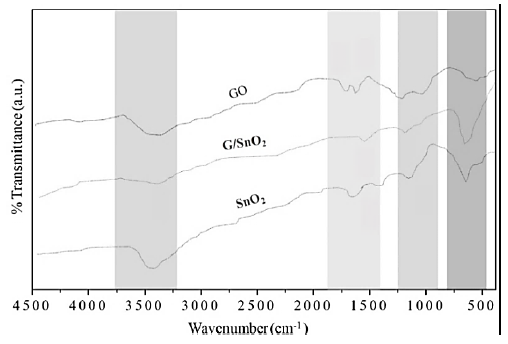
Figure 6: FTIR spectra recorded of GO, SnO2 nanoparticles and G/SnO2 nanocomposite samples.
8. Thermal Analysis: DSC and TGA
The DSC analysis consists in measuring the difference in heat flow between the sample and a reference (inert material) when both are submitted to the same temperature ramp. The DSC plots for both of the samples G/SnO2 and SnO2 in the Figure 7 (right panel) shows their exothermic nature, which results when the samples were heated at a rate of 5ºC/min. From 40ºC to 400ºC in nitrogen gas flowing at a rate of 25ml/min. For SnO2 nanoparticle, the DSC plot gives only one exothermic peak at 290ºC, which indicates change of phase at the temperature. While for G/SnO2 nanocomposite two exothermic peaks exists, one peak correlated to Graphene nanosheets at 70ºC and the peak at 270ºC corresponding to SnO2 nanoparticles. The corresponding change in temperature of nanocomposite on comparing to bare SnO2 nanoparticle also verifies the conformation of the synthesis of G/SnO2 nanocomposite [18]. The thermal properties and the compositions of the as-prepared products were characterized by TGA in air environment. TGA curves of the G/SnO2 nanocomposites and SnO2 nanoparticle are shown in Figure 7 (left panel). An abrupt weight loss occurs from 200ºC to 650ºC, indicating the oxidization of G/SnO2 nanocomposite, and no further mass loss is observed after 650ºC. In the spectrum weight loss show in two patterns, first pattern from 200ºC to 300ºC showing the SnO2 weight loss, mainly caused by its dehydration, which can also be verified through alone SnO2 i.e. SnO2 shows the weight loss in the temperature region 200ºC to 300ºC with 60 weight % and second pattern 350ºC to 650ºC shows the weight loss with 30 weight % of carbon as a result of pyrolysis. The stability of the trace indicates the complete removal of graphene. According to the TGA curves, 53 wt% of SnO2 are coated on the surface of graphene nanosheets.
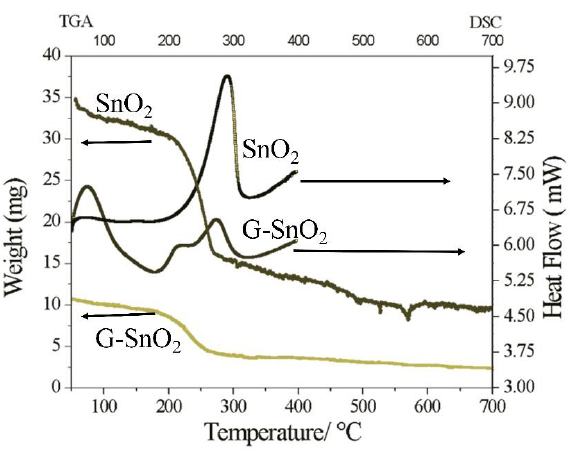
Figure 7: TGA(left panel) and DSC(right panel) of SnO2 and G/SnO2.
9. Frequency Dependent Electrical Properties
9.1 Dielectric constant
The dielectric constant is represented as ε = ε'- jε". The first term is the real part of dielectric constant and describes the stored energy while the second term is the imaginary part of dielectric constant, which describes the dissipated energy. The dielectric constants ε' and ε" of the materials were evaluated by using the relation,
and .

Where is the permittivity of free space, Cp is the capacitance of the specimen, A and t are the flat surface area and thickness of the pallet, respectively. Here represents the dialectic loss. Figure 8 show the real (ε') and imaginary (ε") part of dielectric constant of both the samples. The ε' and ε" values of SnO2 (G/SnO2) were found to be 15-9 (1200-1000) and 12-7(14000-1000), respectively. From figures, it is noticeable that a sudden
decrease in lower frequency regime and become slower at higher frequency. The trend of decrease in the dielectric constant with increasing frequency is due to by dielectric relaxation phenomenon, which tells that the charge carrier localization is not stable and frequency disturbances affect the charge carrier. In other words, a phenomenon of electron-hopping mechanism is also responsible where it is prominent at higher frequency that results in reduction of the dielectric constant [19]. Further, it is seen that the value of ε' decreases faster compared to that of ε". A larger value of ε" in case of G/SnO2 nanocomposite shows the large heat dissipation. Thus, the present nanocomposite exhibits conducting behavior due to presence of graphene nanosheets. Further, the dielectric dispersion curve can also be explained based on Koop’s theory [20], which is based on the Maxwell-Weigner model [21, 22] for the homogeneous double structure. According to this model, a dielectric medium is assumed to be made of well conducting grains that are separated by poorly conducting (or resistive) grain boundaries. Under the application of external electric field, the charge carriers can easily migrate through the grains and accumulated at the grain boundaries. This process can produce large polarization and high dielectric constant. The small conductivity of grain boundary contributes to the high value of dielectric constant at low frequency. The higher value of dielectric constant can also be explained on the basis of interfacial/space charge polarization due to inhomogeneous dielectric structure, i.e. may be porosity and grain structure of nanocomposite. The polarization decreases with the increase in frequency and then reaches a constant value beyond a certain frequency. It is understandably that in an external field the hopping phenomena occurs between graphene & SnO2 and shows the recombination effect of electron and holes which cannot follow the alternating field. The large value of dielectric constant at lower frequency is due to the predominance of the effect like grain boundary defects, presence of oxygen vacancies, etc. Further, the decrease in dielectric constant with frequency is natural because of the fact that any species contributing to polarizability is found to show lagging behind the applied field at higher and higher frequencies.
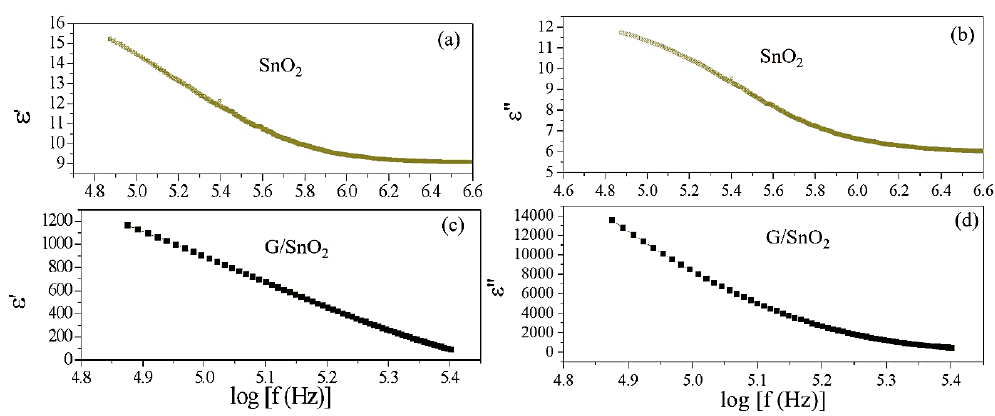
Figure 8: (a), (c), (b) and (d) are the variation of real and imaginary part of the impedance with frequency for SnO2 nanoparticles and G/SnO2 nanocomposite.
9.2 Dielectric losses
Figure 9 shows the SnO2 and G/SnO2 nanocomposite exhibited the frequency dependent dielectric losses. At higher frequency, the losses are constant but large in G/SnO2 nanocomposite as compared to the SnO2 nanoparticles because of the smaller particle size as confirmed form the structural analysis as discussed in the previous section. The high value of dielectric losses at lower frequency may due to the high resistivity caused by grains boundary. The low loss in G/SnO2 nanocomposite as compared to the SnO2 shows the capability of G/SnO2 to use in high frequency device applications.
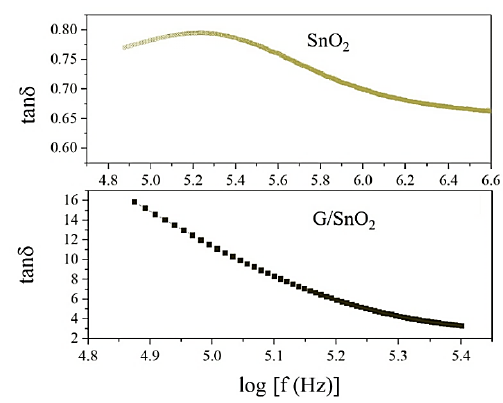
Figure 9: Variation of dielectric losses with frequency.
9.3 AC conductivity
The total conductivity can be explained as,
.
The first term represents the dc conductivity due to the band conduction that is frequency independent and the second term is the pure ac conductivity due to the electron hopping processes. Figure 10 shows the variation in ac conductivity with frequency for SnO2 and G/SnO2 nanocomposite measured at room temperature. The ac conductivity is quite large (more
than one order) in G/SnO2 nanocomposite as compared to the SnO2 nanoparticles. It is due to small particle size of G/SnO2 nanocomposite that comprise graphene ballistic conductivity, less defect and small grain boundary. Due to this, as the frequency increases electron-hoping process increases and shows a sharp increment in the ac conductivity compare the SnO2 nanoparticle attributed to the enhanced electron hopping phenomenon [23].
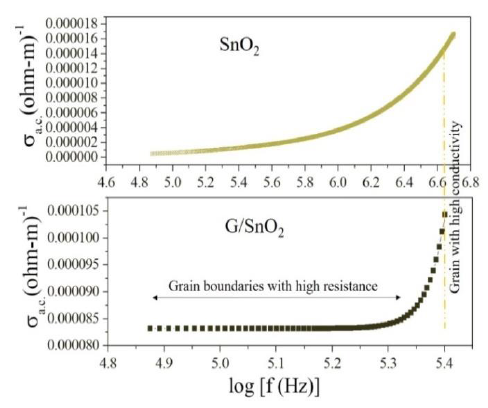
Figure 10: Variation of ac conductivity with frequency.
9.4 Impedance analysis
It is an imperative tool to separate the bulk and grain boundary contribution by from the total conductivity. The impedance spectrum is represented as imaginary (Z") versus real component of impedance (Z’) and known as Nyquist plot [23]. In that, at higher and lower frequencies represent bulk and electrode process, respectively, while that at intermediate frequencies represents grain boundary contribution. For the detailed investigation of the transport properties of as prepared SnO2 nanoparticles and G/SnO2 nanocomposite, the impedance measurement was performed in the frequency range of 75Hz-4 MHz at room temperatures. The complex formalism of the impedance is given by the relation,

The electrical phenomenon due to bulk material, grain boundary and interfacial phenomenon appears in the form of arc of a semicircle, when components of impedance are plotted in a complex argand planes (Nyquist plots) [23]. Figure 11 shows the variation of real and imaginary part of the impedance with frequency for SnO2 nanoparticles and G/SnO2 nanocomposite. It has been clearly visible from the patterns that Z' decreases with the increase in frequency for both the samples (Figure 11(a) and (c)). This reduction with the rise in frequency is due to the increase in ac conductivity with rise in frequency as discussed in the previous section. It may also attributed to high resistivity due to effectiveness of the resistive grain boundaries in the low frequency region and shows independent behavior in the higher frequency region. It may be noticed that the Z' decreases with decreasing particle size.
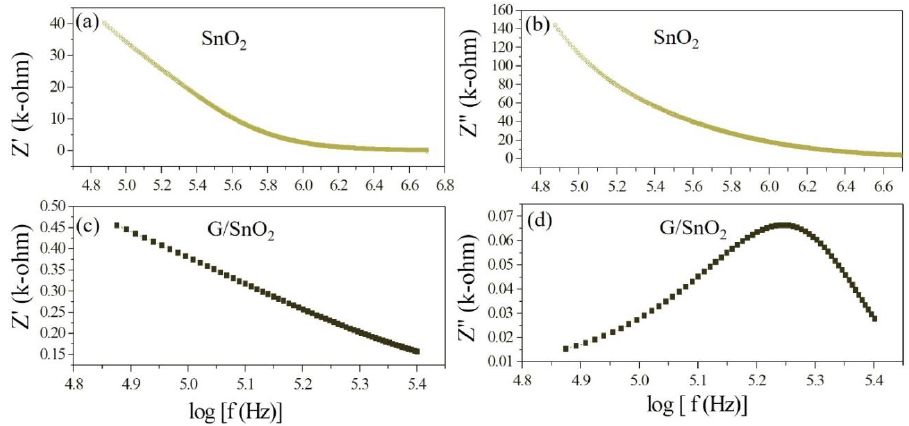
Figure 11: (a) (c) and (b) and (d) are the variation of real and imaginary part of the impedance with frequency for SnO2 nanoparticles and G/SnO2 nanocomposite.
Furthermore, the Z" decreases with the decreasing particle size due to capacitance of grain boundary (Cgb) as shown in the Table 1 below,
|
Sample |
Rgb (Ω ) |
Cgb (nF) |
τgb(×10-6 s) |
|
G/SnO2 Nanocomposite |
0.46284 |
181.58 |
84.0424872 |
|
SnO2 |
1860.9 |
1.1063 |
2058.71367 |
Table 1: Parameters are obtained by analyzing the impedance data on nonlinear least square fit method.
This can be attributed to the fact that Z" is inversely proportional to capacitance by the relation, . Moreover, Z' and Z" are given by the relations,
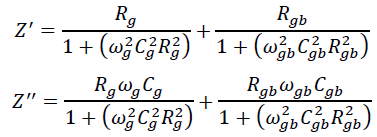
.Where Rg, Rgb, Cg, Cgb are the resistance and capacitance of grain and grain boundary respectively, while ωg and ωgb are the frequencies at the peaks of the circular arc for the grain and grain boundary respectively. The capacitance and the relaxation times (τg, τgb) were calculated for the grain and grain boundary by using the relations, , , , . Grain boundary resistance Rgb increases while the capacitance Cgb decreases with decreasing particle size as indicated in the table 1. This is due to smaller grains imply a larger number of insulating grain boundaries which act as a barrier to the flow of electrons. Smaller grains also imply smaller grain–grain surface contact area and therefore a reduced electron flow. Figure 12 shows the complex impedance plots (Nyquist plot) for the samples SnO2 and G/SnO2 nanocomposite. Generally, the grains are effective in high frequency region while the grain boundaries are effective in low frequency region. The size of the semicircle changes with grain size and the number of grains. The presence of a single semicircular arc obtained at higher frequencies corresponds to electrical conduction by the interior of the bulk grain. The diameter of the semicircle corresponds to the resistance of the grain. Accordingly, the semicircle at high and low frequencies may be assigned to charge transport within the crystallites and a grain boundary effect, respectively [24].
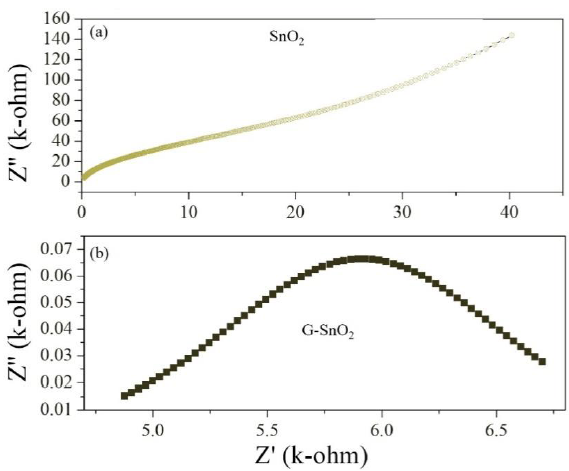
Figure 11: (a) (c) and (b) and (d) are the variation of real and imaginary part of the impedance with frequency for SnO2 nanoparticles and G/SnO2 nanocomposite.
Figure 12: Nyquist plot of SnO2 and G/SnO2.
In general, the grain boundary effect on electrical conductivity may originate from a grain boundary potential barrier or from space charge layers which are depleted in majority charge carriers and which are localized along the grain boundaries [23-25]. However, a low frequency semicircle may also be an artifact caused by porosity, which is known as the constriction. As the particle size decreases, the diameter of the semicircle increases, indicating a reduction of the grain interior resistance. Due to this fact, the single circular arc is being observed in these Cole-Cole plots. Moreover, it can be seen from Figure 12 (Nyquist plot) that total impedance increases with decreasing particle size of the sample which is in well agreement with conductivity analysis.
10. Conclusions
A simple facile eco-friendly Anton-Paar microwave synthesis reactor approach has been utilized for the controlled growth of SnO2 nanoparticles onto graphene layer. X-ray diffractions and scanning electron microscopy analyses revealed the growth of graphene/SnO2 nanocomposite. XRD patterns revealed diffraction peaks corresponding to SnO2, graphene oxide, graphene G/SnO2 nanocomposites. The nanocomposites were successfully synthesized without any impurities. According to the SEM and TEM observation, the uniform distribution of the nano-needles on the graphene surface is demonstrated with average particle size of 3-5 nm extracted. According to the TGA, 53 wt. percentage of SnO2 are coated on the surface of graphene nanosheets. Based on the electrical measurements, the G/SnO2 nanocomposite behave highly conducting as compared to the SnO2 nanoparticles. The G/SnO2 nanocomposite composite showed an enhanced optical property, tuning of band of bare SnO2 nanoparticles. These features with the green synthesis make the G/SnO2 nanocomposites an excellent material for various applications such as research fields such as biosensor, gas sensor, ultracapacitors, and electrochemical analysis.
Acknowledgements
We acknowledge the Centre of Excellence in Materials Science (Nanomaterials), Department of Applied Physics, Z.H. College of Engineering & Technology, Aligarh Muslim University, Aligarh, Uttar Pradesh, India for the financial support for completing the presented work.
Conflicts of Interest
All authors declare no competing interests.
References
- Rao CNR, Sood AK, Subrahmanyam KS, Govindaraj A. Graphene: The new two-dimensional nanomaterial, Angew. Chemie - Int. Ed 48 (2009): 7752-7777.
- Teweldebrhan D, Lau CN, Ghosh S, Balandin AA, Bao W, Calizo I, et al. Superior Thermal Conductivity of Single-Layer Graphene. Nano Lett 8 (2008): 902-907.
- Ge Z, Jin Z, Fan H, Zhao K, Wang L, Shi Z, et al. Fabrication, Mechanical Properties, and Biocompatibility of Graphene-Reinforced Chitosan Composites. Biomacromolecules 11 (2010): 2345-2351.
- Cheng C, Li S, Thomas A, Kotov NA, Haag R. Functional Graphene Nanomaterials Based Architectures: Biointeractions, Fabrications, and Emerging Biological Applications. Chem. Rev 117 (2017): 1826-1914.
- Shen H, Zhang L, Liu M, Zhang Z. Biomedical applications of graphene. Theranostics 2 (2012): 283-294.
- Guo S, Dong S. Graphene nanosheet: Synthesis, molecular engineering, thin film, hybrids, and energy and analytical applications. Chem. Soc. Rev 40 (2011): 2644-2672.
- Yang X, Tu Y, Li L, Shang S, Tao XM. Well-dispersed chitosan/graphene oxide nanocomposites. ACS Appl. Mater. Interfaces 2 (2010): 1707-1713.
- Liang J, Wei W, Zhong D, Yang Q, Li L, Guo L. One-step in situ synthesis of Snow 2 /graphene nanocomposites and its application as an anode material for Li-ion batteries. ACS Appl. Mater. Interfaces. 4 (2012): 454-459.
- Pi S, Zhang X, Cui H, Chen D, Zhang G, Xiao S, et al. Facile Fabrication of Au Nanoparticles/Tin Oxide/Reduced Graphene Oxide Ternary Nanocomposite and Its High-Performance SF6 Decomposition Components Sensing, Front. Chem 7 (2019): 1-13.
- Zhang B, Yu X, Ge C, Dong X, Fang Y, Li Z, et al. Novel 3-D superstructures made up of SnO2@C core-shell nanochains for energy storage applications, Chem. Commun 46 (2010): 9188-9190.
- Li F, Song J, Yang H, Gan S, Zhang Q, Han D, et al. One-step synthesis of graphene/SnO2 nanocomposites and its application in electrochemical supercapacitors, Nanotechnology 20 (2009): 455602.
- Husain S, Rahman F, Ali N, Alvi PA. Nickel Sub-lattice Effects on the Optical Properties of ZnO Nanocrystals, J. Optoelectron. Eng 1 (2013) 28-32.
- Song J, Xu L, Zhou C, Xing R, Dai Q, Liu D, et al., Synthesis of graphene oxide based cuo nanoparticles composite electrode for highly enhanced nonenzymatic glucose detection, ACS Appl. Mater. Interfaces 5 (2013): 12928-12934.
- FJ Arlinghaus. Energy bands in stannic oxide (SnO2). J. Phys. Chem. Solids 35 (1974): 931-935.
- Chetri P, Choudhury A. Investigation of optical properties of SnO2 Phys. E Low-Dimensional Syst. Nanostructures 47 (2013): 257-263.
- Çiplak Z, Yildiz N, Calimli A. Investigation of graphene/Ag nanocomposites synthesis parameters for two different synthesis methods, Fullerenes Nanotub. Carbon Nanostructures 23 (2015): 361-370.
- Si W, Wu X, Zhou J, Guo F, Zhuo S, Cui H, et al. Reduced graphene oxide aerogel with high-rate supercapacitive performance in aqueous electrolytes, Nanoscale Res. Lett 8 (2013): 247.
- Shanmugam M, Jayavel R. Synthesize of Graphene-Tin Oxide Nanocomposite and Its Photocatalytic Properties for the Degradation of Organic Pollutants Under Visible Light. J. Nanosci. Nanotechnol 15 (2015): 7195-7201.
- Zhu J, Wei S, Zhang L, Mao Y, Ryu J, Haldolaarachchige N, et al. Electrical and dielectric properties of polyaniline-Al2O3 nanocomposites derived from various Al2O3 J. Mater. Chem 21 (2011): 3952-3959.
- Koops CG. On the dispersion of resistivity and dielectric constant of some semiconductors at audiofrequencies, Phys. Rev 83 (1951) 121–124.
- Wagner KW. The theory of imperfect dielectrics. Ann. Phys 345 (1913): 817-855.
- Yager WA. The distribution of relaxation times in typical dielectrics. J. Appl. Phys 7 (1936): 434-450.
- Radon A, Lukowiec D, Kremzer M, Mikula J, Wlodarczyk P. Electrical conduction mechanism and dielectric properties of spherical shaped Fe3O4 nanoparticles synthesized by co-precipitation method, Materials (Basel) 11 (2018): 735.
- Mombrú D, Romero M, Faccio R, Tumelero MA, Mombrú AW. Extremely Large Magnetic-Field-Effects on the Impedance Response of TiO2 Quantum Dots. Sci. Rep 9 (2019): 5322.
- Hemalatha KS, Sriprakash G, Ambika Prasad MVN, Damle R, Rukmani K. Temperature dependent dielectric and conductivity studies of polyvinyl alcohol-ZnO nanocomposite films by impedance spectroscopy. J. Appl. Phys 118 (2015): 154103.
