Fast Algorithm for the Determination of the Optimum Filter for Bone SPECT Image Reconstruction
Article Information
Afef houimli1*, Dorra Ben-sellem2
1University of Tunis El Manar, Higher Institute of Medical Technologies of Tunis, Research Laboratory in Biophysics and Medical Technologies LR13ES07, Tunis, 1006, Tunisia
2Université de Tunis El Manar, Institut Salah AZAIEZ
*Corresponding Author: Afef houimli, Université de Tunis El Manar.
Received: 07 January 2024; Accepted: 19 January 2024; Published: 01 January 2024.
Citation: Afef houimli, Dorra Ben-sellem. Fast Algorithm for the Determination of the Optimum Filter for Bone SPECT Image Reconstruction.FortuneJournal of Rheumatology 6 (2024): 08-19.
View / Download Pdf Share at FacebookAbstract
In SPECT, the reconstructed images are strongly affected by poisson noise, poor spatial resolution and bad contrast due to the radioactivity disintegration and procedures acquisition. In this paper, we propose an algorithm to improve the traditional FBP reconstruction and to choose the most suitable technique for bone SPECT image denoising. The proposed approach is composed of two steps. The first one consists of denoising the acquired sinograms using successively eight currently used filters in nuclear medicine: Wiener, Metz, Hamming, Hann, Shepp-Logan, Parzen, Butterworth and Gaussian combined with Butterworth filters. The second step is a simultaneous reconstruction of the axial slices using a new 3D FBP algorithm for each filter. A comparative study of these filters is tested and evaluated on a dataset containing thirty one bone SPECT image. The results show that the difference between these filters is statistically significantly different from each other (p<0.05) and the 3D FBP with the combination between Butterworth and Gaussian provide the best performance. The selected method is compared to three denoising methods. These methods are tested on a Shepp Logan phantom and bone SPECT images. Experimental results show that the 3D FBP reconstruction with the pre-processing combination (Gaussian (Std=0.3) + Butterworth (fc=0.47, ordre=3)) filter is more accurate and robust compared to other methods. It provides the highest performance in term of contrast, SNR, CNR ensuring a shorter processing time. It accelerates the reconstruction, reduces noise and artifacts while preserving detailed features. This approach could be considered as a valuable candidate to enhance the quality of the reconstructed bone SPECT image.
Keywords
Bone SPECT image denoising, Wiener; Metz, Hamming, Hann, Shepp-Logan, Parzen, Butterworth and Gaussian combined with Butterworth filters, 3D FBP reconstruction.
Bone SPECT image denoising articles; Wiener articles; Metz articles; Hamming articles; Hann articles, Shepp-Logan articles; Parzen articles, Butterworth and Gaussian combined with Butterworth filters articles; 3D FBP reconstruction articles.
Bone SPECT image denoising articles Bone SPECT image denoising Research articles Bone SPECT image denoising review articles Bone SPECT image denoising PubMed articles Bone SPECT image denoising PubMed Central articles Bone SPECT image denoising 2023 articles Bone SPECT image denoising 2024 articles Bone SPECT image denoising Scopus articles Bone SPECT image denoising impact factor journals Bone SPECT image denoising Scopus journals Bone SPECT image denoising PubMed journals Bone SPECT image denoising medical journals Bone SPECT image denoising free journals Bone SPECT image denoising best journals Bone SPECT image denoising top journals Bone SPECT image denoising free medical journals Bone SPECT image denoising famous journals Bone SPECT image denoising Google Scholar indexed journals Wiener articles Wiener Research articles Wiener review articles Wiener PubMed articles Wiener PubMed Central articles Wiener 2023 articles Wiener 2024 articles Wiener Scopus articles Wiener impact factor journals Wiener Scopus journals Wiener PubMed journals Wiener medical journals Wiener free journals Wiener best journals Wiener top journals Wiener free medical journals Wiener famous journals Wiener Google Scholar indexed journals Metz articles Metz Research articles Metz review articles Metz PubMed articles Metz PubMed Central articles Metz 2023 articles Metz 2024 articles Metz Scopus articles Metz impact factor journals Metz Scopus journals Metz PubMed journals Metz medical journals Metz free journals Metz best journals Metz top journals Metz free medical journals Metz famous journals Metz Google Scholar indexed journals Hamming articles Hamming Research articles Hamming review articles Hamming PubMed articles Hamming PubMed Central articles Hamming 2023 articles Hamming 2024 articles Hamming Scopus articles Hamming impact factor journals Hamming Scopus journals Hamming PubMed journals Hamming medical journals Hamming free journals Hamming best journals Hamming top journals Hamming free medical journals Hamming famous journals Hamming Google Scholar indexed journals Hann articles Hann Research articles Hann review articles Hann PubMed articles Hann PubMed Central articles Hann 2023 articles Hann 2024 articles Hann Scopus articles Hann impact factor journals Hann Scopus journals Hann PubMed journals Hann medical journals Hann free journals Hann best journals Hann top journals Hann free medical journals Hann famous journals Hann Google Scholar indexed journals Shepp-Logan articles Shepp-Logan Research articles Shepp-Logan review articles Shepp-Logan PubMed articles Shepp-Logan PubMed Central articles Shepp-Logan 2023 articles Shepp-Logan 2024 articles Shepp-Logan Scopus articles Shepp-Logan impact factor journals Shepp-Logan Scopus journals Shepp-Logan PubMed journals Shepp-Logan medical journals Shepp-Logan free journals Shepp-Logan best journals Shepp-Logan top journals Shepp-Logan free medical journals Shepp-Logan famous journals Shepp-Logan Google Scholar indexed journals Parzen articles Parzen Research articles Parzen review articles Parzen PubMed articles Parzen PubMed Central articles Parzen 2023 articles Parzen 2024 articles Parzen Scopus articles Parzen impact factor journals Parzen Scopus journals Parzen PubMed journals Parzen medical journals Parzen free journals Parzen best journals Parzen top journals Parzen free medical journals Parzen famous journals Parzen Google Scholar indexed journals Butterworth and Gaussian combined with Butterworth filters articles Butterworth and Gaussian combined with Butterworth filters Research articles Butterworth and Gaussian combined with Butterworth filters review articles Butterworth and Gaussian combined with Butterworth filters PubMed articles Butterworth and Gaussian combined with Butterworth filters PubMed Central articles Butterworth and Gaussian combined with Butterworth filters 2023 articles Butterworth and Gaussian combined with Butterworth filters 2024 articles Butterworth and Gaussian combined with Butterworth filters Scopus articles Butterworth and Gaussian combined with Butterworth filters impact factor journals Butterworth and Gaussian combined with Butterworth filters Scopus journals Butterworth and Gaussian combined with Butterworth filters PubMed journals Butterworth and Gaussian combined with Butterworth filters medical journals Butterworth and Gaussian combined with Butterworth filters free journals Butterworth and Gaussian combined with Butterworth filters best journals Butterworth and Gaussian combined with Butterworth filters top journals Butterworth and Gaussian combined with Butterworth filters free medical journals Butterworth and Gaussian combined with Butterworth filters famous journals Butterworth and Gaussian combined with Butterworth filters Google Scholar indexed journals 3D FBP reconstruction articles 3D FBP reconstruction Research articles 3D FBP reconstruction review articles 3D FBP reconstruction PubMed articles 3D FBP reconstruction PubMed Central articles 3D FBP reconstruction 2023 articles 3D FBP reconstruction 2024 articles 3D FBP reconstruction Scopus articles 3D FBP reconstruction impact factor journals 3D FBP reconstruction Scopus journals 3D FBP reconstruction PubMed journals 3D FBP reconstruction medical journals 3D FBP reconstruction free journals 3D FBP reconstruction best journals 3D FBP reconstruction top journals 3D FBP reconstruction free medical journals 3D FBP reconstruction famous journals 3D FBP reconstruction Google Scholar indexed journals radioactivity disintegration articles radioactivity disintegration Research articles radioactivity disintegration review articles radioactivity disintegration PubMed articles radioactivity disintegration PubMed Central articles radioactivity disintegration 2023 articles radioactivity disintegration 2024 articles radioactivity disintegration Scopus articles radioactivity disintegration impact factor journals radioactivity disintegration Scopus journals radioactivity disintegration PubMed journals radioactivity disintegration medical journals radioactivity disintegration free journals radioactivity disintegration best journals radioactivity disintegration top journals radioactivity disintegration free medical journals radioactivity disintegration famous journals radioactivity disintegration Google Scholar indexed journals
Article Details
1. Introduction
Single photon emission computed tomography (SPECT) is a non invasive functional imaging modality which enables in vivo examination of organs’ function. SPECT based on the administration to patients of a gamma emitter labeled radiopharmaceutical for diagnostic or therapeutic purpose. The head of detection of the gamma camera is mounted on a frame rotates around the patient to record multiple projections of the radioactive concentration under different angles of view. The projection images are stored on the computer where it will be recombined mathematically for reconstructing either sequences of tomographic slices in 3 directions. This technique allows the doctors to perform an accurate diagnostic of the radiopharmaceutical distribution in any slice of the body. Reconstructive methods are divided into two approaches: analytic and iterative methods. The analytic method, such as Filtered Back-Projection (FBP), is the standard reconstruction algorithm currently used in nuclear medicine tomography because of its facility and speed [1]. Versus the iterative method which requires a longer computational time. The analytic reconstruction method requires sufficient projection data with low noise. However, in practical experiment in nuclear medicine the number of projection sets is limited provoking streak artifacts, inducing more noise, masking same organs, reducing lesion detection and making the obtained images unreadable. To overcome these problems, the data must be filtered prior the back- projection [2]. For de-noising the reconstructed SPECT image, several studies of filtering have been investigated [3, 4]. Many of them proved that the low-pass filters obscure the significance of small lesions, smoothen the details and reduce the sensitivity of the methods [5]. However, the restoration filters increase image contrast, improve lesion detection, amplify the artifacts at certain frequencies and reduce the specificity of the methods [6, 7]. In [8], a comparison made between the FBP reconstruction with Butterworth pre-processing filter and OSEM iterative reconstruction. The previous work demonstrated that the FBP method with a Butterworth filter provides the optimal SPECT image quality. Furthermore, this method is more efficient for standardizing the reconstruction parameter for the head and chest images, but these parameters were more operator-dependent for the abdomen. In [9] M. T. Madsen and al show that the Gaussian filter enhance the contrast and suppress noise in the reconstructed bone SPECT slices.On the other hand, there has been a significant conflict in the selection of the appropriate filter and adjustment of their parameters to individual cases [10, 11]. In the literature, several studies have been proposed to choose the appropriate filter with the best parameters for each region and for each organ. In [12], Alirza S. and al applied the cosine, Hamming, Han, Shepp-Logan and Ram-Lak on the hot region of Carlson phantom SPECT image. They shown that Ram-Lak and Shepp-Logan filters with 0.4 cut-off frequencies improve the perceived image quality of hot region and their detectability.S. Sayed et al. [13] applied a Butterworth filter of order 5 with cut-off frequencies 0.35 and 0.45 cycles.cm−1 on a cylindrical phantom filled with Tc-99m solution. They have demonstrated that the contrast and region’s detectability were improved with the use of 0,45 cycles.cm−1 cut-off frequency.
To summarize, much research demonstrates that the FBP reconstruction, particularly the FBP based on both Gaussian filter and Butterworth filter, provide the best SPECT image quality. Other studies show that the major drawback of this approach is the severity and the extend of the artifact, which makes the denoising process inaccurate and difficult near the hyper fixation activity. In this paper, we continue the research in this area, we use the previous studies results as a starting point and we research on the performance of eight pre-processing widely used filters in nuclear medicine with various parameters, followed by a proposed 3D FBP for improving the reconstruction of a dataset composed of Tc99m-HMDP bone SPECT images, taken from the radiology department of National Oncology Institute”Salah AZAIZE” of TUNIS. First, we investigate the performance and the capability of the following filters to reduce the artifact: Wiener and Metz filters as restoration filters and Hamming, Hann, Shepp-Logan, Parzen, and Butterworth filter as smoothing filters [4]. Then we propose a combination between the contrast enhancement Gaussian filter with the noise reducing Butterworth filter. For each filter various parameters are tested. After that, the pre- processing technique which provides the highest performance is compared to three methods: 3D FBP based on Gaussian filter, 3D FBP based on Butterworth filter and 2D FBP based on Gaussian combined with Butterworth filter. Furthermore, the quantitative values of the proposed method are compared to those of some previous study methods. The rest of this paper is structured as follows: section 2 describes the used methods, section 3 presents the obtained results and compares the used reconstruction methods, section 4 presents the discussion and in section 5 the paper concludes this work.
2. Materials and Methods
The method proposed to accelerate the reconstruction as well as improve the quality of reconstructed images includes two steps: pre-processing step using different filtering conditions and a reconstruction step based on a ramp 3D Back Projection implementation. Figure 1.Shows the block diagram of the proposed algorithm.
In the following, we will present our approach in details by focusing on the following steps.
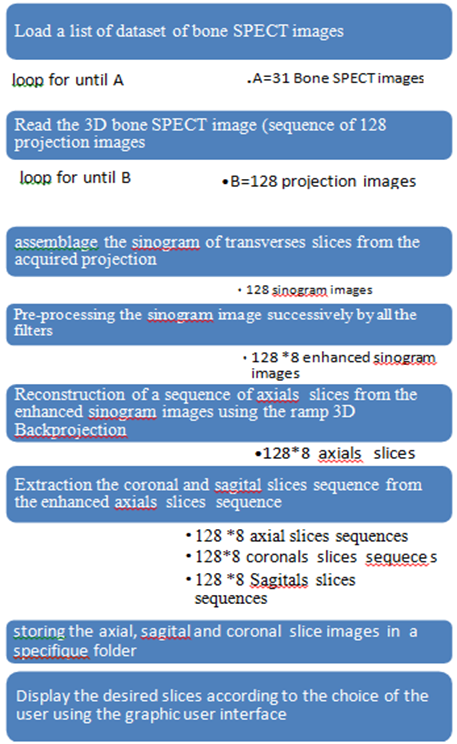
Figure 1:Proposed algorithm
2.1 Sinogram images denoising
The acquired tomosintigraphic projection images suffer from bad resolution and fluctuations due to the Poisson distribution [14]. In order to choose the optimum filter for bone SPECT image that reduces efficiently the noise as much as possible preserving the image details, we applied eight widely used filters in nuclear medicine, in frequency domain, as shown in figure 2, which is used in[10] for one filter:
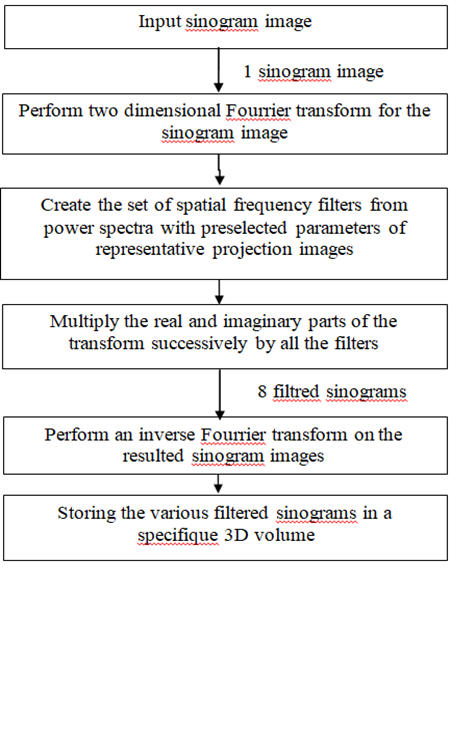
Figure 2: Block diagram of SPECT preprocessing method
Filtration: To cover the whole range of variables, a total of 137 filtering conditions were considered as shownin Table1.
Table 1:Filtering conditions
2.2 Modified 3D Back projection Reconstruction
The 2D Back projection reconstruction using ramp filter assures the retro-projection of one image. So, the reconstruction of a 3D image requires a longer time. To accelerate the reconstruction step, we propose a 3D Back projection based on ramp filter, where we convert the input sequence of sinogram images to a 3D matrix. Then we apply the 3D Back projection. Therefore, a 3D axial slice image is reconstructed simultaneously and not successively in the interactive calculation, contrariwise to the 2D Back projection reconstruction (slice-by-slice).
2.3 Optimization of the proposed method for bone SPECT image reconstruction
To select the optimum filter for bone SPECT image reconstruction, We analyzed eighty anonymous bone SPECT images taken from the radiology department of National Oncology Institute ”Salah AZAIZE” of TUNIS, generated by a double-head gamma camera- CT model with a parallel collimator, equipped with a low dose CT scan characterized by a low energy and ultra-high-resolution characteristics. All patients are injected standard doses according to EANM guidelines. The bone scan tomographies are performed according to protocols (32 projections per head and twenty seconds per projection). The protocols are standardized for all patients. This dataset acquired during the period from the 6th July 2015 to the 29th June 2016 for diagnosis of metastasis in oncology patients. We chose thirty one (31) studies with a significant abnormal increased uptake on bone scan, 9 males and 21females aged between 45 and 75 years. Each DICOM image is a sequence of 128 projections (720°) and a 128*128 matrix with a pixel spacing equal to 4.795 mm. After reconstruction, we calculated some criteria including mean contrast, mean signal to noise ratio (SNR) andmean contrast to noise ratio (CNR) of all the slices containing the lesion for each exam as follows:
Two experts in nuclear medicine draw the ROIs through the hyperfuctionning bone locations from the normal bone to abnormal region and further in the transverse views of bone image, using MATLAB (R2013a) environment as shown in Figure 3. These regions are the same for all the filtered slices that contain the lesion foreach exam (in our case, the number of slice for each exam didn’t exceed 13 slices).
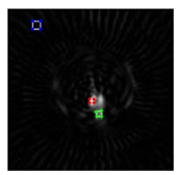
Figure 3: The measurements of maximum count in normal region of bone (Nmax(Normal)) (green outline), miximum count in hyperfuctionning bone (Nmax (abnormal)) (red outline),minimum count in background or bone hole region (Nmin (background)) (blue outline) for transverse slice filtred by butterworth filter(fc=0.4,order=4).
For each patient and for each filter, the number of SPECT transverse slices containing bone lesions multiplied by the total number of combinations (305 combinations) was analysed. We measured the maximum count in normal bone, maximum count in hyperfuctionning bone and minimum count in the background for each slice. Then, by using all of these measurements, we calculated the contrast, signal to noise ratio (SNR) and Contrast-to-noise Ratio (CNR) as follows:
Contrast = (N max (abnormal) - N max (Normal) ) / N max(Normal) (1)
SNR = (Nmin(abnormal) -Nmax(Normal) )/ Nmin(background) (2)
CNR =(Nmax(abnormal) -Nmax(Normal) )/s (3)
Where Nmax(Normal) is the maximum count in normal bone, Nmax(abnormal) is the maximum count in hyperfuctionning bone, Nmin(background) is the minimum count in the background and σ is the standarddeviation in the background.
Quantitatively, the optimum filter has the highest value of contrast, CNR and SNR. So, the first purpose of thiswork is to select the best combination of parameters for each filter. The second purpose is to choose the bestfilter. We evaluate the performance of each combination of filter parameters. In fact, the combination of filter parameters that provides the highest CNR, SNR and contrast as the most suitable for bone SPECT image de- noising. Numerical results on all the patients’ data revealed that maximum contrast, CNR and SNR could be obtained using the Butterworth (cutoff 0.2-0.7,order 3-9), Hanning (cutoff 0.15 - 0.5), Hamming (cutoff 0.15 - 0.5), Shepp-Logan (cutoff 0.23-0.48),Parzen(cutoff 0.15-0.5), Metz (order=9.5,FWHM=7.8mm), Wiener (order=9.5,SNR=11) and Butterworth(cutoff=0.47,order=3) combined with Gaussian (Std=0.3), that’s why we use the statistical Analysis. We performed Jarque-Bera test for testing whether the series were normally distributed, this test is based on the sample skewness and sample kurtosis.The asymmetry coefficient (coefficient of skewness) is near 0 for most values. As for the kurtosis (kurtosis coefficient), we noted that all distributions had a coefficient greater than 3, so they are leptokurtic (the presence of fat tails). From the pointof view of statistics Jarque-Bera normality, assumption can accept some values during our study.
Performing One-Way ANOVA-test, significant difference (P<0.05) was observed between contrasts, SNR and CNR generated by Butterworth, Hamming, Hann, Shepp-Logan, Parzen, Metz, Wiener and Butterworth combined with Gaussian filters as shown in Table 2 and 3.
Table 2: Comparison of filters in mean contrast for eight filters
|
Filter |
N |
Mean contrast |
df |
F |
Sig |
|
Butterworth (cutoff=0.2,order=7) |
31 |
6.9 |
Between groups=447 Withen groups=1952 Total=2399 |
1.554 |
0 |
|
Butterworth(cutoff=0.5, order=3) |
31 |
6.85 |
|||
|
Butterworth(cutoff=0.57, order=5) |
31 |
6.8 |
|||
|
Butterworth(cutoff=0.2, |
31 |
5.54 |
|||
|
order=9) |
|||||
|
Hamming(cutoff=0.27) |
31 |
5.43 |
|||
|
Hann(cutoff=0.3) |
31 |
6 |
|||
|
Shepp-Logan(cutoff=0.15) |
31 |
5.81 |
|||
|
Parzen(cutoff=0.2) |
31 |
6,00 |
|||
|
Metz(order=9.5, FWHM=7.8mm) |
31 |
1.352 |
|||
|
Wiener(order=9.5, SNR=11) |
31 |
1.265 |
|||
|
Butterworth(cutoff=0.47,order=3)+Gaussian (Std=0.3) |
31 |
6.96 |
Table 3: Comparison of filters in mean SNRs for eight filters
|
Filter |
N |
Mean SNR(db) |
df |
F |
Sig |
||
|
Butterworth (cutoff=0.2,order=7) |
31 |
60.32 |
Between groups=7 Withen groups=278 Total=285 |
2.613 |
0.01 |
||
|
Butterworth(cutoff=0.5, order=3) |
31 |
61.05 |
|||||
|
Butterworth(cutoff=0.57, order=5) |
31 |
60.5 |
|||||
|
Butterworth(cutoff=0.2, order=9) |
31 |
61.54 |
|||||
|
Hamming(cutoff=0.27) |
31 |
60.63 |
|||||
|
Hann(cutoff=0.3) |
31 |
58.06 |
|||||
|
Shepp-Logan(cutoff=0.15) |
31 |
56.61 |
|||||
|
Parzen(cutoff=0.2) |
31 |
58.6 |
|||||
|
Metz(order=9.5, FWHM=7.8mm) |
31 |
54.13 |
|||||
|
Wiener(order=9.5, SNR=11) |
31 |
33.06 |
|||||
|
Butterworth(cutoff=0.47,order=3)+Gaussian (Std=0.3) |
31 |
61.02 |
|||||
Table 4: Comparison of filters in mean CNRs for eight filters
|
Filter |
N |
Mean CNR(db) |
df |
F |
Sig |
|
Butterworth (cutoff=0.2,order=7) |
31 |
50.58 |
Between groups=10 Withen groups=330 Total=340 |
1.529 |
0 |
|
Butterworth(cutoff=0.5, order=3) |
31 |
58.48 |
|||
|
Butterworth(cutoff=0.57, order=5) |
31 |
57.8 |
|||
|
Butterworth(cutoff=0.2, |
31 |
57.86 |
|||
|
order=9) |
|||||
|
Hamming(cutoff=0.27) |
31 |
41.43 |
|||
|
Hann(cutoff=0.3) |
31 |
41.96 |
|||
|
Shepp-Logan(cutoff=0.15) |
31 |
25.81 |
|||
|
Parzen(cutoff=0.2) |
31 |
15 |
|||
|
Metz(order=9.5, FWHM=7.8mm) |
31 |
41.35 |
|||
|
Wiener(order=9.5, SNR=11) |
31 |
21.26 |
|||
|
Butterworth(cutoff=0.47,order=3)+Gaussian (Std=0.3) |
31 |
60.96 |
Quantitavely: Table 2, Table3 and Table4 summarizes the mean contrast, the mean SNRs and the mean CNRs calculated from SPECT axial slices with different combination of filter parameters(305*nombre of SPECT transverse slices containing lesion).
These results showed that these performances are the lowest for Metz and Wiener, best for the smoothingfilters as Hamming, Hanning, Shepp-Logan, Parzen and Butterworth.
Gaussian (Std=0.3) combined with Butterworth (cutoff=0.47, order=3) filters provide the maximumperformance in the group.
Qualitatively: Figure 6 shows that:
The smoothing filters had a quite similar effect on image quality; these filters attenuate the details and the shape of the image. The streaking artifacts persisted in the filtered image.
Metz and Wiener filters have characteristics of both the smoothing and blurring compensation. The Wiener filter is a linear filter widely used to reduce the noise in scintigraphic images. The aim of this filter is to find an image with a minimum mean squared error between the original image and the restored image. The smoothingpower of Metz filter increases as the system spread function flattens. In our study, these filters provides blurred image with streaking artifacts.
Butterworth filter combined with Gaussian provides the best quality of image; this combination reduces the streaking artifacts with the best degree of accuracy and minimal degradation of the boundaries of the regionsand the small detail.
Clinical sensitivity and specificity evaluation:Two expert radiologists evaluated the filtered slices by the proposed method. The possible outcomes of thisevaluation were calculated as follows: true positive=10, true negative=1, false positive=2 and false negative=17. From these values, the corresponding sensitivity= 90, 9 %, Specificity=89, 5 %, positive predictivevalue (PPV) =83,3%, negative predictive value (NPV) =94,4% and accuracy=90%. This results show that the proposed method was able to provide potentially useful information for the interpretation of bone SPECT images. Furthermore, the clinical sensitivity and specificity diagnosis in Bone SPECT images rise if SNR and Contrast increase.
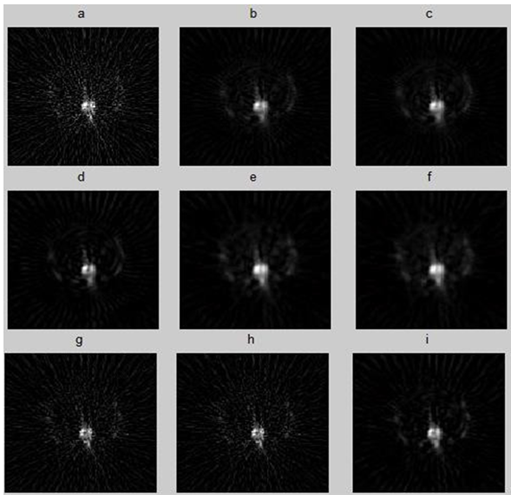
Figure 4: Transverse slice filtred with the best parameter of each filter: Ram-Lak, Hann, Hamming, Butterworth, Wiener, Metz, Parzen, Shepp-logan, Butterworth +Gaussian filter.
3. Results
In this section, we present a description of the phantom and bone SPECT database obtained from radiology department of National Oncology Institute ”Salah AZAIZE” of TUNIS. Then we present the different results and performance analysis of the proposed method.
3.1 Database description
Three dimensional shepp-loganphantoms: To evaluate the methods in term of robustness of reconstruction and image quality, we tested the different algorithms on a 3D Shepp-Logan phantom. The distribution of projection data assumed to be generated by 128 angular views (distributed in the range of 180 degrees), figure 9 present the projection 64 of this phantom.For simulation study of the different reconstruction methods, we added the Poisson noise to the projection data. Then, we tested various parameters to select the best one for each method.
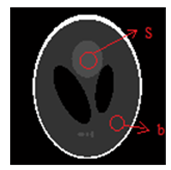
Figure 5:Shepp-Logan phantom (Projection 64)
The performance of the different method was evaluated from the following objective criteria:
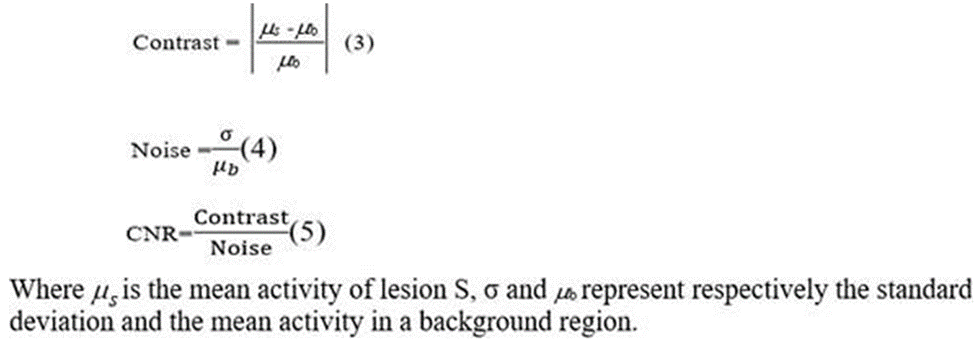
Patients studies: For each method, we calculated the value of SNR defined in equation (1), the contrast defined in equation (2) and the time of execution for 31 bone SPECT exam.
3.2 Shepp–Logan phantom Result
To illustrate the phases presented in Section 2, Figure 6 shows the different results of the proposed method at gray level images. Column (A) depicts the original phantom image, column (B) presents the original projection, column(C) presents the noisy projection, column (D) presents the noisy sinogram, column (E) presents thefilteredsinogram and column (F) shows the reconstructed phantom image.
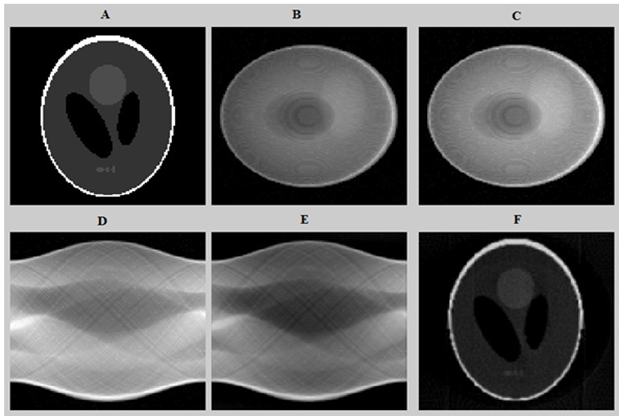
Figure 6: the different results of the proposed method. (A) original phantom image, (B) original projection, (C) the noisy projection including 6% Poisson distributed background, (D) the noisy sinogram, (E) the filtered sinogram and (F) the reconstructed phantom image.
3.3 Data results
In this part, the sequence of transversal, coronal and sagittal slices of bone images filtered by the best Filter (Butterworth (cutoff=0.47, order=3)+Gaussian (Std=0.3)) are presente in Figure 7, Figure 8 and Figure 9.
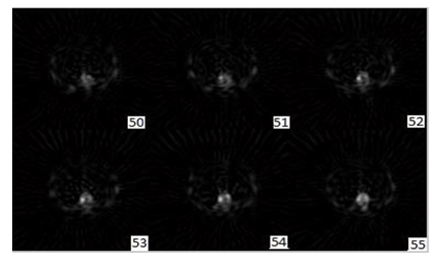
Figure 7: Output transaxial slice (Gaussian +Butterworth) pre filtering reconstruction with 1-pixel thick slice, displayed from cranial (slice50) to caudal (slice55).
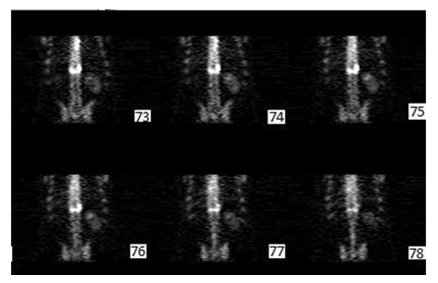
Figure 8:Output Coronal slices (Gaussian + Butterworth) pre filtering reconstructed from transaxial slice data with 1pixel thick slices. Displayed from posterior (slice73) to anterior (slice78).
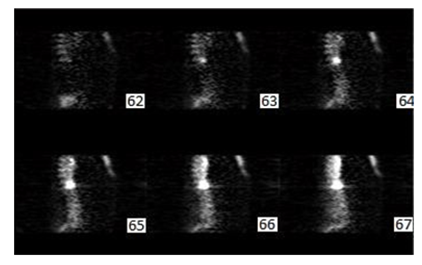
Figure 9: Output Sagittal slices (Gaussian + Butterworth) pre filtering reconstructed from transaxial slice data that were 1pixels thick. Displayed from right (slice62), to left (slice67).
3.4 Performance evaluation
To evaluate the performance of the proposed method, we compared qualitatively and quantitatively the capability of our proposed method to 3D FBP based on Butterworth filter, 3D FBP based on Gaussian filter and2D FBP based on Gaussian filter combined with Butterworth. First, a comparison is made between different performances for different parameters for the same technique. Then, a comparison is performed between the four methods with best parameters.
The filtering methods:To obtain the best parameters of each algorithm; we applied the different method with different combinations of parameters on the sequence of sinograms as listed in table4. In the case of 3d FBP, the sequence of filtered sinograms were converted to 3 dimensional matrix, and back projected simultaneously by the proposed 3D back- projection. Whereas, in the case of 2D FBP, the sequence of filtered sinograms were successively back- projected by a direct inversion of the radon transform. Then, we quantified the resulted transverse slices (we choose one slice contain the lesion for each exam).The sequence of sonograms multiplied successively by the Gaussian filter. Table5 lists the different standard deviations used. We tested and compared the performance of each one. Theobtained results shows that the Gaussian filter with (std= 0.4) provide the highest performance.
3D FBP based on Butterworth filter:The sequence of sinograms multiplied successively by the Butterworth filter. We tested the different parameters and we compared the performance of the resulted slices. The obtainedresults show that the Butterworth filter with (fc= 0.57 and =9) provide the highest performance.
3D FBP based on Gaussian filter combined with Butterworth filter: We tested the different combinations as listed in Table 5 for 3D FBP based on Gaussian combined with Butterworth filter and compared the performance of the resulted slice, the obtained results show that the Butterworth filter (fc=0.47 and order=3) combined with Gaussian filter (STD=0.3)) provide the highest performance.
2D FBP based on Gaussian filter combined with Butterworth.
We tested the different combinations as listed in Table 5 for 2D FBP based on Gaussian combined with Butterworth filter. Then we compared the performance of each resulted slice. The obtained results show that the Butterworth filter (fc=0.47, order=3) combined with Gaussian filter (std= 0.3) provides the highest performance.
Table 5: Different combinations used in this study
|
Method |
Fc |
Order |
std |
|
2Dand3DFBPbasedon Gaussian filter combined with butterworth filter |
0.15,0.2,0.25,0.3,0.35,0.4,0.5 |
2 |
0.15, 0.2, 1.25, 0.3, 0.4, 0.5 |
|
0.15,0.2,0.25,0.3,0.35,0.4,0.5 |
3 |
||
|
0.15,0.2,0.25,0.3,0.35,0.4,0.5 |
5 |
||
|
0.15,0.2,0.25,0.3,0.35,0.4,0.5 |
9 |
||
|
3D FBP based on Butterworth filter |
0.15,0.2,0.25,0.3,0.35,0.4,0.5 |
2 |
|
|
0.15,0.2,0.25,0.3,0.35,0.4,0.5 |
3 |
||
|
0.15,0.2,0.25,0.3,0.35,0.4,0.5 |
5 |
||
|
0.15, 0.2, 0.25, 0.3, 0.35, 0.4, 0.5 |
9 |
||
|
3D FBP based on Gaussian filter |
0.15, 0.2, 1.25, 0.3, 0.4, 0.5 |
The reconstructed Shepp-Logan image obtained from various algorithms (G) the original Shepp-Logan phantom image (Figure 10.G), 3DFBP based on Gaussian filter(std=0.3)(Figure 12.H), 3DFBP based on Butterworth filter(fc= 0.57 and n=9) (Figure 10.K), 2D FBP based on Gaussian filter combined with butterworth filter(std=0.3, order=8, fc=4.8)(Figure 10.L), and 3DFBP based on Gaussian filter combined with butterworth filter(std=0.3, order=9, fc=4.8)(Figure 10.M).

Figure 10:Shepp-Logan phantom image reconstructed from noisy projection including 6% Poisson noise distributed background events using different methods.
Figure 11 illustrates the same profile of the corresponding Shepp-Logan image of one slice for the different reconstructed methods.
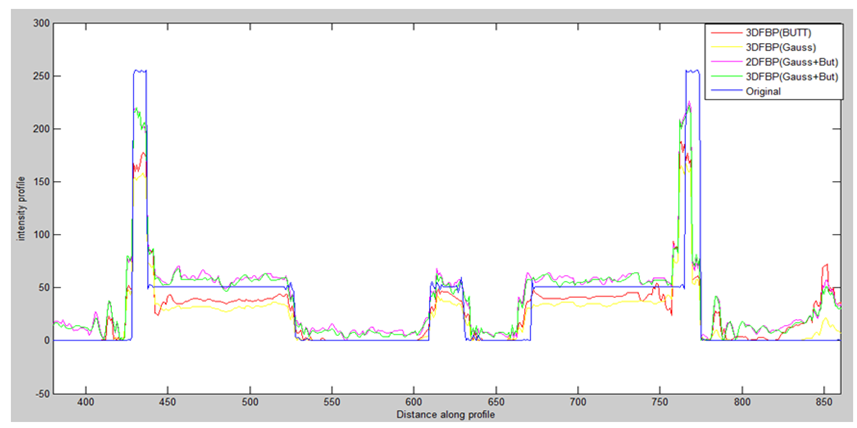
Figure 11:Line profile at row81of the noisy projection reconstructed respectively by:2DFBP based on Gaussian filter combined with butterworth filter, 3DFBP based on Gaussian filter, 3DFBP based on Butterworth filter and Proposed method, applied on noiseless projection.
For each method we calculated the mean value of contrast, SNR and time of execution for 31 bone SPECT exam as described in equations 1 and 2. Table 6, 7 and 8 shows the highlight of our contribution in term of contrast, SNR and processing time for 31 exams.
Table 6: Comparison between the reconstruction methods in mean Contrast
|
Method |
N |
Mean Contrast(dB) |
ddl |
F |
Sig |
|
2D FBP based on Gaussian combined with Butterworth filter |
31 |
0,5348 |
Between groups=3 Within groups=120 Total=123 |
3,47 |
0,00 |
|
3D FBP based on Gaussian filter |
31 |
0,4113 |
|||
|
3D FBP based on Butterworth filter |
31 |
0,5287 |
|||
|
Proposed method |
31 |
0,7555 |
Table 7: Comparison between the reconstruction methods in mean SNR
|
Method |
N |
Mean SNR(dB) |
ddl |
F |
Sig |
|
2D FBP based on Gaussian combined with Butterworth filter |
31 |
61.193 |
Betweengroups=3 Within groups=120 Total=123 |
19,302 |
0,00 |
|
5 |
|||||
|
3D FBP based on Gaussian filter |
31 |
55,483 |
|||
|
9 |
|||||
|
3D FBP based on Butterworth filter |
31 |
48,250 |
|||
|
3 |
|||||
|
Proposed method |
31 |
6,35,161 |
Table 8: Comparison between the reconstruction methods in mean execution time
|
Method |
N |
Mean execution time |
ddl |
F |
Sig |
|
2D FBP based on Gaussian combined with Butterworth filter |
31 |
8.405 |
Between groups=3 Within groups=120 Total=123 |
2,416 |
0,02 |
|
3D FBP based on Gaussian filter |
31 |
6.245 |
|||
|
3D FBP based on Butterworth filter |
31 |
6.2048 |
|||
|
Proposed method |
31 |
5.6439 |
4. Discussion
In this paper, we proposed a novel 3D FBP reconstruction algorithm with eight currently used filters in nuclear medicine. This method presents a novel solution that allows the doctors to apply these filters successively on all the exams and reconstruct the slices in a shorter time than the conventional direct inversion of the radon transform. The main concern of this paper was to find the best filter, based on FPB method of reconstruction, which improve the bone SPECT image quality and reduce efficiently the generated streaking artifacts. This study shows that the 3D FBP reconstruction based on the contrast enhancement Gaussian (Std=0.3) combined with the noise reducing Butterworth (cutoff=0.47, order=3) method outperformed the other methods in terms of SNR, resolution and contrast, gain in reconstruction time, best reduction of artifacts and improved lesion detection of bone SPECT images reconstruction. To validate qualitatively and quantitatively the efficiency of our proposed algorithm, we compared in first step, the used pre–reconstruction filter with seven other filters. For a qualitative assessment, the filtered bone slices obtained from cited filters are illustrated in figure4. These results agree with Inayatullah S. S and al [13] studies which showed that the Butterworth filter return themore efficiency anatomic details than other filters. In contrast to some reports in the literature, we found that Metz and Shepp-Logan filters provide the worst image quality in term of resolution and contrast. In addition, these filters return images tainted both by a pixelization effect and by a smoothing. We observe that the combination between Gaussian filter and Butterworth filter provide the best image quality in terms of noise and streaking artifacts reduction and preservation of the small details and the limit of region. Unlike the hanning, Hamming, Parzen and wiener filters which degrade the image quality by smoothing transitions and attenuating details which making delicate the extraction and the location of the contours.
Indeed, the results of these filters contain a more artifacts in the form of oscillations which can be visually unpleasant. For quantitative assessment, the means SNRs, the means CNRs and the means contrasts are computed for each method. Table2 shows that the means contrast of our proposed method is significantly superior to the other filter, this is explained by the efficiency of our proposed method to reduce the noisy artifact. Table 3 demonstrates that the proposed algorithm provides the highest means SNR values comparedwith the other filters which means that the coupling between Gaussian and Butterworth pre-reconstruction filtering succeeds to compromise between the poison noise reducing and the signaldetail preservation.
Table4 shows that the proposed algorithm provides the highest means CNR values compared with the other filters which means that the combination between Gaussian and Butterworth pre-reconstruction filtering succeeds to reduce the noisy artifacts. In second step, a comparison was made between the proposed technique and the 3D FBP based on Gaussian filter method and a 2D FBP based on Gaussian with Butterworth filter method both applied on a Shepp-Logan phantom image and a bone SPECT database. For a qualitative assessment, figure10 represent the reconstructed Shepp-Logan images obtained from noisy projection using different method of reconstruction. This figure indicates that the proposed method allows the preservation of the original structure during the reconstruction by removing noise and conserving contrast. In fact, we can see that the reconstructed Shepp-Logan phantom image with the proposed method is the most similar to the original one. Furthermore, figure 10 shows that the 3D FBP based on Gaussian combined with Butterworth filter provides an improvement in the spatial resolution of the bone SPECT image. In fact, unlike the conventional 2D FBP where the slices are reconstructed successively in the interactive computation, the 3D FBP uses the full information content of the reconstruction volume which provides an accurate reconstruction of the distribution of the activity on the slice. Compared with our proposed technique, the 3D FBP based on the Gaussian filter method appears much noisy, which attenuate the detail by giving a blur effect on the edges and making delicate the extraction and the location of the contours. However, our proposed technique ensures good poison noise suppression with an accuracy preservation of the limit of region.
Quantitatively, Table5 shows the CNR and the reconstruction time of the different reconstruction methods applied on a Shepp-Logan phantom image. The value of these metrics favored the proposed method which demonstrates the efficiency of our proposed algorithm in reduction of noisy artefacts. Morover, Table 5 shows that the proposed approach requires a shorter time of execution compared to other methods. Figure 11 illustrates the same profile of the corresponding Shepp-Logan image of one slice for the different reconstruction methods. The result shows that the profile resulting from the proposed method is closer to the original profile than the other methods, which demonstrate the better preserves of the edges by removing noise, conserving contrast, while smoothing the region. Indeed, it is clear from Tables 6 and 7 that the SNR and the contrast of our proposed method, tested on another 30 bone SPECT exam, is significantly higher than those in 2D FBP based on Gaussian withButterworth filter, 3D FBP based on Gaussian and 3D FBP based on Butterworth for all the patient groups, which demonstrates the efficiency of our proposed algorithm in preservation of resolution and contrast, reduction of noisy artifacts and accuracy detection of lesion. From Table 8, we note that the processing time of our proposed approach is lower than the 2D FBP based on Gaussian combined with Butterworth filter due to the simultaneous reconstruction of slices. The 3D FBP based on Gaussian requires also a shorter time for processing, but still longer than our approach. To conclude, we can confirm that the proposed method achieve better result than the other methods in the enhancement of the quality of bone SPECT image reconstruction.
Conclusion
Filtered back projection reconstruction is the most currently used in nuclear medicine tomography and remains the standard for all the reconstruction algorithms. The aim of this paper was to choose the best de-noising filter for the tomography bone SPECT image reconstruction. Firstly, we applied a novel 3D FBP reconstruction algorithm with eight preprocessing filters on a dataset containing thirty one bone SPECT exams. Then, we evaluated their performance on the transverse slices. From the qualitative and quantitative comparative study that has been carried out, the 3D FBP based on Gaussian combined with Butterworth filter is the most efficient denoising method which can provide a notable gain in term of contrast, SNR, CNR and time of computation.
Moreover, it can remove the noise from images with the best degree of accuracy and reduce the artifact without degradation of the contours and the small detail. Finally, it is possible to conclude that this approach is applicable to improve the quality of bone SPECT images reconstruction. In our future research we intend to concentrate on the preprocessing step of the proposed technique, more tests will be needed to enhance the quality of the tomography bone SPECT image reconstruction and devoid completely of artifacts.
Key points:
Question: Any filter in nuclear medicine is the optimal for image reconstruction for Bone SPECT imaging?
Pertinent findings: In a cohort study comparing the quality of the reconstructed image, for bone SPECT imaging, filtered by eight currently used filters in nuclear medicine. Each filter combined with a proposed fast reconstruction algorithm is tested and evaluated on a dataset containing thirty one bone SPECT image. The results show that the difference between these filters is statistically significant different from each other (p<0.05) and the 3D FBP with the combination between Butterworth and Gaussian provide the best performance in term of noise and artifacts reduction, with detailed features preservation and gain of reconstruction time.
Implications for patient care: The streaking artifacts generated with the FBP reconstruction is reduced using the proposed method, more tests will be needed to enhance the quality of the tomography reconstruction and devoid completely the artifacts in bone SPECT imaging.
References
- Sadremomtaz, P Taherparvar. The influence of filters on the SPECT image of Carlson phantom, J.Biomedical Science and Engineering 6(2013): 291-297.
- A Sadremomtaz , PTaherparvar. Quantitative and Qualitative Evaluations of Defect Images in Different Regions of Myocardial Phantom under Implementation of Various Filters in SPECT, Indian Journal of Scienceand Technology 8 (2015): 1-13.
- Gunes, I Sarikaya, TOzkan, et al. Detection efficiency of different bone SPECT processing protocols for the diagnosis of “spina bifida”, Journal of Nuclear Biology and Medicine 37(1993): 49-52.
- Lyra , APloussi. Filtering in SPECT Image Reconstruction, International Journal of Biomedical Imaging 2011 (2011): 1-14.
- M Wheat, GMCurrie. A Comparison of strategies for summing gated myocardial perfusion SPECT: are false negatives a potential problem?, Internet J Cardiol 4(2007): 1-26.
- AKing, DT Long, BA Brill. SPECT volume quantitation: Influence of spatial resolution, source size and shape, and voxel size, Med Phys18(1991): 1016-1024.
- E Fakhri, I Buvat, HTBenali,et al. Relative impact of scatter, collimator response, attenuation, and finite spatial resolution corrections in cardiac SPECT, J Nucl Med 41(2000): 1400-1408.
- Massaro, S Cittadin, F Rossi, et al. Reconstruction Parameters for 111In-Pentetreotide SPECT: Variability with Respect to Body Weight and Body Region” Journal of nuclear medicine technology 35(2007):237-241.
- T Madsen and C H Park. Enhancement of SPECT Images by Fourier Filtering the Projection Image Set, J NuclMed 26(1985): 395-402.
- Filter choice for reconstruct tomography. Nucl Med Commun 15(1994): 857-859.
- Rajabi, GS Pant. Optimum filtration for time-activity curves in nuclear medicine, Nucl Med Commun 21(2000):823-828.
- Alireza S. and Payvand T. ” The influence of filters on the SPECT image of Carlson phantom” J. Biomedical Science and Engineering, 2013, 6, 291-297
- Inayatullah S S, Nor Syahirah M N. ” Effect of Cut-Off Frequency of Butterworth Filter on Detectability and Contrast of Hot and Cold Regions in Tc-99m SPECT” International Journal of Medical Physics, Clinical Engineering and Radiation Oncology 5(2016): 100-109.
- Khlifa N. , Gribaa N. , Mbazaa I. , Hamrouni K. ”Image denoising using Wavelet : Apowerful tool to overcome some limitations in nuclear imaging” Hindawi Publishing Corporation International Journal of Biomedical Imaging Volume 2009.
