Estimation of the Reproduction Number for COVID-19 Based on Latest Vaccination Results and the Timing for Herd-Immunity: Prospect for 2021
Article Information
Steven Suan Zhu1,* and Enahoro Iboi2
1School of Engineering and Applied Science, Computer Science, Washington University, St. Louis, MO 63130 USA
2Department of Mathematics, Spelman College, Atlanta, GA 30314 USA
*Corresponding author: Steven Suan Zhu, School of Engineering and Applied Science, Computer Science, Washington University, St. Louis, MO 63130 USA.
Received: 24 February 2022; Accepted: 03 March 2022; Published: 18 March 2022
Citation: Steven Suan Zhu and Enahoro Iboi. Estimation of the Reproduction Number for COVID-19 Based on Latest Vaccination Results and the Timing for Herd-Immunity: Prospect for 2021. Fortune Journal of Health Sciences 5 (2022): 159-181
View / Download Pdf Share at FacebookAbstract
This study examined four countries Israel, United States, United Kingdom, and Serbia and presents their possible vaccination trajectories into 2021. We found that populations in all the four countries are relaxing and taking the advantage of the benefit of an increasingly immunized community hence, experiencing a rising phase of Rc(t). The United States is of particular concern, due to its fast rising Rc(t) in comparison to other countries, potentially generating another wave of infection. Due to aggressive vaccination program, continued implementation of restrictive measures, or both, in all countries we analyzed, presents a cautiously optimistic outlook at controlling the pandemic toward the latter part of 2021. We also found that despite a significant fraction of the population in selected countries being immunized, no countries other than Israel has its Rc(t) reached its intrinsic R0 value. Based on our proposed methodology for deriving R0, our prediction shows that srael’s indigenous COVID-19 daily R0 is approximately 2.2 based on its latest data.
Keywords
COVID-19, Control Reproduction Number, Vaccination, Efficacy, First Dose, Second Dose, Endemic Equilibrium, Herd immunity, Vaccination Matrix
Article Details
1. Introduction
When COVID-19 Pandemic Struck the world in late December 2019, organizations, companies, and governments raced for the development of vaccine against the disease. Throughout 2020, more than a few dozens of vaccines were under development. Toward the fall of 2020, several vaccines entered the late phase of clinical trial III [1].
Then, Russia became the first nation to put its self-developed Sputnik V vaccine into usage domestically [2]. On December 2, 2020, the United Kingdom (UK) gave regulatory approval for Pfizer–BioNTech vaccine, [3, 4] becoming the first country in the Western world to approve the use of any COVID-19 vaccine on humans. By end of 2020, many countries including the United States (US) and the European Union (EU) have authorized or approved the Pfizer-BioNTech vaccine [5]. Bahrain and the United Arab Emirates (UAE) granted emergency marketing authorization for BBIBP-CorV, manufactured by Sinopharm from China [6, 7]. Moderna which is the first RNA vaccine was approved in the US in late December 2020 [8]. By the beginning of 2021, a significant number of countries around the world has at least implemented some vaccination delivery program to its citizens. Among them, several countries such as Israel, Seychelles, UAE, US, UK, Chile, and Serbia stood out from the rest with rapid and ambitious vaccination strategies.
The objective of this study is to use the rich available vaccination data accumulated during the early months of 2021 from the aforementioned countries to gain better understanding of the effectiveness of the vaccines at curbing the pandemic and human behavioral changes in response to the vaccine. Israel was selected since it lead others in terms of vaccination administration on its citizens. US was also selected due to its absolute population and infection size, UK and Serbia are included since they are the most aggressive countries in terms of its vaccination program in Europe. We will put our theoretical model to test with real world data, and make predictions about the progression of the pandemics in the presence of vaccinations, the timing of herd immunity, and ultimately estimate the R0 value of COVID-19 infection. Many mathematical models have been proposed for modeling COVID-19 and its subsequent vaccination program (see for instance [9,10,11,12,13,14,15,16,17,18,19,20]). In general, epidemic models broadly explore the evolution of disease processes over time, and explore patterns and correlations in data using regressions and time series analysis. Epidemic models are divided into deterministic, stochastic, network, and agent based. Models described as continuous in time uses differential equations (compartmental models), while discrete-time models uses the difference equations [19,18,20].
In our study, we are adopting a hybrid modeling approach, involving dynamic and statistical modeling. We use statistical regression to derive the time dependent Rc(t), which is the R0 value change in response to the implementation of control measures to account for the gradual refinement in, or improvement of, these control measures. We found, based on earlier works with fairly good approximation, despite the non-autonomous chara-cteristics of time dependence of parameters such as Rc related to the implementation of control measures [21], can be worked around without devolving into the intricate inner working interactions by the simple assumption, that a momentum is gained so that the cooperation and change of behaviors between the citizens and the governments is maintained once quarantine isolation measures takes in place [22]. As a result, a measure tends to be enforced in place steadily for a long period of time rather than dynamically changes on a weekly or even daily basis [22]. In a sense, it is the same assumption used in economic theory, that one can assume the participants are rational players act cautiously based on their assessment of the situation at the time. Therefore, the trend observed from the extrapolation from historical time series can be applied for future predictions. We adopt a deterministic discrete-time model using difference equations in units of day to predict the epidemic progression of each country through simulation. No stochastic model is necessary since all countries under study has a population size of at least 7 million.
In our previous papers [23,24,25,26,27], we have outlined this deterministic model for viral infection and its instantiation for COVID-19 in particular. The final infection ratio within any given population without any artificial intervention and have shown that the final infection ratio in a natural, non-interfered pandemic must fall within a specified lower and upper bound given by  where R0 is the intrinsic R0 value of the disease. We also outlined that all pandemic progression can be summarized within 4 possible scenarios:
- Fixed R0 + fixed cumulative vaccination V(t), minimal lockdown measures and no vaccinations,
- Variable Rc(t) + fixed cumulative vaccination V(t), lockdown measures with no vaccinations,
- Fixed R0 + variable cumulative vaccination V(t), minimal lockdown measures but with constant vaccination rates
- Variable Rc(t) + variable cumulative vaccination V(t), lockdown measures and constant vaccination rates.
This study focus on the last scenario since we found that in all countries we analyzed, the pandemic falls under the last scenario, that is, variable Rc(t) + variable cumulative vaccination V(t). The remainder of the work in this paper is organized as follows. Section 2 outlines the statistical method for deriving Rc(t) and the construction of deterministic discrete-time model using difference equations in units of day, and the statistical derivation of R0 based on known Rc(t), susceptible ratio S(t), and daily observed infection Id(t). Section 3 outlines pandemic projections for Israel, the US, UK, and Serbia. Section 4 and 5 outlines discussions and conclusions regarding the model.
2. Materials and Methods
2.1 Derivation of the control Rc(t) and the construction of deterministic, recursive, discrete-time simulation model
The immunity ratio within the entire region of interest will now be derived. Let be the total population of our region of interest and I(t) be the cumulative number of infections observed on day t. Let V1 (t - t€) be the cumulative population that received at least one dose by day t and V2 (t - t€) be the cumulative population that received 2 doses, where t is the current day. The parameter € represent the delay of the onset of antibodies after immunization, so that the effective immunized population at the current day observed always correlate with cumulative immunized population size at an earlier date. Let e1 be the efficacy for inducing antibodies based immunity with 1 dosage, and e2 is the efficacy for inducing antibodies based immunity with 2 dosages so that e2=e1+ (1-e1) e1
The immunity ratio E (t) within the entire population can be computed based on the following equation:

We denote V1d(t) to be the daily vaccination number, which is the difference between the cumulative number
of vaccinations on any consecutive days. Hence,

Similarly, let Id (t) represent the daily new infections, then

The control reproduction number Rc (t) which is defined as the daily rate of change in the number of new infections observed divided by the ratio of those who remains susceptible is given by

Using the 7 days moving average Id(t) instead of 1 day to derive the daily rate of change to smooth the cyclic fluctuations observed in COVID-19 cases,[28] equation 2.5 becomes

Based on the historical time series of Rc (t), which can be expressed as:

we find the best fit (polynomial or linear fit) that best extrapolate future trends as:

which generalize Rc(t) into a closed form by incorporating the past and projecting into the future.
The simulation will be carried out using the following recursive equation:
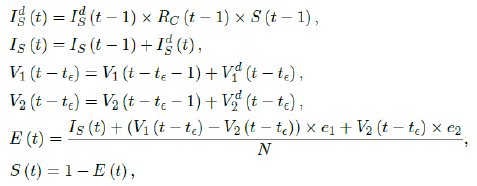
where the daily infection Ids(t) is first computed for the simulated results based on previous day’s infection and the latest change on control Rc(t-1) as well as the remaining number of susceptible. Then the cumulative number of infected IS(t) with Ids(t) are updated. Next, the cumulative vaccination number V1(t-t∈) and V2 (t-t&isin) are updated with daily vaccination increase. Further, the current effective immunization ratio E (t) is updated. Finally, the remaining susceptible ratio is obtained from E (t).
2.2 Derivation of Intrinsic R0 from Rc(t), S(t), and daily infection Id(t)
For a disease such as COVID-19, we do not know the upper bound of R0 and there is no guarantee that it can be derived even when 100% immunity is achieved. To see why, we define the first day when vaccinations are introduced as tF and the last day when vaccinations are completed as tL, so that all days of t falls within tF < t < tL, then imagining that dosages are administered at a certain rate Vd (t), infection are introduced at a certain rate Id (t), and the control Rc(t) is also rising at a certain rate. So the controlled endemic equilibrium is:

That is, the inverse of the remaining susceptible population ratio, and 0 < S(t) < 1. The remaining susceptible population ratio is expressed as:

When the controlled endemic equilibrium brought by  exceeds the Rc(t) rate at all times tF < t < tL, the entire population becomes immunized before its behavior returned to complete normalcy, so that:

In the most extreme case, all vaccinations are delivered instantly to all populations while the entire population was under a complete lockdown with a daily control Rc < 1 as:

When the society returned to normalcy, no additional daily Rc can be observed since no additional cases are reported. In fact, no additional cases can be observed even before tL is reached. Therefore, the final derived R0 < 1 based on Rc. Nevertheless, in general, full vaccinations are achieved after a period of time. During this time, control Rc steadily rises but yet to reach its intrinsic value R0. As a result, at the end of vaccination, one can only predict that R0 > Rc. When vaccination program lasts long enough so that there is enough time for Rc (t) reaching its intrinsic ceiling value of R0. Then it can be observed based on the discrepancy between the projected path and the actual path. We define that there exists a time t0 in which tF < t0 < tL, so that any time t occurs later than t0 as t > t0, we have:

That is, the observed daily infection RC values starts to fall below the expected continually rising Rc (t) curve. In other words, Rc (t) is no longer increasing and the intrinsic R0 value is reached. We can also detect such change by:

That is, the number of reported infections starts to fall below the number predicted for a continually rising Rc (t) curve. Where Ids(t - 1) is the recursively simulated/expected infection numbers on day t - 1, the product with Rc (t - 1) × I (t - 1) yields the recursively simulated/expected infection numbers on day t as Ids(t). The earliest date in which the intrinsic R0 can be derived is then t = t0:

But one should able to derive R0 for any t > t0 and certainly we have:

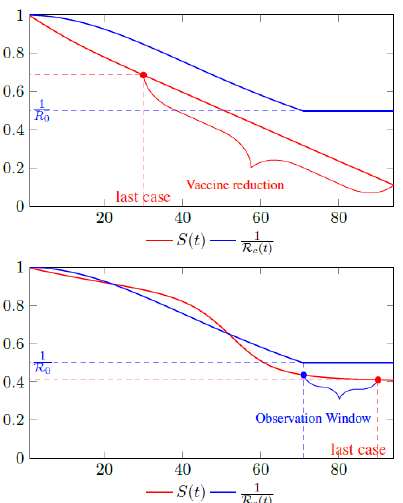
Figure 2.1 shows a model simulation, with a Rc (t) = 0:0002t2 + 1, and an intrinsic R0 = 2 and initial seed infection size = 40 and total population of 10000, both graph shows the endemic equilibrium required by Rc(t) and the remaining susceptible ratio S(t) at any given time. In the top graph, vaccination at a rate of 90 daily is fast enough so that the last infection is observed well before Rc(t) returned to its intrinsic endemic equilibrium 1 R0. As a result, the remaining susceptible ratio is reduced solely by vaccination and true R0 cannot be obtained due to an absence of observable infection. In the bottom graph, vaccination at a rate of 5 daily is slow enough so that the last infection occurs well after Rc (t) returned to its intrinsic endemic equilibrium 1 R0. As a result, there exists an observation window to confirm the true value of R0.
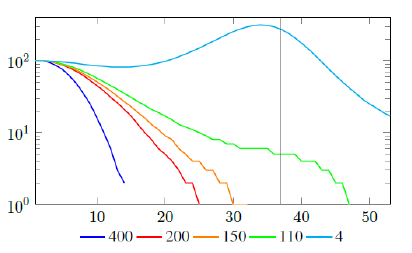
Figure 2.2 shows a model simulation, with a Rc (t) = 0:00077t2 + 1, and an intrinsic R0 = 2 and initial seed size =100, and from left to right: Vd (t) = 400, Vd (t) = 200, Vd (t) = 150, Vd (t) = 110, and Vd (t) = 4, so each day 400, 200, 150, 110, and 4 people vaccinated so immediately removed from remaining susceptible respectively. the final daily infection number (t) is displayed by calendar days. The gray line indicates that given enough time t > t0 = 37, the rising Rc (t) has returned the control Rc back to R0. Only under Vd (t) = 110, and Vd (t) = 4, vaccination scheme was slow enough so that R0 can be effectively derived based on non-zero values of infections. Under cases Vd (t) = 400, Vd (t) = 200, and Vd (t) = 150, zero infections are reported before the rising Rc(t) has returned the control Rc back to R0. Therefore, aggressive vaccination results in last infection occurs before Rc(t) returned to itsR0 value. Since Rc values can be derived only based on daily infection changes, once zero infection is reached, there is no way to know the true R0 of the disease. Under those scenarios, Rc (tL) < R0.
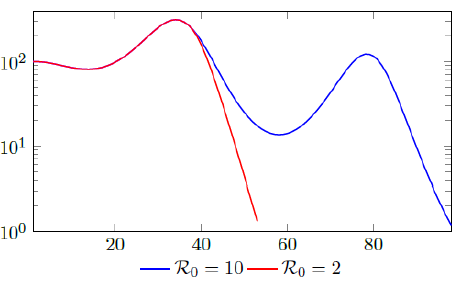
Figure 2.3 shows the final daily infection number Ids(t) based on vc (t) curves, one is capped at intrinsic R0 = 2 and the other is capped at intrinsic R0 = 10, the one capped at higher R0 experienced 2 waves of infection as rising Rc (t) repeatedly exceeds Vd0(t). We also show that there exists a t0 = 38, for which tF < t0 < tL, and Id (t) < Ids(t) in which we assume that the Rc(t) curve capped at R0 = 2 represents Id (t), and the other is capped at intrinsic R0 = 10 represents Ids(t), despite the fact that both are Ids(t).
Of course, our assumption is based on the fact that once lockdown measures are implemented in place, its removal is always smooth and gradually in reality, corresponding to smooth, steadily rising nth degree polynomial without any discontinuities. In fact, a steadily rising nth degree polynomial Rc(t) can render > 1 waves of infections as it returns to complete normalcy if Rc(t) exceeds the vaccination rate Vd (t) at all times.
3. Result
3.1 Israel Projections
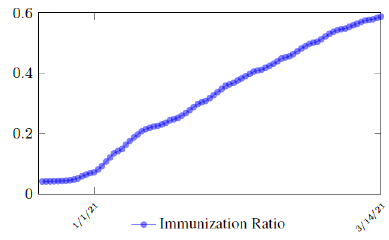
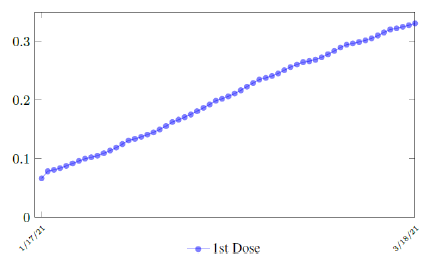
Israel uses Pfizer vaccine, with vaccine efficacy after the first dose to be e1 = 0:76 and e2 = 0:9464 to be the efficacy after the second dose, total population N = 9053000, and I(t) = 796465 [29, 30, 31]. We obtain both time series for V1 (t - t∈) and V2 (t - t∈), where t is March 5, 2021, and t∈= 8 [32]. Hence, the immunity ratio curve for Israel is depicted in Figure 3.1. It is worth mentioning that the current weighted immunity achieved for Israel have just exceeded 50%.
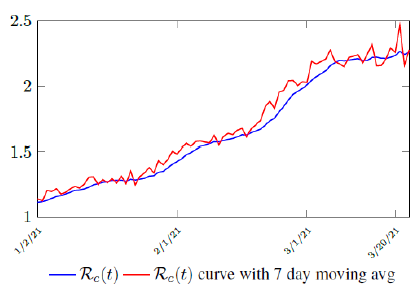
Figure 3.2 shows the final control reproduction number Rc(t) curve is a rising one, indicating that Israel, since the start of the vaccination, is experiencing the rising phase of a Rc(t) fluctuating cycle, which is justified since the population is relaxing too soon also and taking the advantage of the benefit of an increasingly immunized community.
It has a best fit of (when excluding data since March 2, 2021 because Rc(t) has finally peaked):
Rc(t) = 0:0002386t1:9783 + 1:1521
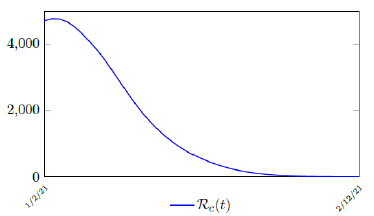
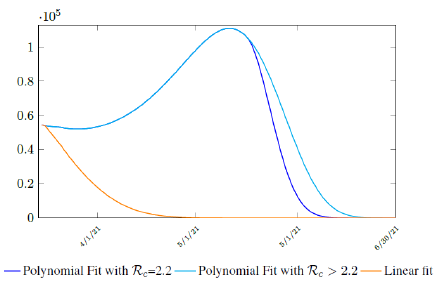
It is worth noting that the fit is an approximation of the final control reproduction number Rc(t) observed. Predictions can certainly deviates from reality, but it is forgivable as long as it is within the range of error of tolerance. The value of the intercept in equation (3.1) is the initial control reproduction number Rc for Israel at the beginning of vaccination program. In fact, if the same public health measures were continually maintained and respected, Our result shows that Israel could have seen the last COVID-19 case on February 12, 2021 (Figure 3.3).As we have assumed in our previous work with fixed Rc(t). [33] Although under such scenario, the border should remain closed since herd immunity is not yet achieved despite zero indigenous infections. Based on Israel’s data, we know that COVID-19 variant strain has an intrinsic daily R0 value of at least > 2:2, since the COVID-19 control Rc value has arisen to 2.2 on the latest day of observation.
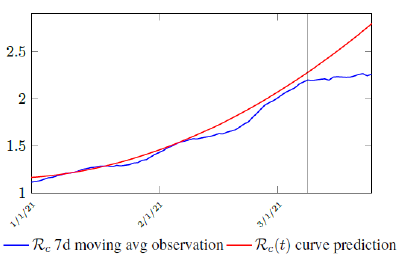
Based on Israel’s data, we cautiously conclude that COVID-19 variant strain has an intrinsic daily R0 value of 2.2, since the COVID-19 control Rc value has arisen to 2.2 since March 2, 2020 and no longer increase despite a continued relaxation of measures and starts to fall short from our Rc(t) projection in magnitudes as we never seen before (Figure 3.4).
Figure 3.4: Observations starts to fall short from our Rc (t) projection. Previous observations had also fall short from Rc (t) projections, however, the gap has been much smaller, furthermore, the moving average was still increasing and not as a plateau as we observed now. The plateau starts at 3/8/21 indicated by the gray vertical divider.
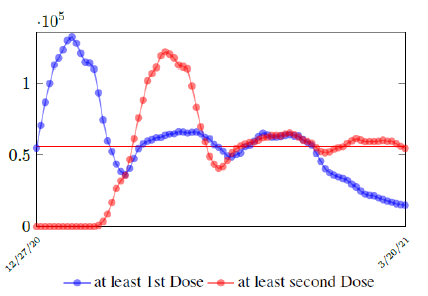
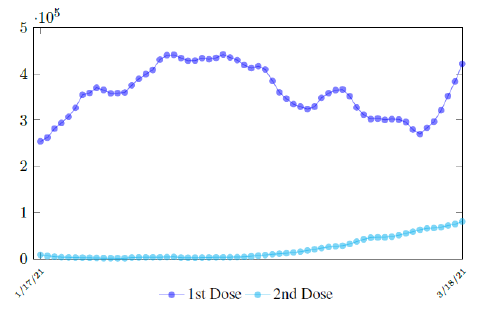
In this case, we are lucky that the intrinsic R0 value can be measured, in which the vaccination program lasts long enough so that there is enough time for Rc (t) reaching its intrinsic ceiling value of R0 (but it may not always be the case). In fact, if the prediction holds, Israel will report its last case by early April, so the end of time window for prediction is just 3 weeks away. In order to extrapolate future trend, we need compute the vaccination rate (t) for 1 dose and vaccination rate (t) for 2 doses (Figure 3.5). Based on the past 1 month, no particular daily increase in single or double dose administration is observed [32]. Notice that by taking the 7 day moving average, one observes a 22 day delay between 1st dose and the second dose administration.
As a result, we simply take the average dose administered during the month of February 2021 for single and double doses as the indicator for the vaccination rate of the future. So we have:

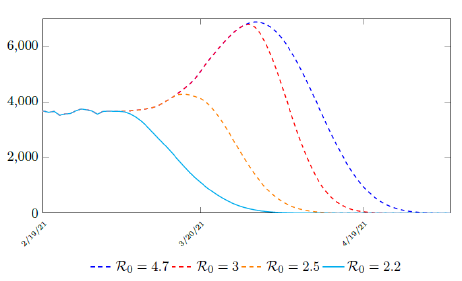
where the average dosage delivered for both 1st and second dose are identical except with a time delay. So we have Israel’s predictions in the upcoming months, the first simulation is assuming that the intrinsic R0 > Rc (tL). According to the simulation, when the last case is reported on April 29, of 2021, the final Rc (tL) = 4:1. Based on our earlier discussion, if there exists t0 in which tF < t0 < tL that the intrinsic R0 is reached, then the predicted results for Israel would follow the other curves assuming R0 = 2:5 and R0 = 3 (Figure 3.6). The final R0 shall only be determined based upcoming results, for which we have to patiently wait for now.
Figure 3.6: Israel predictions, left to right: R0 = 2:2, R0 = 2:5, R0 = 3:0, and R0 = 4:7. Its most likely that R0 = 2:2. Other trajectories given higher possible R0 is also shown. Notice that even for R0 = 2:2 trajectory is somewhat higher than the actual number of infection observed. This is reasonable since the curve is based on 7 day moving average.
3.2 United states Projections
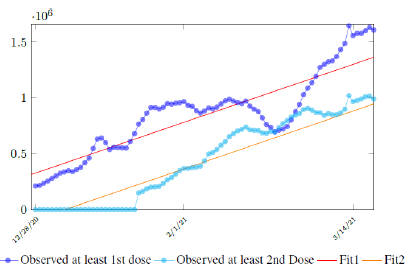
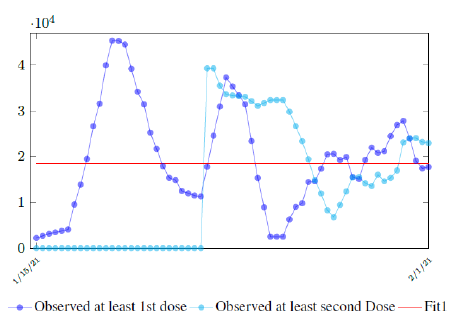
Figure 3.7 depicts the 7 day moving average on the daily vaccination for at least a single and double dosages administered in United States [34].
We perform a linear fit for 1st dose given by

where the intercept 314070 is an over-estimation for vaccination administered record starting on Dec 28, 2020 and the second dose given by

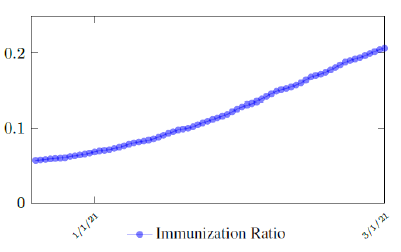
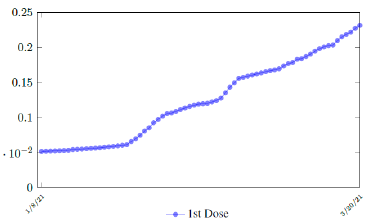
which is not the best linear fit with least R2, however, the idea behind such fit is simple. That is, there is a 1 month delay between all those had 1st dose and the second dose. Other linear fits with lower R2 leads to higher slopes and eventually overtake the daily increase of those had at least 1 dose, which is logically impossible. We then compute E (t) and derived the immunization ratio of US as shown in Figure 3.8:
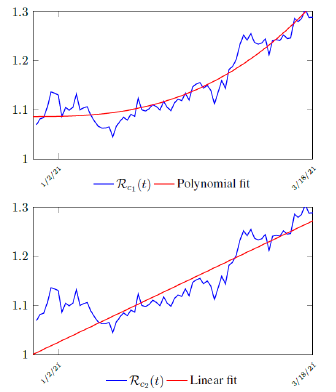
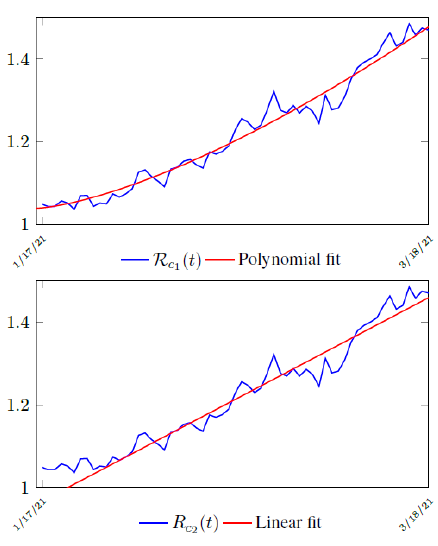
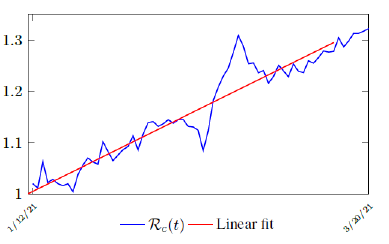
Figure 3.9 shows that the final Rc(t) curve is a rising one, indicating that US, since the start of the vaccination, is experiencing the rising phase of a Rc(t) fluctuating cycle, which is justified since the population is relaxing and taking the advantage of the benefit of an increasingly immunized community
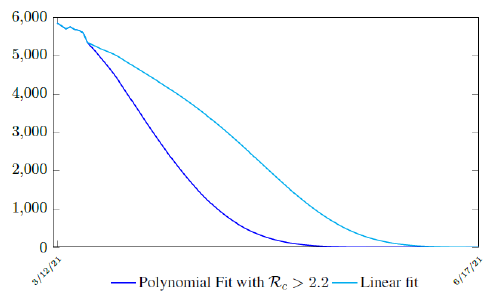
We perform 2 fits for US, a polynomial and linear fit:

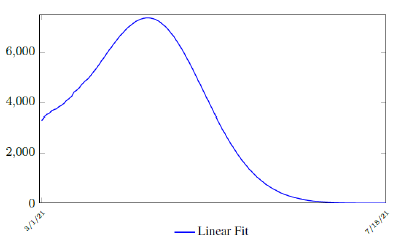
where the intercept 1:0828 and 1 is the assumed initial control Rc value of US at the beginning of vaccination program. Along with Rc(t), we run the recursive simulation S(t). We find that depending on the Rc(t) curve, and assuming R0 > 2:2, another surge of infection is imminent if the rising trend follows Rc1(t). The vaccination rate will be too slow to catch up with the relaxation of human behaviors returning to normalcy, despite daily vaccination increase at a linear rate. With an initial infection size of 30,081,657 on March 14, 2021, additional infection of 6,101,698 and cumulative effective vaccination size of 243,095,373 yields a cumulative effective immunization ratio E(t) = 0:867 on June 30, 2021 when Rc(t) = 3:427.
Assuming R0 = 2:2, another surge still ensues but with somewhat faster decline, then additional infection of 5,624,152 and cumulative effective vaccination size of 216,944,672 yields a cumulative effective immunization ratio E(t) = 0:784 on Jun 19, 2021 when Rc(t) = 2:2. If the rising trend follows Rc2(t), one should observe a steady decreases of cases with a linear gradual return to normalcy with no additional surge and rebound. In that case, the last case is reported on May 15, 2021 when Rc(t) = 1:495 with additional infection of 706,952 and cumulative effective vaccination size of 143,813,093 yields a cumulative effective immunization ratio E(t) = 0:542.
In all scenarios, zero additional cases are reported well before tL, the assumed last day of total vaccination delivery is made when E (tL) < 1. If human collective behavior changes in response to zero infection case achieved, and assuming that

That is, the endemic equilibrium is still higher than the cumulative effective immunization ratio achieved, then it is inevitable resurgence ensues with the imports of overseas cases, and a sudden discontinuity of positive jump on the Rc(t) over a short period of time. As a result, vaccination delivery must be continued and restrictive measures respected even if zero cases are reported. Under Rc1(t) with a cumulative effective immunization ratio E(t) = 0:867 and assuming in the worst case scenario in which R0 ! 1, then another 16 days of vaccination is required:

where t = 161 is the number of days passed since Dec 27, 2020 when zero case is reported. That is, the pandemic ends in the US by July 16, 2021 if citizens collectively continue to respect measures in place and very gradually restores to normalcy even well after the last case is reported in June 30, 2021. Under Rc2(t) scenario, which results a cumulative effective immunization ratio E(t) = 0:542 when the last case is reported in May 15, then another 64 days of vaccination is required:

where t = 115 is the number of days passed since Dec 27, 2020 when zero case is reported. That is, the pandemic officially ends in the US by July 18, 2021 when Rc2(t) = 1:717 if citizens collectively continue to respect measures in place and very gradually restores to normalcy even well after the last case is reported in May 15, 2021. Only when one assumes that Rc1(t) with a cumulative effective immunization ratio E(t) = 0:784 and assuming R0 = 2:2, 14 and  , then normalcy can be immediately restored as:

where t = 150 is the number of days passed since Dec 27, 2020 when zero case is reported. That is, the pandemic ends in the US by June 19, 2021. Although, in this case, sporadic new imported cases can still be reported and causes local spread and quickly terminates without creating resurgence. The analysis shows that the battle against COVID-19 in US is no easier than 2020, a chance of resurgence is not only possible but possibly imminent unless people collectively remain cautious throughout the year despite a continually implemented vaccination program on a daily bases. That is, the administration of vaccine and even zero reported cases is by no means of a sign of relaxation and anxiety of returning to a complete normalcy, as long as the effective immunization ratio E (t) < 1 and R0 value remains inconclusive.
3.3 United Kingdom Projections
During the month of March 2021, no particular daily increase in single dose administration is observed in UK (Figure 3.11) [35]. For the second dose, there is an increasing trend, but we shall conservatively assume that the trend will simply flat out. More interestingly, UK second dose does not follow the trend typically observed in other nations where the second dose administration typically follows the 1st dose with a 2 to 3 weeks delay.
As a result, we simply take the average daily dose administered during late January to early March 2021 for single dose and average daily dose administered during the last 2 weeks of late February and early March 2021 for double doses as the indicator for the vaccination rate of the future. So we have:

We then compute E (t) and derived the immunization ratio of UK as given in Figure 3.12
We perform 2 fits for UK, a polynomial and linear fit:

where the intercept 1:03 is the initial control Rc value of UK at the beginning of vaccination program (Figure 3.13). Along with Rc (t), we run the recursive simulation S (t). We find that depending on the Rc (t) curve, and assuming R0 > 2:2, no additional surge of infection is observed if the rising trend follows Rc1 (t). The vaccination rate is faster than the relaxation rate of human behaviors returning to normalcy. With an initial infection size of 4,285,684 on 3/19/21, [36, 37] additional infection of 183,799 and cumulative effective vaccination size of 38,115,429 yields a cumulative effective immunization ratio E (t) = 0:735 on June 17, 2021 (Figure 3.14) when Rc(t) = 2:766. If the rising trend follows Rc1 (t), one should also observe a faster steady decreases of cases with a linear gradual return to normalcy with no additional surge and rebound. In that case, the last case is reported on May 25, 2021 when Rc(t) = 2:017 yields a cumulative effective immunization ratio E (t) = 0:6334.
In all scenarios, zero additional cases are reported well before tL, the assumed last day of total vaccination delivery is made when E (tL) < 1. If human collective behavior changes in response to zero infection case achieved, and assuming that

That is, the endemic equilibrium is still higher than the cumulative effective immunization ratio achieved, then it is inevitable resurgence ensues with the imports of overseas cases, and a sudden discontinuity of positive jump on the Rc(t) over a short period of time. As a result, vaccination delivery must be continued and restrictive measures respected even if zero cases are reported. Under Rc1 (t) with a cumulative effective immunization ratio E (t) = 0:735 and assuming in the worst case scenario in which R0 , then another 16 days of vaccination is required:

Whereas t = 98 is the number of days passed since Mar 12, 2021 when zero case is reported. That is, the pandemic ends in the UK no later than September 24, 2021 if citizens collectively continue to respect measures in place and very gradually restores to normalcy even well after the last case is reported in June 17, 2021. Under Rc2 (t) scenario, which results a cumulative effective immunization ratio E (t) = 0:6334 when the last case is reported in May 15, then another 64 days of vaccination is required:

Whereas t = 75 is the number of days passed since Mar 12, 2021 when 0 case is reported. That is, the pandemic officially ends in the UK by 9/24/21 when Rc2(t) = 2:73 if citizens collectively continue to respect measures in place and very gradually restores to normalcy even well after the last case is reported in 5/25/21. The reason that in both cases the pandemic ends on the same date is that the difference between the infections under Rc1(t) and Rc2(t) with the latest observed date until the 0 reported cases into the future based on simulation is minimal so that

it is less than the daily vaccination rate at day 158-t , so any difference is compensated within a single day. In general, a pandemic ends n2 days faster under Rc1(t) when tE1 is the last day of infection reported under Rc1 (t) tE1 > tE2, n1 is the additional days required for E (t) = 1 under Rc1 (t) after tE1. n1 + n2 is the additional days needed for E (t) = 1 under Rc2 (t) after tE2.

3.4 Serbia Projections
Based on all historical records, no particular daily increase in single or double dose administration is observed in Serbia, [38] and the second dose administration lags behind the 1st by 17 days, as typically observed in Israel and US as in Figure 3.15.
As a result, we simply take the average daily dose administered during the entire 2021 for single dose and average daily dose administered during the last 1 month from Feb to March 2021 for double doses as the indicator for the vaccination rate of the future. So we have:

We then compute E (t) and derived the immunization ratio of Serbia as given in (Figure 3.16).
We perform 2 fits for Serbia, a polynomial and linear fit, but polynomial fit is actually sub-linear so we have a single linear fit:

where the intercept 1 is the initial control Rc value of Serbia at the beginning of vaccination program. Along with Rc (t), we run the recursive simulation S (t). We find that depending on the Rc (t) curve, and assuming R0 > 2:2, a small surge of infection is observed if the rising trend follows Rc(t) (Figure 3.17). The vaccination rate is somewhat slower than the relaxation rate of human behaviors returning to normalcy. With an initial infection size of 546,896 on 3/20/21, [39] [40] additional infections of 357,628 and cumulative effective vaccination size of 6,561,999 yields a cumulative effective immunization ratio E (t) = 0:5817 on July 18, 2021 when Rc(t) = 1:9 (Figure 3. 18).
zero additional cases are reported well before tL, the assumed last day of total vaccination delivery is made when E(tL) < 1. If human collective behavior changes in response to 0 infection case achieved, and assuming that

That is, the endemic equilibrium is still higher than the cumulative effective immunization ratio achieved, then it is inevitable resurgence ensues with the imports of overseas cases, and a sudden discontinuity of positive jump on the Rc(t) over a short period of time. As a result, vaccination delivery must be continued and restrictive measures respected even if zero cases are reported. Under Rc(t) with a cumulative effective immunization ratio E (t) = 0:5871 and assuming in the worst case scenario in which R0→∞, then another 164 days of vaccination is required:

Whereas t = 140 is the number of days passed since Mar 1st, 2021 when zero case is reported. That is, the pandemic ends in Serbia no later than 12/29/21 if citizens collectively continue to respect measures in place and very gradually restores to normalcy even well after the last case is reported in 7/18/21.
4. Discussion
The relationship between t_, the delay of the onset of antibodies after immunization, and e1, the efficiency for inducing antibodies based immunity with at least one dose requires further analysis. In our paper, we assumed there is a 8 days delay for the onset of antibodies after immunization. However, other literature suggests a range of delays [29]. There are two possible assumptions. First, e1 can remain fixed while the delay is lengthened to t€+td. In this case, the final immunity ratio E (t) decreases because V1 (t - (t€ + td)):

Second, e1 is increased to e1 +ed while the delay is lengthened to t€ +td. In this case, it suggests that our previous
delay was too short to cover all possible cases with induced immunity. The final E (t) is then depending on the
magnitude of ed and td as:

The second case led to us to the conclusion that both models are approximations. In reality, the number of immunized increases in a time dependent manner. In the simplest form, the cumulative number of people with induced immunity grows linearly with each passing day from a pool of people initially vaccinated. If the daily newly induced is constant, then a uniform distribution spread across time can model daily changes. Then, weighted average delay t€ is:

Assuming in n days all possible induced immunization is realized and each day shares out of all induced. One can easily see in that case the final t€ should be the median of n days registered. In reality, each passing day likely to have weighted proportion, and non-uniform distribution such as normal distribution spread across time can probably model daily changes more accurately. In such case, the cumulative number of people with induced immunity grows according to a logistic function. In general, assume there is a function F (V1 (t); t + ti) that takes initial size of people vaccinated on day t and given a subsequent day t + ti, returns the number of people with induced immunity on day t + ti. Then the weighted average delay t€ can be computed as:

However, weighted average delay t_ is yet another approximation attempt at its best. To truly represent the number of people with induced immunity one has to construct a (tL – tF ) (tL – tF + n + 1) sized matrix A as:
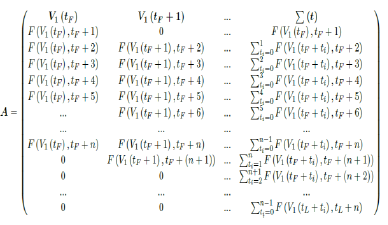
Whereas the final results are tallied under the last row A [tL - tF + 1], and V1 (t) × e1 can be re-defined as the cumulative of all with induced immunity from vaccinations from all days:
 and daily effective vaccination can be defined as:

Correspondingly, similar matrix can be constructed for the second dose. This certainly leaves room for future work to make predictions more precise.
Finally, the relationship diagram for deriving Rc, the control R0 can be illustrated as below:
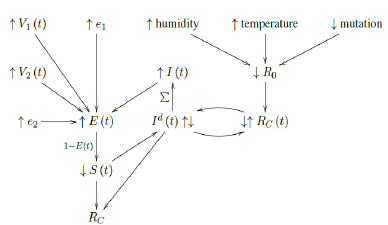
That is, the intrinsic R0 can be altered as the humidity, temperature, and mutate variation of the virus changes. Based on the intrinsic R0, Rc (t) < R0 can be derived which changes through time. That is, the community as a whole follows cycles of relaxation and restrictive measures depends on the observed daily infection. When the infection numbers Id (t) are high, the observant community resorts to more cautious behavior. Which in turn reduces Rc (t) and lower Id (t) is observed. Rc (t) is not the only factor influences Id (t). The remaining susceptible population ratio S (t) also plays a role in shaping the final numbers of Id (t). The summation of Id (t) leads to cumulative number of infection I (t). At the same time, the daily vaccination number V1 (t), the efficacy e1, the daily vaccination number V2 (t), the efficacy e2, and cumulative number of infection I (t) leads to immunity ratio E (t), which leads to the remaining susceptible population ratio S (t) = 1 - E (t). Finally, Rc at the current time can be derived based on the rate of change in Id (t) and S (t) leads computed, this is how we arrived at the conclusion that COVID-19 has at least a daily R0 > 2:2.
5. Conclusions
Israel currently observed R0 = 2:2 is a very encouraging value, it implies that the pandemic can possibly terminate sooner than most expect [41] [21]. However, very few countries have reached the level of effective immunization to corroborate the validity of this result other than Seychelles. Seychelles has a much lower population at 100,000 but considerable infections at the current time so that its Rc (t) can be measured. However, Rc (t) of Seychelles has so far not yet plateau and Rc (t) > 2:2. Many explanations can be given, illustrated as a table below.
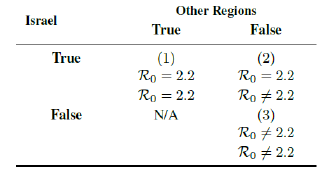
It is possible that R0 = 2:2 is indigenous to Israel only as case (2). Seychelles has a higher R0 due to locally higher level of social interaction and different viral strains. Since Seychelles has received a mix dosage of vaccines not limited Pfizer, it is possible that the difference in R0 is due to differential efficacy of the vaccines. It is also possible that R0 > 2:2. The currently observed value in Israel is still not the intrinsic R0 due to continued partial social distancing measures in place as suggested under (3). More analysis is required in the future as more countries reaching full effective immunization ratio. The R0 calculation can be replaced by the matrix tabulation we mentioned prior to gain better precision. However, it does not undermine our current assessment, as long as one adopt the identical methodology on computing R0 across all data. Finally, even assuming R0 > 2:2, due to aggressive vaccination program, continued implementation of restrictive measures, or both, in all countries we have analyzed present an optimistic outlook at controlling the pandemic toward the latter part of 2021.
References
- CGTN, “”Six COVID-19 vaccine candidates in phase-3 trials, 3 from China: WHO”,” (Aug 2020).
- news, “”Russia’s fast-track coronavirus vaccine draws outrage over safety”,” (Aug 2020).
- Medicines and H. products Regulatory Agency, Vaccine BNT162b2 – Conditions of authorization under Regulation (2020) 174 – 2.
- Mueller, ““U.K. Approves Pfizer Coronavirus Vaccine, a First in the West”,” New York Times (2020).
- Commission, “”Questions and Answers: COVID-19 vaccination in the EU”,” (2021).
- News, “”UAE: Ministry of Health announces 86 per cent vaccine efficacy”,” (2020).
- N. Agency, “”Bahrain second in the world to approve the Pfizer/BioNTech Covid-19 vaccine”,” (2020).
- CNBC, FDA approves second Covid vaccine for emergency use as it clears Moderna’s for U.S. distribution (2020).
- N. Ngonghala, E. Iboi, S. Eikenberry, M. Scotch, C. R. MacIntyre, M. H. Bonds, and A. B. Gumel, “Mathematical assessment of the impact of non-pharmaceutical interventions on curtailing the 2019 novel Coronavirus,” Mathematical Biosciences (108364) (2020).
- Ngonghala CN, Iboi E, and Gumel AB. “Could masks curtail the post-lockdown resurgence of covid-19 in the US?” Mathematical Biosciences (108452) (2020).
- Eikenberry SE, Muncuso M, Iboi E, Phan T, Kostelich E, Kuang Y, and Gumel AB. “To mask or not to mask: Modeling the potential for face mask use by the general public to curtail the COVID-19 pandemic” Infectious Disease Modeling (2020) :293–308.
- Hellewell J, Abbott S, Gimma A, Bosse NI, Jarvis CI, Russell TW, Munday JD, Kucharski AJ, Edmunds WJ, and FS et al. “Feasibility of controlling COVID-19 outbreaks by isolation of cases and contacts”,” The Lancet Global Health (2020) (E488–E496).
- Kucharski AJ, Russell TW, Diamond C, Liu Y, Edmunds J, Funk RMES, Sun F, Jit M, and Munday JD. “Early dynamics of transmission and control of covid-19: a mathematical modelling study” The Lancet Infectious Diseases (2020) :553–558.
- Xue L, Jing S, Miller JC, Sun W, Li H, Estrada-Franco JG, Hyman JM and Zhu H. “A datadriven network model for the emerging covid-19 epidemics in Wuhan, Toronto and Italy”,” Mathematical Biosciences (2020) (108391).
- Firth JA, Hellewell J, Klepac P, and Kissler S. “Using a real-world network to model localized covid-19 control strategies” Nature Medicine (2020).
- Ferguson NM, Laydon D, Nedjati-Gilani G, Imai N, Ainslie K, Baguelin M, Bhatia S, Boonyasiri A, Cucunuba Z, Cuomo-Dannenburg G, and et al. “Impact of non-pharmaceutical interventions (NPIs) to reduce COVID-19 mortality and healthcare demand, London: Imperial College COVID-19 Response Team” (2020).
- Ferguson NM, Laydon D, Nedjati-Gilani G, Imai N, Ainslie K, Baguelin M, Bhatia S, Boonyasiri A, Cucunuba Z, Cuomo-Dannenburg G, and et al. “Impact of non-pharmaceutical interventions (NPIs) to reduce COVID-19 mortality and healthcare demand, London: Imperial College COVID-19 Response Team” (2020).
- Srivastava A and Chowell G. “Understanding spatial heterogeneity of COVID-19 pandemic using shape analysis of growth rate curves” medRxiv (2020).
- health service utilization forecasting team. “Forecasting COVID-19 impact on hospital bed-days, ICU-days, ventilator-days and deaths by us state in the next 4 months” medRxiv (2020).
- Tariq YLA, Roosa K, Blumberg S, Yan P, Ma S, and Chowell G. “Real-time monitoring the transmission potential of COVID-19 in Singapore, march 2020” BMC Medicine 18 (2020) :1–14.
- Gumel AB, Iboi EA, Ngonghala CN, and Elbasha EH. “A primer on using mathematics to understand COVID-19 dynamics: Modeling, analysis and simulations” Infectious Disease Modelling (2020).
- Zhu SS. “The Predictions on Worldwide Covid-19 Pandemic Cases Based on Historical Data” Research gate (2020).
- Zhu SS. “Optimal Strategies for Covid-19 Vaccination Policies based on All Possible Mathematical Landscapes and the Outlook for 2021 with a Special Case Study for Serbia” Research gate (2020).
- Zhu SS. “A Generalized Viral Infection Mathematical Model Derived from Covid-19 Simulation” Research gate (2020).
- CEG S. “Prospects of the control of disease” Proc Roy Soc Med (1970): 1181–90.
- Dietz CKK, Ludwig D. “Transmission and control of arbovirus diseases” Epidemiology, Philadelphia PA Society for Industrial and Applied Mathematics (1975): 104–21.
- Zhu SS. “The Mathematics Behind Covid-19 and Viral Infections” (2020).
- Zhu SS. “The Cyclic Nature of Covid-19’s Daily Diagnoses and its Mathematical Modeling based on Infection Cycles from Both Temporal and Spatial Aspects” Research gate (2020).
- Pfizer and Bio NTech. “FDA Briefing Document: Pfizer-Bio NTech COVID-19 Vaccine/Cumulative Incidence Curves for the First COVID-19 Occurrence After Dose 1, Dose 1 All-Available Efficacy Population” Vaccines and Related Biological Products Advisory Committee Meeting (2020).
- World meter, ”Israel Coronavirus Case” (2021).
- Wikipedia, ”COVID-19 pandemic in Israel” (2021).
- Mathieu, ”owid/covid-19-data” (March 2021).
- Gumel AB, Iboi E, Ngonghala C, Ngonghala C, and Ngwa GA. “Mathematical assessment of the roles of vaccination and non-pharmaceutical interventions on COVID-19 dynamics: a multi group modeling approach”. medRxiv (2020).
- Mathieu E. ”owid/covid-19-data” (2021).
- Mathieu E. ”owid/covid-19-data” (2021).
- “United Kingdom Coronavirus Case” (2021).
- Wikipedia“COVID-19 pandemic in UK” (2021).
- Mathieu E. “owid/covid-19-data” (2021).
- Worldometer “Serbia Coronavirus Case” (2021).
- “COVID-19 pandemic in Serbia” (2021).
- AXELROD J. “Coronavirus may infect up to 70 percent of world’s population, expert warns.

