Effects of Cancer, Coronary Artery Disease and other Comorbidities on COVID-19 Related Mortality: A Meta-analysis and Meta-regression
Article Information
Shon Shmushkevich1, 2#, Massimo Baudo3#, Nagla Abdel Karim4, Mahmoud Morsi5, Mariam Khobsa6, Hala Aziz7, Maha Yahia7, Mohamed Emam7, Omnia Mohamed7, Hossameldin Abdallah7, Ahmed Abouarab8, Dina Mofed9, Mohamed Ismael10, Ayah A Hassan11, Mostafa Rahouma12, Mohamed Kamel13, Sherif Khairallah13, Ihab Saad13, Galal Ghaly13, Sherif Bahaa13, Rabab Gaafar7, Abdel Rahman Mohamed13, Mohamed Rahouma13*#
1Zanvyl Krieger School of Arts & Sciences, Johns Hopkins University, Maryland, USA
2Department of Cardiothoracic Surgery, Weill Cornell Medicine/New York Presbyterian Hospital, New York, USA
3Department of Cardiac Surgery, Spedali Civili di Brescia, Brescia, Italy
4Department of Hematology and Oncology, Medical College of Georgia, Augusta University, Augusta, USA
5Department of General Surgery, Montefiore Health System, New York, USA
6Department of Cardiology, Overlake Medical Center, Washington, USA
7Department of Medical Oncology, National Cancer Institute, Cairo University, Cairo, Egypt
8Department of Surgery, New York Presbyterian Hospital, New York, USA
9Department of Zoology, Faculty of science, Cairo University, Cairo, Egypt
10Department of Microbiology, High Institute of Public Health, Alexandria university, Qism Bab Sharqi, Egypt
11Department of Pharmacognosy, Faculty of Pharmacy, Cairo University, Cairo, Egypt
12Department of Information Technology, National Cancer Institute, Cairo University, Cairo, Egypt
13Department of Surgical Oncology, National Cancer Institute, Cairo University, Cairo, Egypt
*Corresponding Author: Mohamed Rahouma, Department of Surgical Oncology, National Cancer Institute, Cairo University, Egypt 1st Fom Elkhaleeg Square Masr ElKadema, Cairo, Egypt, E-mail: mhmdrahouma@gmail.com
# - Equally contributed to the work.
Received: 07 August 2020; Accepted: 19 August 2020; Published: 15 October 2020
Citation: Shon Shmushkevich, Nagla Abdel Karim, Massimo Baudo, Mahmoud Morsi, Mariam Khobsa, Hala Aziz, Maha Yahia, Mohamed Emam, Ahmed Abouarab, Dina Mofed, Mohamed Ismael, Ayah A Hassan, Mostafa Rahouma, Mohamed Kamel, Sherif Khairallah, Ihab Saad, Abdel Rahman Mohamed, Mohamed Rahouma. Effects of Cancer, Coronary Artery Disease and other Comorbidities on COVID-19 Related Mortality: A Meta-analysis and Meta-regression. Journal of Surgery and Research 3 (2020): 343-369.
View / Download Pdf Share at FacebookAbstract
Objective: To investigate Coronavirus Disease 2019 (COVID-19) associated mortality, the prevalence of different symptoms, and the prevalence and association between comorbidities and their effects on outcomes.
Methods: We performed a systematic literature search and meta-analysis on studies that assess COVID-19 patients' symptoms, comorbidities, and outcomes using pooled event rate (PER) and pooled event means (PEM). The primary outcome was the pooled all- cause short-term mortality. The secondary outcomes were length of hospital stay and symptom presentation. Meta-regression and leave-one-out analysis were conducted for mortality.
Results: 56 articles met our inclusion criteria with a total of 9074 patients. The PEM for age was 49.6 years. The PER for female gender was 46.79%. The PER for smoking, hypertension, cardiac comorbidities, diabetes was 10.96%, 24.47%, 20.30%; 12.34% respectively. The PER for CAD, COPD, history of cancer and chronic liver disease was 5.44%, 3.96%, 3.75% and 3.08%. The PER for fever, cough, sore throat and headache was 79.29%, 56.48%, 11.10%, 8.16%, respectively. The PER for diarrhea, chest pain, fatigue and vomiting was 11.32%, 13.43%, 27.72% and 11.98%, respectively. PEM for hospital stay was 10.9 days (95% CI 7.3- 16.1 days). The PER for hospital mortality was 11.17% (95% CI, 6.67% - 17.89%). Hospital mortality was significantly and positively associated with cardiac comorbidity and COPD. Age and cancer were not associated with higher hospital mortality.
Conclusion: Fever and cough are the most common presenting symptoms with estimated PER of 79.29% and 56.48% respectively. Hospital mortality is significantly and positively associated with cardiac comorbidities, CAD, and COPD, while not being significantly associated with patient age or cancer.
Keywords
COVID-19; Comorbidities; Meta-Analysis; Symptoms; Coronavirus; Mortality
COVID-19 articles, Comorbidities articles; Meta-Analysis articles; Symptoms articles; Coronavirus articles; Mortality articles
COVID-19 articles COVID-19 Research articles COVID-19 review articles COVID-19 PubMed articles COVID-19 PubMed Central articles COVID-19 2023 articles COVID-19 2024 articles COVID-19 Scopus articles COVID-19 impact factor journals COVID-19 Scopus journals COVID-19 PubMed journals COVID-19 medical journals COVID-19 free journals COVID-19 best journals COVID-19 top journals COVID-19 free medical journals COVID-19 famous journals COVID-19 Google Scholar indexed journals Comorbidities articles Comorbidities Research articles Comorbidities review articles Comorbidities PubMed articles Comorbidities PubMed Central articles Comorbidities 2023 articles Comorbidities 2024 articles Comorbidities Scopus articles Comorbidities impact factor journals Comorbidities Scopus journals Comorbidities PubMed journals Comorbidities medical journals Comorbidities free journals Comorbidities best journals Comorbidities top journals Comorbidities free medical journals Comorbidities famous journals Comorbidities Google Scholar indexed journals Meta-Analysis articles Meta-Analysis Research articles Meta-Analysis review articles Meta-Analysis PubMed articles Meta-Analysis PubMed Central articles Meta-Analysis 2023 articles Meta-Analysis 2024 articles Meta-Analysis Scopus articles Meta-Analysis impact factor journals Meta-Analysis Scopus journals Meta-Analysis PubMed journals Meta-Analysis medical journals Meta-Analysis free journals Meta-Analysis best journals Meta-Analysis top journals Meta-Analysis free medical journals Meta-Analysis famous journals Meta-Analysis Google Scholar indexed journals Symptoms articles Symptoms Research articles Symptoms review articles Symptoms PubMed articles Symptoms PubMed Central articles Symptoms 2023 articles Symptoms 2024 articles Symptoms Scopus articles Symptoms impact factor journals Symptoms Scopus journals Symptoms PubMed journals Symptoms medical journals Symptoms free journals Symptoms best journals Symptoms top journals Symptoms free medical journals Symptoms famous journals Symptoms Google Scholar indexed journals Coronavirus articles Coronavirus Research articles Coronavirus review articles Coronavirus PubMed articles Coronavirus PubMed Central articles Coronavirus 2023 articles Coronavirus 2024 articles Coronavirus Scopus articles Coronavirus impact factor journals Coronavirus Scopus journals Coronavirus PubMed journals Coronavirus medical journals Coronavirus free journals Coronavirus best journals Coronavirus top journals Coronavirus free medical journals Coronavirus famous journals Coronavirus Google Scholar indexed journals Mortality articles Mortality Research articles Mortality review articles Mortality PubMed articles Mortality PubMed Central articles Mortality 2023 articles Mortality 2024 articles Mortality Scopus articles Mortality impact factor journals Mortality Scopus journals Mortality PubMed journals Mortality medical journals Mortality free journals Mortality best journals Mortality top journals Mortality free medical journals Mortality famous journals Mortality Google Scholar indexed journals dry cough articles dry cough Research articles dry cough review articles dry cough PubMed articles dry cough PubMed Central articles dry cough 2023 articles dry cough 2024 articles dry cough Scopus articles dry cough impact factor journals dry cough Scopus journals dry cough PubMed journals dry cough medical journals dry cough free journals dry cough best journals dry cough top journals dry cough free medical journals dry cough famous journals dry cough Google Scholar indexed journals sore throat articles sore throat Research articles sore throat review articles sore throat PubMed articles sore throat PubMed Central articles sore throat 2023 articles sore throat 2024 articles sore throat Scopus articles sore throat impact factor journals sore throat Scopus journals sore throat PubMed journals sore throat medical journals sore throat free journals sore throat best journals sore throat top journals sore throat free medical journals sore throat famous journals sore throat Google Scholar indexed journals immune system articles immune system Research articles immune system review articles immune system PubMed articles immune system PubMed Central articles immune system 2023 articles immune system 2024 articles immune system Scopus articles immune system impact factor journals immune system Scopus journals immune system PubMed journals immune system medical journals immune system free journals immune system best journals immune system top journals immune system free medical journals immune system famous journals immune system Google Scholar indexed journals cardiac comorbidity articles cardiac comorbidity Research articles cardiac comorbidity review articles cardiac comorbidity PubMed articles cardiac comorbidity PubMed Central articles cardiac comorbidity 2023 articles cardiac comorbidity 2024 articles cardiac comorbidity Scopus articles cardiac comorbidity impact factor journals cardiac comorbidity Scopus journals cardiac comorbidity PubMed journals cardiac comorbidity medical journals cardiac comorbidity free journals cardiac comorbidity best journals cardiac comorbidity top journals cardiac comorbidity free medical journals cardiac comorbidity famous journals cardiac comorbidity Google Scholar indexed journals
Article Details
1. Introduction
Beginning in December 2019, pneumonia cases with unknown origin began to arise in Wuhan, Hubei, China. High-throughput sequencing from lower respiratory tract samples has revealed a novel coronavirus that was named 2019 novel coronavirus (2019-nCoV) and also named SARS Coronavirus-2 [1]. The 2019 coronavirus (COVID-19) pandemic has infected more than ten million people and caused more than five hundred thousand deaths (by the end of June 2020) [2]. 2019-nCoV targets the respiratory tract and shares many similar clinical symptoms with SARSCoV and Middle East respiratory syndrome
Coronavirus (MERS) [1]. Common symptoms include fever, fatigue, and dry cough [3-7]. Previous studies have shown a relationship between cardiovascular metabolic diseases, SARS, and MERS [2, 8]. One study provided that 637 MERS-CoV cases showed diabetes and hypertension as prevalent in 50% of patients and cardiac diseases as 30% of cases [2].
Even though our understanding of Covid-19 transmission is consistently growing, it is widely believed that SARS-CoV-2 is transmitted via droplets and close contacts with people carrying the virus [2].
Additionally, it is also reported that the virus transmits through various surfaces, gastrointestinal transmission [9], and airborne exposures [2, 10]. Although our knowledge of transmission and at-risk populations has significantly increased, our understanding of effective therapeutic interventions has been limited. There are several published studies that describe the epidemiological and clinical characteristics of recovered and mortality cases affected by COVID-19. In this report, we will comprehensively evaluate patient demographics, comorbidities, symptoms, mortality, and length of hospital stay.
2. Methods
2.1 Study design and sample selection
This systematic review and meta-analysis was conducted according to the Preferred Reporting Items for Systematic Reviews and Meta-Analysis (PRISMA) statement [11] and the PRISMA flow diagram is presented in Supplementary figure 1. A systematic review was performed to identify studies reporting on patients affected with COVID-19. Pubmed, Ovid’s version of MEDLINE (In-Process & Other Non-Indexed Citations and Ovid MEDLINE January 2020 to Present), Ovid EMBASE (January 2020 to present), and The Cochrane Library (Wiley) were searched. Literature search was terminated on April 1st, 2020. The inclusion criteria were adult patients > 18 years, English-language and full-length articles about early outcomes of patients with COVID-19. In addition, references of recent meta-analyses and reviews on this topic were searched for potential additional studies (i.e. backward snowballing). In case of studies from the same or overlapping cohorts reporting different outcomes, the largest series was included for each outcome. Studies with patients <18 years and editorial or reviews were excluded.
2.2 Data Extraction
Studies were independently screened by 2 investigators (S.S. and M.B.). In case of any discrepancy, a consensus was reached with the aid of a third author (M.R.). Microsoft Office 365 Excel software (Microsoft, Redmond, Washington) was used for data extraction. The following variables were included: study demographics as sample size, number of centers, name of center, publication year, and country. Patient demographics and comorbidities variables on age, sex, smoking, diabetes mellitus, hypertension, chronic liver disease, cancer history, coronary artery disease (CAD) and chronic obstructive pulmonary disease (COPD) and cardiac comorbidity were abstracted. Symptoms presentation variables such as fever, cough, sore throat, headache, diarrhea, chest pain fatigue and vomiting were retrieved (Supplementary Table 1). Continuous variables were reported as mean and standard deviation, while categorical variables were reported as counts and percentages. The quality of the included observational studies was assessed using the Newcastle- Ottawa Quality Assessment Scale (NOS) for cohort studies[12]. The comparison evaluation points were excluded, as the studies were analyzed as single arm. Thus, 6 stars was the highest possible score out of the 9 (Supplementary Table 2).
2.3 Outcomes
The primary outcome was the pooled all-cause short-term mortality. The secondary outcomes were the length of hospital stay and symptom presentation.
2.4 Data synthesis and statistical analysis
This is a single arm meta-analysis. The binary outcomes and continuous outcomes were reported as pooled event rate (PER) and pooled event means (PEM) with 95% confidence interval (CI) respectively were calculated using the generic inverse variance method with logit transformation and log transformed mean, respectively. The DerSimonian-Laird method was used as between-study estimator [13]. Statistical significance will be set at P <0.05. Heterogeneity will be reported as low (I2 = 0%-25%), moderate (I2 = 26%-50%), high (I2 > 50%), consistent with guidelines [14]. Individual study inference analysis was performed through a “leave-one-out” sensitivity analysis. Publication bias was analyzed by funnel plot visual assessment and Egger regression test. All statistical analyses were performed using “meta” and “metaphor” packages in R (version 3.6.2 R Project for Statistical Computing) within RStudio.
2.5 Meta-regression
Univariable meta-regression was performed to investigate the effect of different collected variables on the primary outcome including age, gender, hypertension, diabetes, COPD, smoking, chronic liver disease, cancer history, coronary artery disease, cardiac comorbidities. Studies were weighted by the inverse of the variance of the estimate for that study, and between-study variance was estimated with DerSimonian-Laird estimator. The results were reported as regression coefficient (i.e., beta).
3. Results
The literature search identified 2735 studies. No additional articles were identified through backward snowballing. 2598 studies were excluded due to title and abstract screening. 137 studies received full text screening. Fifty-six articles met our inclusion criteria with a total of 9074 patients, Supplementary Figure 1. 48 studies were from China, 3 from Korea, 2 from France, 1 from each of USA, Europe and Italy. Female percent range for included studies was 26.8% to 66.6%. The mean age ranged from 29.2 to 77 in included studies.
3.1 Meta-analysis
The PER for hospital mortality was 11.17% (95% CI, 6.67% - 17.89%), Figure 1. Among the analyzed studies, high heterogeneity (I2 = 94%) was detected. Visual inspection of the funnel plot and Egger test did not reveal significant asymmetry for hospital mortality (Egger test p-value = 0.1308). The leave-one-out analysis is depicted in Supplementary Figure 2. Patients characteristics were as follows: the PEM for age was 49.6 years (95% CI 46.8-52.6); the PER for female gender was 46.79% (95% CI 44.48% - 49.11%); the PER for smoking was 10.96% (95% CI 7.35% - 16.02%); the PER for hypertension was 24.47% (95% CI 19.85% - 29.77%); the PER cardiac comorbidities was 20.30% (95% CI 9.43% - 38.40%); the PER for diabetes was 12.34% (95% CI 9.96% - 15.20%); the PER for CADwas 5.44% (95% CI 3.50% - 8.38%); the PER for COPD was 3.96% (95% CI 2.09% - 6.42%); the PER for history of cancer was 3.75% (95% CI 2.17% - 6.41%) and the PER for chronic liver disease was 3.08% (95% CI was 2.12% - 4.47%).
Patients characteristics are summarized in Supplementary Table 3 (forest plots can be seen in the Appendix Supplementary figures 3-6). As far as presenting symptoms concern, the PER for fever 79.29% (95% CI 73.56 – 84.04%); the PER for cough was 56.48% (95% CI 50.63% – 62.15%); the PER for sore throat was 11.10% (95% CI 6.94% - 17-28%); the PER for headache was 8.16% (95% CI 6.60% – 10.05%); the PER for diarrhea was 11.32% (95% CI 5.37% - 22.34%); the PER for chest pain was 13.43% (95% CI 7.58% - 22.70%); the PER for fatigue was 27.72% (95% CI 21.97% - 34.32%); the PER for vomiting was 11.98% (95% CI 2.87% - 38.54%) and the PEM for LOS was 10.9 days (95% CI 7.3 – 16.1 days). Symptom presentations are summarized in Table 1, Figure 1 and Supplementary Figures 7-10.
3.2 Meta-regression
Hospital mortality was significantly and positively associated with cardiac comorbidity (Beta=0.0981, p=0.0009), coronary artery disease (Beta =0.0806, p=0.0270) and COPD (Beta =0.4581, p=0.0218). Age and cancer history were not associated with higher hospital mortality. See Figure 2 for bubble-plots and Table 2 for details.
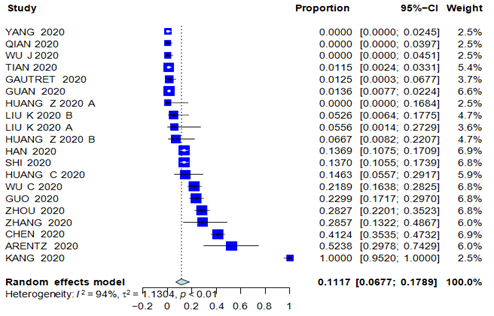
Figure 1: Forest Plot of hospital mortality.
|
Outcome |
N. of Studies |
Effect |
95% CI |
Heterogeneity (I2, p-value) |
|
Fever |
41 |
79.29% |
73.56% - 84.04% |
94.1%, p<0.0001 |
|
Cough |
43 |
56.48% |
50.63% - 62.15% |
93.5%, p<0.0001 |
|
Sore Throat |
18 |
11.10% |
6.94% - 17.28% |
96.0%, p<0.0001 |
|
Headache |
20 |
8.16% |
6.60% - 10.05% |
71.2%, p<0.0001 |
|
Diarrhea |
28 |
11.32% |
5.37% - 22.34% |
97.3%, p<0.0001 |
|
Chest pain |
7 |
13.43% |
7.58% - 22.70% |
78.8%, p<0.0001 |
|
Fatigue |
25 |
27.72% |
21.97% - 34.32% |
92.2%, p<0.0001 |
|
Vomiting |
13 |
11.98% |
2.87% - 38.54% |
98.2%, p<0.0001 |
|
Hospital mortality |
20 |
11.17% |
6.77% - 17.89% |
94.3%, p<0.0001 |
|
Length of hospital stay |
3 |
10.9 days |
7.36 – 16.19 days |
99.1%, p<0.0001 |
Table 1: Meta-analysis outcomes summary.
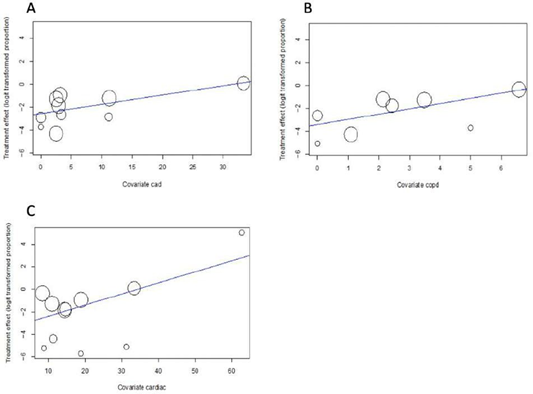
Figure 2: Meta-regression of cardiac comorbidity, CAD and COPD for hospital mortality bubble plot Figure A) Coronary Artery Disease (CAD), B) Chronic Obstructive Pulmonary Disease (COPD), C) Cardiac comorbidities on hospital mortality. Hospital mortality is significantly and positively associated with CAD (Beta=0.0806, p=0.0270), COPD (Beta =0.4581, p=0.0218) and cardiac comorbidity (Beta =0.0981, p=0.0009).
|
Outcome |
No. of Studies |
Hospital mortality (b ± SE, p-value) |
|
Age |
18 |
0.0038 ± 0.0136, 0.2770 |
|
Female gender |
14 |
-0.0538 ± 0.0299, 0.0716 |
|
Smoking |
11 |
-0.0164 ± 0.0331, 0.6207 |
|
Diabetes |
12 |
-0.0064 ± 0.0148, 0.6638 |
|
Hypertension |
10 |
-0.0017 ± 0.0160, 0.9136 |
|
Cardiac comorbidity |
11 |
0.0981 ± 0.0294, 0.0009 |
|
CAD |
10 |
0.0806 ± 0.0364, 0.0270 |
|
COPD |
8 |
0.4581 ± 0.1997, 0.0218 |
|
Chronic liver disease |
7 |
-0.0551 ± 0.1204, 0.6475 |
|
History of cancer |
6 |
0.0170 ± 0.0236, 0.4715 |
CAD = Coronary Artery Disease; COPD = Chronic Obstructive Pulmonary Disease
Table 2: Meta-regression of different variables on hospital mortality.
4. Discussion
In this meta-analysis, we examined 56 studies with a total of 9,074 patients. This comprehensive analysis focused on numerous morbidities such as hypertension, cardiac comorbidities, COPD, coronary artery disease, diabetes, cancer, and chronic liver disease. The symptoms that were analyzed include fever, cough, sore throat, headache, diarrhea, chest pain, fatigue, and vomiting. Hospital mortality and length of stay were also analyzed. This meta-analysis indicated that the PER for hospital mortality was 11.17% (95% CI, 6.67% - 17.89%) which lies in the previously reported range of mortality rate, which is roughly 2.12%-18.9% [15-18]. Our analysis identified the most significant comorbidities being hypertension with PER of 24.47% (95% CI 19.85% - 29.77%), cardiac comorbidities which had a PER of 20.30% (95% CI 9.43% - 38.40%), and diabetes which had a PER of 12.34% (95% CI 9.96% - 15.20%). These results run parallel to previously conducted meta-analyses, which reported hypertension prevalence of about 20% and diabetes of about 10% [19]. A higher mortality rate of 11.17% can be attributed to a higher prevalence of significant comorbidities in our included studies. The most statistically significant presenting symptoms include fever and cough. Fever had a PER of 79.29% (95% CI 73.56 – 84.04%); while cough had a PER of 56.48% (95% CI 50.63% – 62.15%). Our results confirm that symptoms of fever and persistent cough are the most prevalent symptoms of COVID-19 worldwide [20].
Interestingly, the conducted meta-regression indicates that hospital mortality is significantly and positively associated with cardiac comorbidity (b=0.0981, p=0.0009), CAD (b=0.0806, p=0.0270), and COPD (b=0.4581, p=0.0218), but not with age. Based on this meta-regression, age is not significantly associated with hospital mortality, which opposes the current belief that is propagated in the medical community and media outlets. Recent studies portray that patients who are elderly carry a more significant risk factor for COVID-19 related mortality [18]. Against what we initially thought, in this meta-analysis, cancer did not affect overall mortality estimate. Immunocompromised patients tend to not respond normally to an infection due to an impaired or weakened immune system[21]. The inability to combat infection is attributed to numerous conditions including underlying disease (malignancy, organ or stem cell transplantation, systemic vasculitis, connective tissues diseases, etc.), associated conditions (diabetes, malnutrition, etc.) or drug-related immune suppression [21].
Up to our knowledge and compared to other meta-analysis conducted, this is the first meta-analysis to involve a meta-regression of numerous comorbidities effect on hospital mortality. Our results run in parallel with prior meta-analyses conducted, which link poor Covid-19 outcome with specific comorbidities. Our study is unique in that through a meta-regression we are able to add another dimension to statistical Covid-19 analysis, which depicted that hospital mortality was significantly and positively associated with cardiac comorbidity, CAD and COPD, while not being associated with patient age or cancer history. Other studies show that hypertension has a composite of poor outcome, comprising of mortality, severe COVID-19, acute respiratory distress syndrome (ARDS), need for intensive care unit (ICU) care and disease progression [22]. Also, diabetes had a composite poor outcome, including mortality, severe COVID-19, acute respiratory distress syndrome (ARDS), need for intensive care unit (ICU) care, and disease progression [23]. Yet, our study did not attribute higher incidence of mortality to these comorbidities. Another meta-regression showed that cardiovascular disease was associated with increased composite poor outcome, which our analysis agrees with [24].
This meta-analysis should aid policymakers by providing insight that age might not be the most significant factor in COVID-19 mortality. It is important to educate the public, which mostly believes that age is the sole factor driving Covid-19 deaths. With a potential second wave on the rise in the United States, many citizens are beginning to exercise less caution in social distancing protocols. We believe this is dangerous because many of those people may have significant comorbidities that could place them in a zone of tremendous risk - without being aware of it. Based on the evidence, it is important that policymakers provide strict guidance to the groups that are at increased risk for severe COVID-19 [19]. As previous meta-analyses have concluded, results from published work should aid in group selection for ongoing clinical trials, and inform policymakers as to which groups should be prioritized if a vaccination becomes available [19]. The increased mortality of COVID-19 in hypertension, cardiac comorbidities, and diabetes patient groups should direct future preventative therapies and vaccination programs for these particular groups while maintaining mitigating prevention strategies [19].
5. Conclusion
Fever and cough are the most common presenting symptoms with estimated PER of 79.29% and 56.48% respectively. Hospital mortality is significantly and positively associated with cardiac comorbidities, CAD, and COPD, while not being significantly associated with patient age or cancer.
References
- Zhu N, Zhang D, Wang W, et al. A Novel Coronavirus from Patients with Pneumonia in China, 2019. N Engl J Med 382 (2020): 727-733.
- Coronavirus disease (COVID-19) – World Health Organization (2020).
- Huang C, Wang Y, Li X, et al. Clinical features of patients infected with 2019 novel coronavirus in Wuhan, China. Lancet 395 (2020): 497-506.
- Wang D, Hu B, Hu C, et al. Clinical Characteristics of 138 Hospitalized Patients With 2019 Novel Coronavirus-Infected Pneumonia in Wuhan, China. JAMA (2020).
- Chen N, Zhou M, Dong X, et al. Epidemiological and clinical characteristics of 99 cases of 2019 novel coronavirus pneumonia in Wuhan, China: a descriptive study. Lancet 395 (2020): 507-513.
- Hui DS, Azhar E I, Madani TA, et al. The continuing 2019- nCoV epidemic threat of novel coronaviruses to global health - The latest 2019 novel coronavirus outbreak in Wuhan, China. Int J Infect Dis 91 (2020): 264-266.
- Yang JK, Feng Y, Yuan MY, et al. Plasma glucose levels and diabetes are independent predictors for mortality and morbidity in patients with SARS. Diabet Med 23 (2006): 623-628.
- Yu C-M, Wong RS-M, Wu EB, et al. Cardiovascular complications of severe acute respiratory syndrome. Postgrad Med J 82 (2006): 140-144.
- Xiao F, Tang M, Zheng X, et al. Evidence for Gastrointestinal Infection of SARS-CoV-2. Gastroenterology 158 (2020): 1831-1833.e3.
- Feuer BLJ Noah Higgins-Dunn Will. WHO considers “airborne precautions” for medical staff after study shows coronavirus can survive in air. CNBC (2020).
- Liberati A, Altman DG, Tetzlaff J, et al. The PRISMA statement for reporting systematic reviews and meta-analyses of studies that evaluate health care interventions: explanation and elaboration. J Clin Epidemiol 62 (2009): e1-e34.
- Ottawa Hospital Research Institute (2020).
- DerSimonian R, Laird N. Meta-analysis in clinical trials. Controlled Clinical Trials 7 (1986): 177-188.
- Guyot P, Ades AE, Ouwens MJNM, et al. Enhanced secondary analysis of survival data: reconstructing the data from published Kaplan-Meier survival curves. BMC Med Res Methodol 12 (2012): 9.
- CDC. COVIDView, Key Updates for Week 26. Centers for Disease Control and Prevention (2020).
- Giesen C, Diez-Izquierdo L, Saa-Requejo CM, et al. Epidemiological characteristics of the COVID-19 outbreak in a secondary hospital in Spain. American Journal of Infection Control (2020).
- Manabe T, Akatsu H, Kotani K, et al. Trends in clinical features of novel coronavirus disease (COVID-19): A systematic review and meta-analysis of studies published from December 2019 to February 2020. Respir Investig (2020).
- Li J, Xu G, Yu H, et al. Clinical Characteristics and Outcomes of 74 Patients With Severe or Critical COVID-19. The American Journal of the Medical Sciences (2020).
- Singh AK, Gillies CL, Singh R, et al. Prevalence of co-morbidities and their association with mortality in patients with COVID-19: A systematic review and meta-analysis. Diabetes, Obesity and Metabolism (2020).
- Grant MC, Geoghegan L, Arbyn M, et al. The prevalence of symptoms in 24,410 adults infected by the novel coronavirus (SARS-CoV-2; COVID-19): A systematic review and meta-analysis of 148 studies from 9 countries. PLOS ONE 15 (2020): e0234765.
- Azoulay E, Soares M, Benoit D. Focus on immunocompromised patients. Intensive Care Med 42 (2016): 463-465.
- Pranata R, Lim MA, Huang I, et al. Hypertension is associated with increased mortality and severity of disease in COVID-19 pneumonia: A systematic review, meta-analysis and meta-regression. J Renin Angiotensin Aldosterone Syst 21 (2020).
- Huang I, Lim MA, Pranata R. Diabetes mellitus is associated with increased mortality and severity of disease in COVID-19 pneumonia - A systematic review, meta- analysis, and meta-regression. Diabetes Metab Syndr 14 (2020): 395-403.
- Pranata R, Huang I, Lim MA, et al. Impact of cerebrovascular and cardiovascular diseases on mortality and severity of COVID-19–systematic review, meta-analysis, and meta-regression. Journal of Stroke and Cerebrovascular Diseases 29 (2020): 104949.
- Jiang Y, He S, Zhang C, et al. Clinical characteristics of 60 discharged cases of 2019 novel coronavirus-infected pneumonia in Taizhou, China. Ann Transl Med 8 (2020): 547.
- Huang Z, Cao J, Yao Y, et al. The effect of RAS blockers on the clinical characteristics of COVID-19 patients with hypertension. Ann Transl Med 8 (2020): 430.
- Liu K, Zhang W, Yang Y, et al. Respiratory rehabilitation in elderly patients with COVID-19: A randomized controlled study. Complement Ther Clin Pract 39 (2020): 101166.
- Colaneri M, Sacchi P, Zuccaro V, et al. Clinical characteristics of coronavirus disease (COVID-19) early findings from a teaching hospital in Pavia, North Italy, 21 to 28 February 2020. Euro Surveill 25 (2020).
- Yan Y, Yang Y, Wang F, et al. Clinical characteristics and outcomes of patients with severe covid-19 with diabetes. BMJ Open Diabetes Res Care 8 (2020).
- Han Y, Liu Y, Zhou L, et al. Epidemiological Assessment of Imported Coronavirus Disease 2019 (COVID-19) Cases in the Most Affected City Outside of Hubei Province, Wenzhou, China. JAMA Netw Open 3 (2020): e206785.
- COVID-19 National Emergency Response Center, Epidemiology and Case Management Team, Korea Centers for Disease Control and Prevention. Coronavirus Disease-19: The First 7,755 Cases in the Republic of Korea. Osong Public Health Res Perspect 11 (2020): 85-90.
- Wang L, Gao Y-H, Lou L-L, et al. The clinical dynamics of 18 cases of COVID- 19 outside of Wuhan, China. Eur Respir J 55 (2020).
- Wang R, Liao C, He H, et al. COVID-19 in Hemodialysis Patients: A Report of 5 Cases. Am J Kidney Dis 76 (2020): 141-143.
- Kang Y-J. Mortality Rate of Infection With COVID-19 in Korea From the Perspective of Underlying Disease. Disaster Med Public Health Prep (2020): 1-3.
- Korean Society of Infectious Diseases and Korea Centers for Disease Control and Prevention. Analysis on 54 Mortality Cases of Coronavirus Disease 2019 in the Republic of Korea from January 19 to March 10, 2020. J Korean Med Sci 35 (2020): e132.
- Chu J, Yang N, Wei Y, et al. Clinical characteristics of 54 medical staff with COVID-19: A retrospective study in a single center in Wuhan, China. J Med Virol 92 (2020): 807-813.
- Lescure F-X, Bouadma L, Nguyen D, et al. Clinical and virological data of the first cases of COVID-19 in Europe: a case series. Lancet Infect Dis 20 (2020): 697-706.
- Guo T, Fan Y, Chen M, et al. Cardiovascular Implications of Fatal Outcomes of Patients With Coronavirus Disease 2019 (COVID-19). JAMA Cardiol (2020).
- Liu K, Chen Y, Lin R, et al. Clinical features of COVID-19 in elderly patients: A comparison with young and middle-aged patients. J Infect 80 (2020): e14-e18.
- Zhang L, Zhu F, Xie L, et al. Clinical characteristics of COVID-19-infected cancer patients: a retrospective case study in three hospitals within Wuhan, China. Ann Oncol 31 (2020): 894-901.
- Chen T, Wu D, Chen H, et al. Clinical characteristics of 113 deceased patients with coronavirus disease 2019: retrospective study. BMJ 368 (2020): m1091.
- Lian J, Jin X, Hao S, et al. Analysis of Epidemiological and Clinical features in older patients with Corona Virus Disease 2019 (COVID-19) out of Wuhan. Clin Infect Dis (2020).
- Shi S, Qin M, Shen B, et al. Association of Cardiac Injury With Mortality in Hospitalized Patients With COVID-19 in Wuhan, China. JAMA Cardiol (2020).
- Sun Y, Koh V, Marimuthu K, et al. Epidemiological and Clinical Predictors of COVID-19. Clin Infect Dis (2020).
- Jin X, Lian J-S, Hu J-H, Gao J, Zheng L, Zhang Y-M, et al. Epidemiological, clinical and virological characteristics of 74 cases of coronavirus-infected disease 2019 (COVID-19) with gastrointestinal symptoms. Gut 69 (2020): 1002-1009.
- Deng Y, Liu W, Liu K, et al. Clinical characteristics of fatal and recovered cases of coronavirus disease 2019 in Wuhan, China: a retrospective study. Chin Med J 133 (2020): 1261-1267.
- Ding Q, Lu P, Fan Y, et al. The clinical characteristics of pneumonia patients coinfected with 2019 novel coronavirus and influenza virus in Wuhan, China. J Med Virol (2020).
- Ye G, Pan Z, Pan Y, et al. Clinical characteristics of severe acute respiratory syndrome coronavirus 2 reactivation. J Infect 80 (2020): e14-e17.
- Arentz M, Yim E, Klaff L, et al. Characteristics and Outcomes of 21 Critically Ill Patients With COVID-19 in Washington State. JAMA (2020).
- Chen J, Qi T, Liu L, et al. Clinical progression of patients with COVID-19 in Shanghai, China. J Infect 80 (2020): e1-e6.
- Gao Y, Li T, Han M, et al. Diagnostic utility of clinical laboratory data determinations for patients with the severe COVID-19. J Med Virol 92 (2020): 791-796.
- Qian G-Q, Yang N-B, Ding F, et al. Epidemiologic and clinical characteristics of 91 hospitalized patients with COVID-19 in Zhejiang, China: a retrospective, multi-centre case series. QJM 113 (2020): 474-481.
- Han R, Huang L, Jiang H, et al. Early Clinical and CT Manifestations of Coronavirus Disease 2019 (COVID-19) Pneumonia. AJR Am J Roentgenol (2020): 1-6.
- Wang Z, Yang B, Li Q, et al. Clinical Features of 69 Cases with Coronavirus Disease 2019 in Wuhan, China. Clin Infect Dis (2020).
- Xu T, Chen C, Zhu Z, Cui M, Chen C, Dai H, et al. Clinical features and dynamics of viral load in imported and non-imported patients with COVID-19. Int J Infect Dis 2020;94:68–71. https://doi.org/10.1016/j.ijid.2020.03.022.
- Cheng Z, Lu Y, Cao Q, et al. Clinical Features and Chest CT Manifestations of Coronavirus Disease 2019 (COVID-19) in a Single-Center Study in Shanghai, China. AJR Am J Roentgenol 215 (2020): 121-126.
- Wu C, Chen X, Cai Y, et al. Risk Factors Associated With Acute Respiratory Distress Syndrome and Death in Patients With Coronavirus Disease 2019 Pneumonia in Wuhan, China. JAMA Intern Med (2020).
- Zhu W, Xie K, Lu H, et al. Initial clinical features of suspected coronavirus disease 2019 in two emergency departments outside of Hubei, China. J Med Virol (2020).
- Liu K-C, Xu P, Lv W-F, et al. CT manifestations of coronavirus disease-2019: A retrospective analysis of 73 cases by disease severity. Eur J Radiol 126 (2020): 108941.
- Chen Q, Quan B, Li X, et al. A report of clinical diagnosis and treatment of nine cases of coronavirus disease 2019. J Med Virol 92 (2020): 683-687.
- Zhou F, Yu T, Du R, et al. Clinical course and risk factors for mortality of adult inpatients with COVID-19 in Wuhan, China: a retrospective cohort study. The Lancet 395 (2020): 1054-1062.
- Hu Z, Song C, Xu C, et al. Clinical characteristics of 24 asymptomatic infections with COVID-19 screened among close contacts in Nanjing, China. Sci China Life Sci 63 (2020): 706-711.
- Ruan Q, Yang K, Wang W, et al. Correction to: Clinical predictors of mortality due to COVID-19 based on an analysis of data of 150 patients from Wuhan, China. Intensive Care Med 46 (2020): 1294-1297.
- Gautret P, Lagier J-C, Parola P, et al. Clinical and microbiological effect of a combination of hydroxychloroquine and azithromycin in 80 COVID-19 patients with at least a six-day follow up: A pilot observational study. Travel Med Infect Dis 34 (2020): 101663.
- Zheng F, Tang W, Li H, et al. Clinical characteristics of 161 cases of corona virus disease 2019 (COVID-19) in Changsha. Eur Rev Med Pharmacol Sci 24 (2020): 3404-3410.
- Spiteri G, Fielding J, Diercke M, et al. First cases of coronavirus disease 2019 (COVID-19) in the WHO European Region, 24 January to 21 February 2020. Euro Surveill 25 (2020).
- Wu J, Liu J, Zhao X, et al. Clinical Characteristics of Imported Cases of COVID-19 in Jiangsu Province: A Multicenter Descriptive Study. Clin Infect Dis (2020).
- Guan W-J, Ni Z-Y, Hu Y, et al. Clinical Characteristics of Coronavirus Disease 2019 in China. N Engl J Med 382 (2020): 1708-1720.
- Xu X, Yu C, Qu J, et al. Imaging and clinical features of patients with 2019 novel coronavirus SARS-CoV-2. Eur J Nucl Med Mol Imaging 47 (2020): 1275-1280.
- Huang Y, Tu M, Wang S, et al. Clinical characteristics of laboratory confirmed positive cases of SARS-CoV-2 infection in Wuhan, China: A retrospective single center analysis. Travel Med Infect Dis (2020): 101606.
- Tian S, Hu N, Lou J, et al. Characteristics of COVID-19 infection in Beijing. J Infect 80 (2020): 401-406.
- Yang W, Cao Q, Qin L, et al. Clinical characteristics and imaging manifestations of the 2019 novel coronavirus disease (COVID-19): A multi- center study in Wenzhou city, Zhejiang, China. J Infect 80 (2020): 388-393.
- Xu Y-H, Dong J-H, An W-M, et al. Clinical and computed tomographic imaging features of novel coronavirus pneumonia caused by SARS- CoV-2. J Infect 80 (2020): 394-400.
- Shi H, Han X, Jiang N, et al. Radiological findings from 81 patients with COVID-19 pneumonia in Wuhan, China: a descriptive study. Lancet Infect Dis 20 (2020): 425-434.
- Yang X, Yu Y, Xu J, et al. Clinical course and outcomes of critically ill patients with SARS-CoV-2 pneumonia in Wuhan, China: a single-centered, retrospective, observational study. Lancet Respir Med 8 (2020): 475-481.
- Qin C, Liu F, Yen T-C, et al. 18F-FDG PET/CT findings of COVID-19: a series of four highly suspected cases. Eur J Nucl Med Mol Imaging 47 (2020): 1281-1286.
- Zhang J-J, Dong X, Cao Y-Y, et al. Clinical characteristics of 140 patients infected with SARS-CoV-2 in Wuhan, China. Allergy (2020).
- Zhang X, Cai H, Hu J, et al. Epidemiological, clinical characteristics of cases of SARS-CoV-2 infection with abnormal imaging findings. Int J Infect Dis 94 (2020): 81-87.
- Parveen R, Sehar N, Bajpai R, et al. Association of diabetes and hypertension with disease severity in covid-19 patients: A systematic literature review and exploratory meta-analysis. Diabetes Research and Clinical Practice 166 (2020).
- Koh J, Shah SU, Chua PEY, et al. Epidemiological and Clinical Characteristics of Cases During the Early Phase of COVID-19 Pandemic: A Systematic Review and Meta-Analysis. Front Med 7 (2020).
- Espinosa OA, Zanetti A dos S, Antunes EF, et al. Prevalence of comorbidities in patients and mortality cases affected by SARS-CoV2: a systematic review and meta-analysis. Rev Inst Med Trop Sao Paulo 62 (2020): e43.
- Li J, He X, Yuan Yuan, et al. Meta-analysis investigating the relationship between clinical features, outcomes, and severity of severe acute respiratory syndrome coronavirus 2 (SARS-CoV-2) pneumonia. Am J Infect Control (2020).
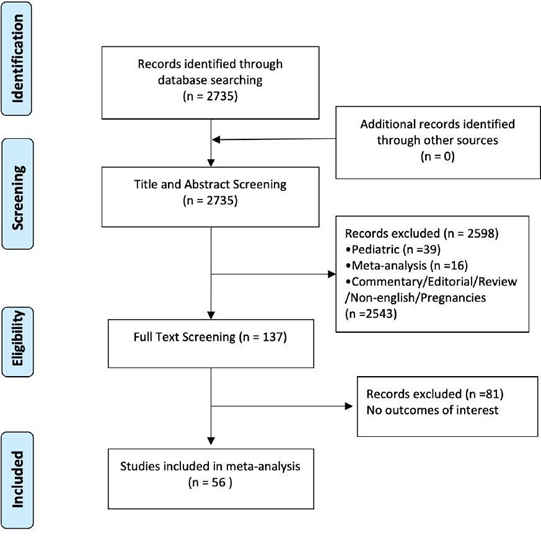
Supplementary Figure 1: Preferred Reporting Items for Systematic Reviews and Meta-analysis (PRISMA).
CAD: Coronary artery disease, COPD: Chronic obstructive pulmonary disease, NR: Not Reported
Supplementary Table 1: Patient demographic data.
|
Study |
Selection |
Outcome |
Total |
|
JIANG 2020 [25] |
*** |
*** |
****** |
|
HUANG Z 2020 [26] |
*** |
*** |
****** |
|
LIU K 2020 [27] |
*** |
*** |
****** |
|
COLANERI 2020 [28] |
*** |
*** |
****** |
|
YAN 2020 [29] |
*** |
*** |
****** |
|
HAN 2020 [30] |
*** |
*** |
****** |
|
JEONG 2020 [31] |
*** |
*** |
****** |
|
WANG L 2020 [32] |
*** |
*** |
****** |
|
WANG R 2020 [33] |
*** |
*** |
****** |
|
KANG 2020 [34] |
*** |
*** |
****** |
|
KSID 2020 [35] |
*** |
*** |
****** |
|
CHU 2020 [36] |
*** |
*** |
****** |
|
LESCURE 2020 [37] |
*** |
*** |
****** |
|
GUO 2020 [38] |
*** |
*** |
****** |
|
LIU K 2020 [39] |
*** |
*** |
****** |
|
ZHANG 2020 [40] |
*** |
*** |
****** |
|
CHEN 2020 [41] |
*** |
*** |
****** |
|
LIAN 2020 [42] |
*** |
*** |
****** |
|
SHI 2020 [43] |
*** |
*** |
****** |
|
SUN 2020 [44] |
*** |
*** |
****** |
|
JIN 2020 [45] |
*** |
*** |
****** |
|
DENG 2020 [46] |
*** |
*** |
****** |
|
DING 2020 [47] |
*** |
*** |
****** |
|
YE 2020 [48] |
*** |
*** |
****** |
|
ARENTZ 2020 [49] |
*** |
*** |
****** |
|
CHEN 2020 [50] |
*** |
*** |
****** |
|
GAO 2020 [51] |
*** |
*** |
****** |
|
QIAN 2020 [52] |
*** |
*** |
****** |
|
HAN 2020 [53] |
*** |
*** |
****** |
|
WANG Z 2020 [54] |
*** |
*** |
****** |
|
XU 2020 [55] |
*** |
*** |
****** |
|
CHENG Z 2020 [56] |
*** |
*** |
****** |
|
WU C 2020 [57] |
*** |
*** |
****** |
|
ZHU 2020 [58] |
*** |
*** |
****** |
|
LIU KC 2020 [59] |
*** |
*** |
****** |
|
CHEN Q 2020 [60] |
*** |
*** |
****** |
|
ZHOU 2020 [61] |
*** |
*** |
****** |
|
HU 2020 [62] |
*** |
*** |
****** |
|
RUAN 2020 [63] |
*** |
*** |
****** |
|
GAUTRET 2020 [64] |
*** |
*** |
****** |
|
ZHENG 2020 [65] |
*** |
*** |
****** |
|
SPITERI 2020 [66] |
*** |
*** |
****** |
|
WU J 2020 [67] |
*** |
*** |
****** |
|
GUAN 2020 [68] |
*** |
*** |
****** |
|
XU X 2020 [69] |
*** |
*** |
****** |
Supplementary Table 2: The Newcastle-Ottawa Quality Assessment Scale of included studies.
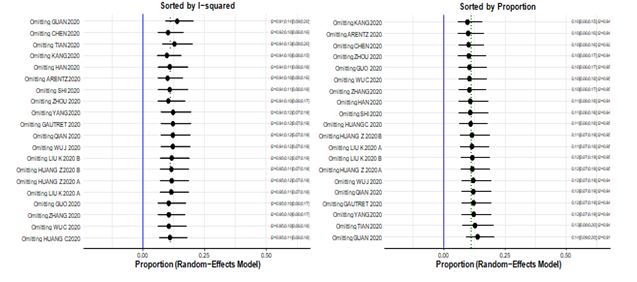
Supplementary Figure 2: Leave-one-out analysis.
|
Outcome |
N. of Studies |
Effect |
95% CI |
Heterogeneity: I2, p-value |
|
Age |
43 |
49.65 yrs |
46.85 – 52.62 yrs |
99.7%, p=0 |
|
Female gender |
50 |
46.79% |
44.48% - 49.11% |
56.6%, p<0.0001 |
|
Smoking |
12 |
10.96% |
7.35% - 16.02% |
82.0%, p<0.0001 |
|
Hypertension |
29 |
24.47% |
19.85% - 29.77% |
88.4%, p<0.0001 |
|
Cardiac comorbidity |
17 |
20.30% |
9.43% - 38.40% |
97.5%, p<0.0001 |
|
Diabetes |
34 |
12.34% |
9.96% - 15.20% |
79.1%, p<0.0001 |
|
CAD |
18 |
5.44% |
3.50% - 8.38% |
83.6%, p<0.0001 |
|
COPD |
22 |
3.69% |
2.09% - 6.42% |
85.8%, p<0.0001 |
|
Liver disease |
16 |
3.08% |
2.12% - 4.47% |
40.2%, p=0.0488 |
|
History of cancer |
21 |
3.75% |
2.17% - 6.41% |
84.0%, p<0.0001 |
CAD = Coronary artery disease; COPD = Chronic obstructive pulmonary disease; yrs = years
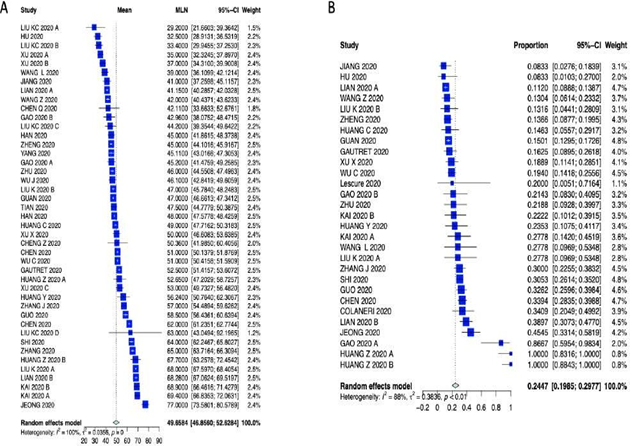
Supplementary Table 3: Meta-analysis outcome summary of patient characteristics.
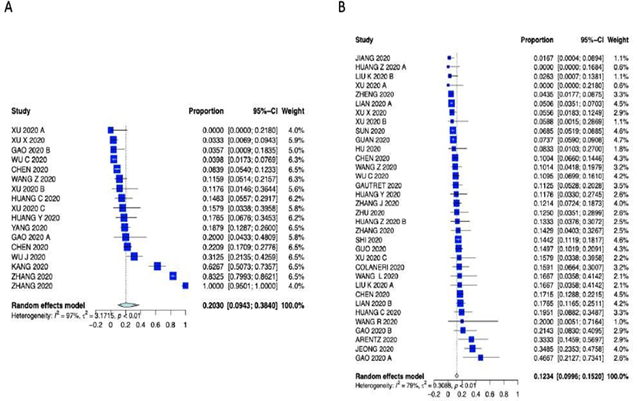
Supplementary Figure 4: Forest plot for A) Cardiac comorbidity and B) Diabetes.
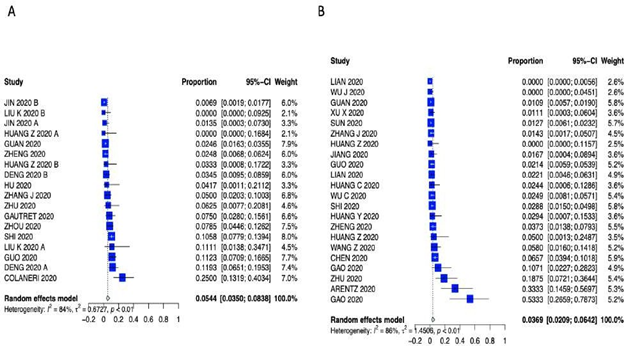
Supplementary Figure 5: Forest plot for A) Coronary Artery Disease and B) Chronic Obstructive Pulmonary Disease.
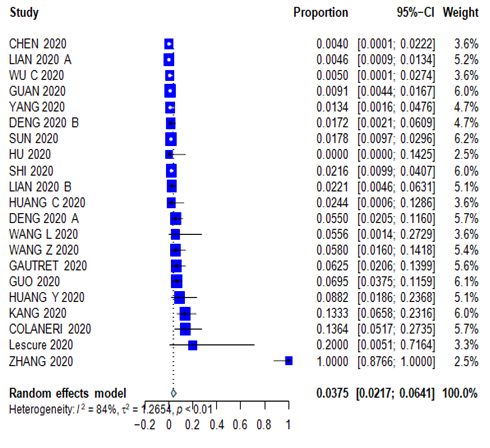
Supplementary Figure 6: Forest plot for History of Cancer.
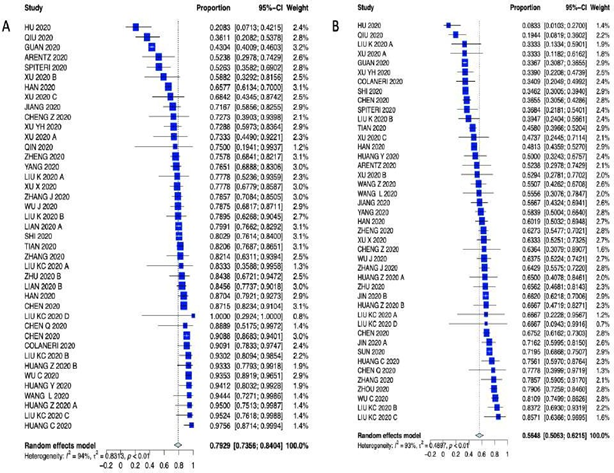
Supplementary Figure 7: Forest plot of A) Fever and B) Cough.
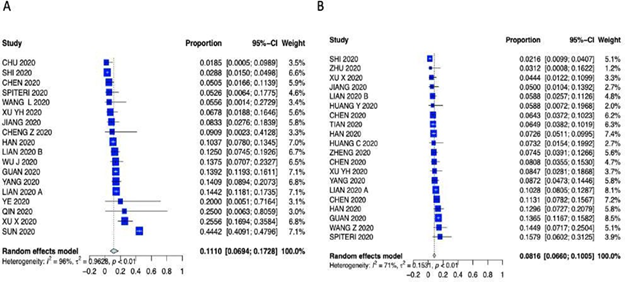
Supplementary Figure 8: Forest plot of A) Sore throat and B) Headache.
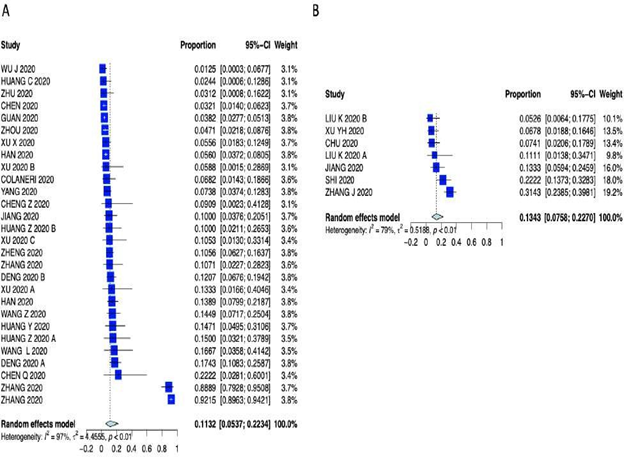
Supplementary Figure 9: Forest plot of A) Diarrhea and B) Chest Pain.
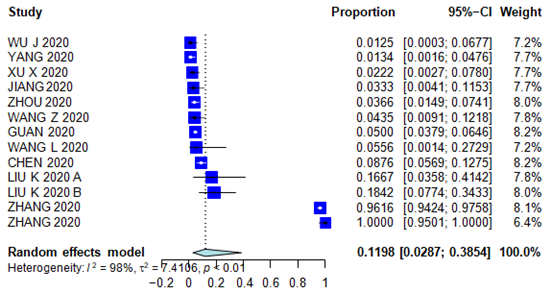
Supplementary Figure 10: Forest plot for Vomiting.
|
First Author/ year |
Studies |
Outcome |
Type of Effect |
Results |
|
PARVEEN 2020 [79] |
7 |
Comorbidities |
odds ratio (severe vs. nonsevere; ICU care vs non-ICU care; survivor vs non-survivors) |
Diabetes was lower in the survivors (OR: 0.56; p = 0.017) and non-severe (OR: 1.66; p = 0.002) patients. No association of diabetes was found with ICU care. Hypertension was positively associated with death (OR: 0.49; p<0.001; I2: 0.0%), ICU care (OR: 0.42; p = 0.009) and severity (OR: 2.69; p = 0.01) |
|
KOH 2020 [80] |
29 |
Symptoms, comorbidities |
pooled prevalence/effect estimate |
The most common symptoms at admission were fever, cough and fatigue, with a pooled prevalence of 90% (95% CI: 81–97%), 58% (95% CI: 47–68%), and 50% (95% CI: 29–71%), respectively. Myalgia, shortness of breath, headache, diarrhea and sore throat were less common with pooled prevalence of 27% (95% CI: 20– 36%), hypertension (17%, 95% CI: 7–28%), diabetes (10%, 95% CI: 6–15%), and cardiovascular disease (12%, 95% CI: 3–23%) |
|
ESPINOSA 2020 [81] |
39 |
Comorbidities |
pooled prevalence/effect estimate |
Hypertension was the most prevalent in 32% (95% CI: 31-33; weight 6.54%), followed by diabetes 22% (95% CI: 21-23; weight 6.57%), heart disease 13% (95% CI: 13-14; weight 6.62%), and COPD 8% (95% CI: 7-8; weight 6.65%) |
|
SINGH 2020 [19] |
18 |
Comorbidities |
pooled prevalence/ effect estimate |
22.9% (95% CI: 15.8 to 29.9) for hypertension; 11.5% (9.7 to 13.4) for diabetes; and 9.7% (6.8 to 12.6) for CVD |
|
LI 2020 [82] |
12 |
Comorbidities |
odds ratio (severe vs. nonsevere) |
Including chronic obstructive pulmonary disease (OR = 5.08, 95% CI: 2.68-9.63), diabetes (OR = 3.17, 95% CI: 2.26-4.45), hypertension (OR = 2.40, 95% CI: 1.47-3.90), coronary heart disease (OR = 2.66, 95% CI: 1.71-4.15), malignancy (OR = 2.21, 95% CI: 1.04-4.72), chronic liver disease (P = .192) |
COPD: Chronic Obstructive Pulmonary Disease, CVD: cardiovascular disease, ICU: Intensive care unit, OR: Odds Ratio.
Supplementary Table 4: Results from the latest COVID-19 related published meta-analysis.
|
Study |
Meta-regression Variable |
Meta-regression Outcome |
|
PRANATA 2020 [22] |
Hypertension/Mortality |
Hypertension was associated with increased composite poor outcome (risk ratio (RR) 2.11 (95% confidence interval (CI) 1.85, 2.40), p < 0.001; I2, 44%) and its sub-group, including mortality (RR 2.21 (1.74, 2.81)), severe COVID-19 (RR 2.04 (1.69, 2.47)) |
|
HUANG 2020 [23] |
Diabetes/Mortality |
Diabetes was associated with composite poor outcome (RR 2.38 [1.88, 3.03]) and its subgroup which comprised of mortality (RR 2.12 [1.44, 3.11]), severe COVID-19 (RR 2.45 [1.79, 3.35]) |
|
PRANATA 2020 [24] |
Cardiovascular Disease and Cerebrovascular Disease/ Mortality |
Cardiovascular disease was associated with increased composite poor outcome (RR 2.23 [1.71,2.91]), mortality (RR 2.25 [1.53,3.29], p<0.001; I2: 33%) and severe COVID-19 (RR 2.25 [1.51,3.36]). Cerebrovascular disease was associated with an increased composite poor outcome (RR 2.04 [1.43,2.91]). Subgroup analysis revealed that cerebrovascular disease was associated with mortality (RR 2.38 [1.92,2.96]) and showed borderline significance for severe COVID-19 (RR 1.88 [1.00,3.51]). |
Supplementary Table 5: Prior meta-analysis meta-regression.
