Effect of Dissolved Oxygen Content on Photocatalytic Performance of Graphene Oxide
Article Information
M Bakhtiar Azim1, Md Intaqer Arafat1*, Farzana Nargis2, Sajib Aninda Dhar3, Md. Rakibul Qadir3, Md. Abdul Gafur3, Fahmida Gulshan1
1Department of Materials and Metallurgical Engineering, Faculty of Engineering, Bangladesh University of Engineering and Technology, Dhaka-1000, Bangladesh
2Department of Chemical Engineering, Faculty of Engineering, Bangladesh University of Engineering and Technology, Dhaka-1000, Bangladesh
3Pilot Plant and Process Development Center, Bangladesh Council of Scientific and Industrial Research (PP and PDC, BCSIR), Dhaka-1205, Bangladesh
*Corresponding author: Md Intaqer Arafat, Department of Materials and Metallurgical Engineering, Faculty of Engineering, Bangladesh University of Engineering and Technology, Dhaka-1000, Bangladesh.
Received: 22 January 2024; Accepted: 29 January 2024; Published: 01 February 2024
Citation: M Bakhtiar Azim, Md Intaqer Arafat, Farzana Nargis, Sajib Aninda Dhar, Md. Rakibul Qadir, Md. Abdul Gafur, Fahmida Gulshan. Effect of Dissolved Oxygen Content on Photocatalytic Performance of Graphene Oxide. Journal of Nanotechnology Research. 6 (2024): 06-15.
View / Download Pdf Share at FacebookAbstract
Graphene is a two-dimensional carbon-based photocatalyst that shows great promise. This study compared the photocatalytic degradation of a new organic dye, Methylene Blue (MB), using graphene oxide (GO) to traditional water treatment procedures such as ion exchange and adsorption. In this study, the photocatalytic activity of GO and hydrogen peroxide (H2O2) was assessed by photodegrading Methylene Blue (MB) in an aqueous solution. The resultant GO nanoparticles were examined using X-ray powder diffraction (XRD), scanning electron microscopy (SEM), energy dispersive spectroscopy (EDX), and Fourier Transform Infrared Ray Spectroscopy (FTIR). The XRD data verifies the strong peak centered at 2θ≈10.44°, corresponding to the (002) reflection of GO. Our study found that GO nanoparticles and H2O2 achieved ~92% photo decolorization of MB, compared to ~63% for H2O2 under natural sunshine irradiation at pH~7 in 60 minutes. Furthermore, the influence of dissolved oxygen (DOC) and H2O2 on MB degradation was studied. The experimental results showed that oxygen was a decisive factor in enhancing photocatalytic degradation. Direct photocatalysis (MB/GO) and H2O2-assisted photocatalysis (MB/H2O2/GO) resulted in an increase in the degradation rate constant (k1) from 0.019 to 0.042 min−1 for DOC 3.5 mgL−1. In this case, H2O2 worked as an electron and hydroxyl radical (•OH) scavenger; however, the addition of H2O2 should be at the right dose to increase MB breakdown. Increasing the initial DOC content from 2.8 to 3.9 mgL−1 resulted in an increase in the degradation rate constant (k1) from 0.035 to 0.062 min−1. The photodegradation mechanism and kinetics were investigated for both direct and H2O2-assisted photocatalysis.
Keywords
Graphene Oxide; Hydrogen Peroxide; Methylene Blue; Dye; Photodegradation; sunlight
Graphene Oxide articles; Hydrogen Peroxide articles; Methylene Blue articles; Dye articles; Photodegradation articles; Sunlight articles
Article Details
Introduction
When the stable and carcinogenic azo dyes are discharged into water bodies they cause illnesses such as cholera, diarrhea, hypertension, precordial pain, dizziness, fever, nausea, vomiting, abdominal pain, bladder irritation, staining of skin [1]. Dyes also affect aquatic life by hindering the photosynthesis process of aquatic plants [2,3]. Therefore, numerous techniques have been applied to treat textile wastewater, such as activated carbon adsorption (physical method), chlorination (chemical method), and aerobic biodegradation (biochemical method) [4]. However, the problems of these techniques are they create secondary pollution in the environment, such as the breakdown of parent cationic dyes to Benzene, NO2, CO2, and toxic gases like SO2 [5]. Advanced oxidation processes (AOPs) are widely applied to mineralize dyes into CO2 and H2O [6,7]. The available conventional water treatment processes such as ion exchange, coagulation, or adsorption had shown promise at the early stages. However, they are limited somehow. During the adsorption water treatment, the Pollutants are agglomerated due to phase transferring and the complete removal of the Pollutants is inevitable [8]. The ion exchange method is efficient in the complete elimination of the ionic substances. However, they are limited in removing the organic Pollutants. Again, these processes aren’t economically feasible because of their comparatively higher operational cost and the high initial investment [9]. Photocatalytic degradation was initiated when the photocatalysts absorb photons (UV) to generate electron-hole pairs on the catalyst surface. The positive hole in the valence band (hVB+) will react with water to form hydroxyl radical (●OH), followed by the oxidization of pollutants to CO2 and H2O [10]. Methylene Blue (MB), also known as Swiss Blue, is an azo dye (Table 1). MB is widely used in textile industries for dye processing, and up to 50% of the dyes consumed in textile industries are azo dyes [10-12]. In the past few years, several catalysts have been used to degrade MB, such as BiFeO3 [4], TiO2 [5], Ag+/TiO2 [13], and MnTiO3 [14], and the results were summarized in (Table 2).
|
Properties |
Cationic Azo Dye |
|
Synonym name |
Swiss Blue |
|
Molecular formula |
C16H18ClN3S |
|
Molecular weight |
319.851 g/mol |
|
Absorbance wavelength(lmax) |
664 nm |
|
Molecular structure |
 |
Table 1: Properties of Methylene Blue (MB).
|
Authors/Year |
Catalysts |
Degradation efficiency (%) |
Conditions |
References |
|
Soltani et al. 2014 |
BiFeO3 |
100% MB |
Time: 80 min; Catalyst loading: 0.5 g/L-1; Irradiation: Natural Sunlight; pH 2.5 |
[4] |
|
Dariani et al. 2016 |
TiO2 |
100% MB |
Time: 2 hr; Catalyst loading: 0.5 g/L-1 ; Irradiation: UV light; pH 2.5 |
[5] |
|
Chittaranjan et. al. 2012 |
Ag+/TiO2 |
99% MB |
Time: 180 min |
[13] |
|
Catalyst loading: 2 g/l, |
||||
|
Irradiation: UV light |
||||
|
Suhila et. Al 2020 |
MnTiO3 |
70% MB |
Time: 240 |
[14] |
|
Catalyst Loading: 0.1 g/l |
||||
|
Irradiation: Natural sunlight |
||||
|
pH: 6.4 |
Table 2: The photocatalytic degradation of MB using several catalysts.
Graphene-based photocatalysts have received considerable attention in recent years [15,16]. A common strategy to design such photocatalysts is to combine some graphene-based materials with semiconductors, such as TiO2, to form nanocomposite photocatalysts. It is believed that this approach promotes the flow of electrons from semiconducting photocatalysts to graphene-based materials upon photoexcitation, thereby inhibiting the electron−hole pair recombination and increasing the photocatalysis efficiency [15,16]. However, in such a system, the hydroxyl radical (●OH) produced during photocatalysis may react with certain graphene materials to result in rapid decomposition of the latter [17-19].
GO, structurally analogous to graphene, possesses an apparent bandgap because of its association with a range of oxygen-containing groups [20-22]. Although GO possesses some interesting properties similar to semiconducting materials [20,23,24] its sole use in photocatalysis has not been well explored. Recent studies by Yeh et al. demonstrated that GO can photo-catalyze the splitting of water to generate a considerable amount of H2 [25-27]. Hsu et al. reported a possible conversion of CO2 to methanol using GO as the photocatalyst [28]. These studies suggest that GO alone may act as a potential photocatalyst. GO as a carbonaceous, metal-free nanomaterial is also attractive in photocatalysis, as it does not involve expensive noble metals frequently used in photocatalytic systems [29-31]. GO has more oxygen functional groups than reduced graphene oxide (rGO) and a surface area of 736.6 m2/g [32] compared to 400 m2/g [33] for graphite. Numerous methods have been used in the synthesis of GO, such as chemical, thermal, microwave, and microbial/bacterial [34]. Chemical exfoliation is preferred for its large-scale manufacturing and inexpensive cost. Chemical exfoliation involves three steps, oxidation of graphite powder, dispersion of graphite oxide (GTO) to graphene oxide (GO), and GTO exfoliation by ultrasonication to produce graphene oxide (GO) [35]. GO, with its unique electronic properties, large surface area, and high transparency, contributes to facile charge separation and absorptivity in its structure. As a potential photocatalytic material, GO has been used in the decolorization of Methylene Blue and Rhodamine B [36]. H2O2 is a clean oxidant as well as a fuel that generates O2 and H2O upon decomposition [37,38]. It has wide applications including fuel cells, organic synthesis, bleaching agents, and advanced oxidation processes (AOPs) such as the Fenton reaction (Fe2+/H2O2) and UV 254 nm/H2O2 for generating ●OH for pollution removal and disinfection [37,38]. Hou et al. showed that dissolved oxygen played a pivotal role in the photoproduction of H2O2 by GO and that superoxide (O2●−) was not involved.
In this investigation, a facile method to prepare GO nanoparticles has been reported which were synthesized via chemical oxidation. The photocatalytic performances of the prepared GO and GO with H2O2 were evaluated in the degradation of a model organic dye, methylene blue (MB) in an aqueous solution under sunlight. To the best of our knowledge, detailed investigations on catalyst loading, initial dye concentration, and initial solution pH are still lacking. This study aims to determine the optimum experimental conditions for the best photo decolorization performance.
Experimental Section
Chemicals and Materials
Graphite powder and Sodium Nitrate were purchased from Sigma Aldrich (Steinheim, Germany). Sulfuric acid (98%) was obtained from Merck (Darmstadt, Germany). Potassium permanganate, Hydrochloric acid (37%), and Hydrogen Peroxide (30%) were also purchased from Sigma Aldrich (Steinheim, Germany). The chemicals were used without further purification. Methylene Blue (MB) powder from Sigma-Aldrich (Steinheim, Germany) was used as the model compound in this study. Deionized water was used throughout the experiments.
Synthesis of Graphene Oxide (GO)
Graphene oxide was produced by the modified Hummers’ method by oxidizing the graphite powder [21]. In a typical synthesis, 3g of graphite powder and 1.5g NaNO3 were mixed with 69 ml H2SO4 (conc. 98%) in a beaker. Then, 9g of KMnO4 was slowly added and stirred in an ice-bath for 1 h below 20°C. Then the mixture was heated to 35°C and kept stirring for 2 hrs. Then, an oil bath was maintained at a temperature of 95°C~98°C . After that the beaker was placed in the oil bath for 15 minutes and 150 ml Deionized water was added slowly while stirring. After cooling the mixture to room temperature, again an oil bath was set at a temperature of 60°C and maintained and the beaker was kept in the oil bath for additional 60 minutes at a constant temperature of 60°C. Then 150 ml Deionized water was slowly added in the beaker while stirring. Finally, dropwise addition of 30 ml (30%) H2O2 was made and stirred for 2 hrs. Then washing, filtration and centrifugation were performed until removal of Cl- ions by using Deionized water. Finally, the resulting precipitate was dried at 70°C for 24 hours in an oven giving thin sheets which was Graphite Oxide (GTO). Graphite Oxide was made into a fine powder form by grinding in a crucible and then GTO powder was finely dispersed in Deionized Water. Then, ultrasonication was carried out for the complete exfoliation of GTO to GO.
Characterization and Analytical Method
The X-ray diffraction pattern of GO was recorded by a Bruker, D8 Advance diffractometer (Germany). The sample was scanned from 5° to 80° using Cu Ka radiation source (l = 1.5406 A°) at 40 kV and 30 mA with a scanning speed of 0.01°s-1. The surface morphology of GO was observed by FESEM-JEOL (FEG-XL 30S) Field Emission Scanning Electron microscope (FESEM). FTIR spectra of GO was recorded by an Agilent Cary 670 FTIR spectrometer. The photodegradation percentage of MB was determined by using an ultraviolet-visible spectrophotometer (Shimadzu-UV-1601) at lmax = 664 nm and wavelength region between 400 and 800 nm. DI water was used as a reference material. The DO concentration was measured using an oxygen membrane electrode (Oxi 320, WTW).
Photocatalytic Reaction
Photocatalytic experiments were carried out by photodegrading MB using UV-Vis spectroscopy. The solution of MB (pH~7) without GO was left in a dark place for 60 min. Then, the dye solution was exposed to sunlight irradiation and there was no decrease in the concentration of dye. In a typical experiment, 7.5 mg of GO was added into a 100 mL 0.05 mM MB solution. Before illumination, the suspensions were continuously stirred at dark place for 60 min to reach an adsorption-desorption equilibrium between the photocatalyst and MB. Then, the suspensions were exposed to sunlight irradiation for another 60 mints and samples were taken at regular time intervals (0 min, 10 min, 15 min, 30 min, 45 min, and 60 min) and filtered to remove the GO. Where required, the initial pH of solution (pH~7) was adjusted by small amount of 0.1 M NaOH and 0.1 M HCl. Photodegradation was also observed for 0.05 mM MB solution using only H2O2 and GO along with H2O2. The decolorization efficiency of MB was determined by using the equation shown below:
Photodegradation efficiency (%)
= [(C0 - Ct) / C0] ´100% (1)
= [(A0 - At) / A0] ´ 100% [According to ‘Beer-Lambert Law’]
Where, C0 is the initial concentration of MB, Ct is the concentration of MB at time, t and A0 is the initial absorbance of MB, At is the absorbance of at time, t.
Results and Discussions
Characterization of GO
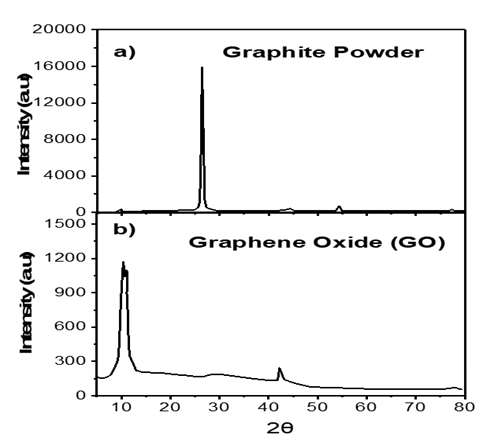
The powder X-ray diffraction pattern of GO shows a broadened diffraction peak ((Figure 1(b)) at around 2q»10.44°, which corresponds to the (002) reflection of stacked GO sheets.
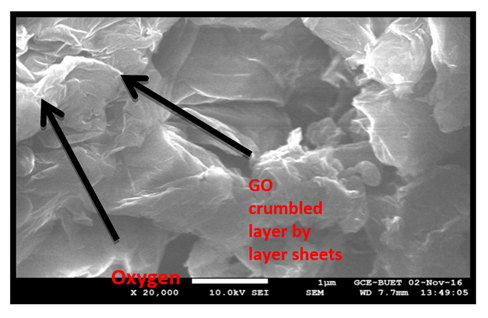
SEM images of GO structure with different magnifications are shown in (Figure 2). SEM images of GO shows the crumbled sheet of GO layers.
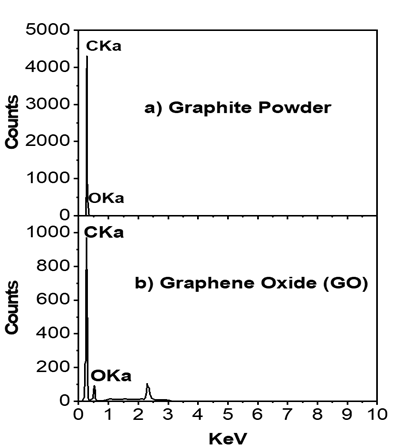
EDX studies are generally carried out to test the elemental composition and purity of the sample by giving us the details of all the elements present in the given sample. The EDX spectra and elemental composition of GO is shown in (Figure 3).
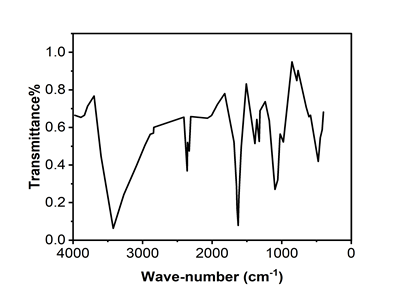
FTIR analysis of GO shows broad absorption spectrum observed at ~3420 cm-1 corresponding O-H stretching vibration indicating existence of absorbed water molecules and structural O-H groups in GO. The broad peak appeared in GO spectrum depicted the presence of O-H & C-H stretching. Besides, a band at 1747 cm-1 might be related to not only the C=O stretching motion of COOH groups situated at the edges and defects of GO lamellae but also that of ketone or quinone groups. The peak near 1700-1550 cm-1 widens and moves to 1565 cm-1 that reflects the presence of un-oxidized aromatic regions (Figure 4).
Photocatalytic Activity of GO
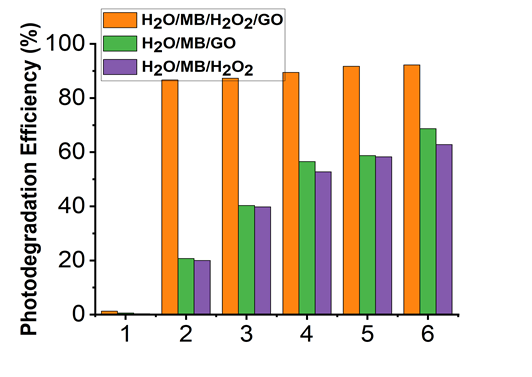
The photocatalytic activity of GO was evaluated by measuring the photodegradation of MB as a function of irradiation time under natural sunlight. MB, having intense absorption at 664 nm. The solution was stirred well and allowed natural sunlight irradiation at regular intervals and the corresponding absorption spectra were measured. MB dye (0.05 mM) was diluted in 100 ml DI water. The photo catalytic degradation of MB was studied after addition of 7.5 mg of GO in 6 ml H2O2 to the 100 ml dye solution using sonication. Irradiation was carried out in volumetric flask under the sunlight. UV-Vis was used to measure absorbance of the dye solution at regular time intervals. Controlled experiments were also carried out to confirm the degradation of MB by UV-Vis. Experiments were repeated for only H2O2 and for only GO. Under natural sunlight irradiation GO along with H2O2 showed 92.23% photodegradation efficiency after 60 min whereas only GO and only H2O2 showed 68.68% and 62.81% respectively (Figure 5).
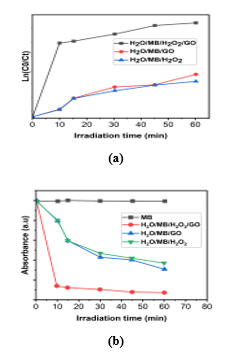
It is clear from Fig. 6(a) and Fig. 6(b) that, GO along with H2O2 as expected showed highest photocatalytic activity compared to that of H2O2. However, only H2O2 and only GO showed lower photocatalytic activity. GO nanoparticles is a catalyst for MB degradation and also H2O2 itself is a catalyst for MB degradation which takes 60 min for almost total degradation when both were used together.
The MB photo degradation was fitted to pseudo-first order kinetics by referring to the Langmuir-Hinshelwood kinetic model ((Equation (2))[39, 40]:
ln(C0/Ct) = kt (2)
Where Ct is the concentration of MB at time, t, C0 is the initial concentration of MB, and k is the pseudo-first order rate constant. The k value of respective concentrations was determined from knowing the values Ct and was listed in Table 3. The correlation co-efficient (R2) values are close to 1, which obeys the pseudo-first order kinetic model.
|
Samples |
Concentration of MB (mM) |
Degradation efficiency (%) |
R2 |
Degradation Rate constant (min 1) |
|
H2O/MB/GO |
0.05 |
68.68% |
0.9297 |
0.01935 |
|
H2O/MB/H2O2 |
0.05 |
62.81% |
0.9064 |
0.01649 |
|
H2O/MB/H2O2/GO |
0.05 |
92.23% |
0.8943 |
0.04258 |
Table 3: Degradation efficiency and pseudo-first order rate constant for photocatalytic degradation of MB by GO, H2O2, GO along with H2O2.
As we can see, the absorbance versus irradiation time curves and ln(C0/Ct) versus natural sunlight irradiation time curves for MB photodegradation are non-linear because of the following probable reasons:
- Absorptivity co-efficient deviations occur when concentration is greater than 0.01mM and due to the electrostatic interactions between molecules in close proximity.
- Scattering of lights due to particulates in the sample.
- Chemical equilibrium shifting as a function of concentration.
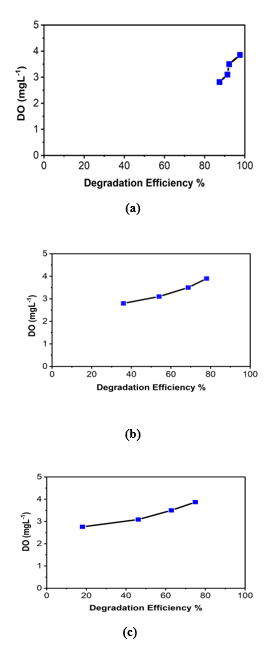
The direct photolysis and the oxidative potential of H2O2 were proven to have a contribution on the degradation of MB. Sunlight, GO and H2O2 together showed a remarkable effect. Increasing the DO concentration was beneficial for the photocatalytic degradation of MB. Correspondingly, the degradation rate constantly increased with the DO concentration. Experimental results demonstrated that degradation efficiency was enhanced by the restraint of the capture of ●OH radicals, the additional ●OH radicals caused from the addition of H2O2, and the participation of oxygen in photocatalytic degradation [41].
It is evident that both degradation efficiency and degradation rate constant (k1) increases remarkably with the increase of DO level for every system (see Table 4, Table 5, Table 6 and Fig 8(a), 8(b) and 8(c)).
|
Samples |
Concentration of MB (mM) |
DO (mgL-1) |
Degradation efficiency (%) |
Degradation Rate constant (min-1) |
|
H2O/MB/H2O2/GO |
0.05 |
2.8 |
87.4% |
0.035 |
|
H2O/MB/H2O2/GO |
0.05 |
3.1 |
91.3% |
0.041 |
|
H2O/MB/H2O2/GO |
0.05 |
3.5 |
92.2% |
0.043 |
|
H2O/MB/H2O2/GO |
0.05 |
3.9 |
97.6% |
0.062 |
Table 4: Degradation efficiency and rate constant for photocatalytic degradation of MB by H2O/MB/H2O2/GO System with the variation of Dissolved Oxygen Concentration (DO).
|
Samples |
Concentration of MB (mM) |
DO (mgL-1) |
Degradation efficiency (%) |
Degradation Rate constant (min-1) |
|
H2O/MB/GO |
0.05 |
2.8 |
36% |
0.0074 |
|
H2O/MB/GO |
0.05 |
3.1 |
54% |
0.013 |
|
H2O/MB/GO |
0.05 |
3.5 |
68.7% |
0.019 |
|
H2O/MB/GO |
0.05 |
3.9 |
78% |
0.025 |
Table 5: Degradation efficiency and rate constant for photocatalytic degradation of MB by H2O/MB/GO System with the variation of Dissolved Oxygen Concentration (DO).
|
Samples |
Concentration of MB (mM) |
DO (mgL-1) |
Degradation efficiency (%) |
Degradation Rate constant (min-1) |
|
H2O/MB/H2O2 |
0.05 |
2.8 |
18% |
0.003 |
|
H2O/MB/H2O2 |
0.05 |
3.1 |
46% |
0.01 |
|
H2O/MB/H2O2 |
0.05 |
3.5 |
62.8% |
0.017 |
|
H2O/MB/H2O2 |
0.05 |
3.9 |
75% |
0.023 |
Table 6: Degradation efficiency and rate constant for photocatalytic degradation of MB by H2O/MB/H2O2 System with the variation of Dissolved Oxygen Concentration (DO).
Mechanism
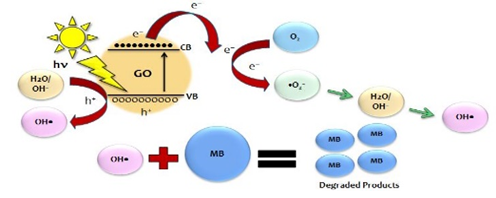
The dye/H2O2/sunlight system involves the photocatalysis of hydrogen peroxide. The most accepted mechanism for this H2O2 photocatalysis is the rupture of the O-O bond by the action of sunlight forming two hydroxyl radicals (●OH) and these radicals in turns degraded MB.
H2O2 + e− → ●OH + OH− (3)
H2O2 + ●O2− → ●OH + OH− + O2 (4)
H2O2 + ●OH → H2O + ●OH2 (5)
HO2● + ●OH → H2O+O2 (6)
H2O2 → H2O + ●O2 (7)
|
hν |
H2O2 → 2●OH (8)
- OH + MB → Degraded Products (9)
The influence of H2O2 dosage on the degradation of MB can be explained in terms of the number of generated ●OH radicals and the capture of ●OH radicals. It is well known that H2O2 can trap photoinduced e− to stabilize the paired electron-hole pair.
Additional ●OH radicals could be yielded via the reaction between H2O2 and e− or ●O2- ((eqs. (3) and (4)). As a result, the addition of H2O2 into the photocatalytic system was expected to promote the degradation of MB. Exceeding the optimum dosage, however, the excess H2O2 would trap the ●OH radicals to form weaker oxidant HO2● radicals. Accordingly, the capture of ●OH radicals was occurred through ((eqn. (5) and (6)). The decline in the ●OH radical concentration, trigged.
by the higher H2O2 dosage, restrained the degradation of MB. Correspondingly, the addition of H2O2 seemed to act as an oxygen source [41]. The mechanism of the photodegradation of MB in presence of GO only under natural sunlight irradiation can be described as follows:
GO + hν → eCB− + hVB+ (10)
Vo●● + eCB− → Vo● (11)
Vo● + O2→Vo●● + ●O2- (12)
e−(oreCB−) + O2→●O2− (13)
hVB+ + OH−→ ●OH (14)
eCB− + hVB+ → Heat (15)
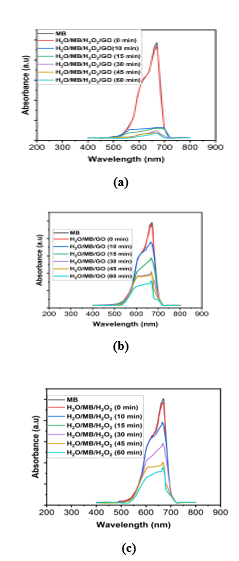
A large amount of oxygen vacancies are present on GO surface. GO serve as an electron and hole source (from eq. 10) for degradation of organic dye; when GO nano materials are irradiated by natural sunlight with energy higher than or equal to the band gap of GO, an electron (eCB−) in the valence band (VB) can be excited to the conduction band (CB) with simultaneous generation of a hole (hVB+) in the VB. Oxygen vacancy defects ((see Vo● and Vo●● in eqs. (11) and (12)) on the surface of GO act as a sink for the electrons and improve the separation of electron–hole pairs generated (in eq.9). The photoelectron can be easily trapped by electronic acceptors like adsorbed O2, to further produce a superoxide radical anion (●O2−) (in eq. 13). The photo induced holes can be easily trapped by OH− to further produce a hydroxyl radical species (●OH) (in eq. 14). The generated superoxide anion radical (●O2−) and hydroxyl radical species (●OH) determine the overall photo catalytic reaction; for example, ●OH is an extremely strong oxidant for the partial or complete mineralization of organic chemicals and/ or dyes like MB. Since the band gap of GO was found as 3.26 eV [42] and when it is excited with an energy gap higher than the band gap energy, the electron and hole pairs will be the generated at the surface of GO. The defect sites in GO can act as trapping centers for the excited carriers and thereby hinder the recombination process. MB molecule, which acts as an electron acceptor, readily accepts the photoexcited electrons resulting in the degradation of MB molecules. This is well supported with our results of UV-Vis spectra as shown in Figure 6(a), Figure 6(b) and Figure 6(c).
In summary, GO nanostructures were synthesized by modified Hummer’s method. XRD and FTIR studies reveal the existence of oxygenated functional groups in the GO. The degradation of MB by the GO nanostructures under sunlight irradiation was a pseudo first order reaction. The photo excited electrons from the surface state of GO under natural sunlight was responsible for the degradation of MB. Our experimental results demonstrated that GO nanostructures have promising applications in photocatalysis.
Conclusion
Degradation of Methylene Blue under sunlight with GO nanoparticles as a catalyst takes around 60 min for almost total degradation when used with H2O2 as a positive catalyst. It can be used either alone or in combination with H2O2. H2O2 to activate the GO may also be used to speed up catalytic reactions for complete degradation. By increasing the quantity of GO, degradation time decreases under natural sunlight. GO and H2O2 can also be used individually for photo catalytic degradation of high concentration of Methylene Blue. Under natural sunlight irradiation GO along with H2O2 showed ~92% photodegradation efficiency after 60 min whereas only GO and only H2O2 showed ~69% and ~63% respectively. With the increase of initial concentration of dissolved oxygen (DO) from 2.8 to 3.9 mgL−1, both degradation efficiency and rate constant increased markedly. Experimental study showed that the correlation co-efficient (R2) values were close to 1, which obeyed the pseudo-first order kinetic model. The mechanism also described the whole photodegradation process in brief.
Conflicts of Interests
There are no conflicts to declare.
Acknowledgment
This work was supported by Department of Materials and Metallurgical Engineering (MME, BUET), The PP & PDC, BCSIR (Pilot Plant and Process Development Center, Bangladesh Council of Scientific and Industrial Research), Department of Glass and Ceramics Engineering (GCE, BUET) and Department of Chemistry, BUET.
References
- KM Lee, SBA Hamid, CW Lai. Multivariate analysis of photocatalytic-mineralization of Eriochrome Black T dye using ZnO catalyst and UV irradiation. Materials Science in Semiconductor Processing 39 (2015): 40-48.
- M Meeti, T Sharma. Photo catalytic degradation of two commercial dyes in aqueous phase using photo catalyst TiO2. Advances in Applied Science Research 3 (2012): 849-853.
- M Vinothkannan, C Karthikeyan, AR Kim, et al. One-pot green synthesis of reduced graphene oxide (RGO)/Fe3O4 nanocomposites and its catalytic activity toward methylene blue dye degradation. Spectrochimica Acta Part A: Molecular and Biomolecular Spectroscopy 136 (2015): 256-264.
- T Soltani, MH Entezari. Photolysis and photocatalysis of methylene blue by ferrite bismuth nanoparticles under sunlight irradiation. Journal of Molecular Catalysis A: Chemical 377 (2013): 197-203.
- R Dariani, A Esmaeili, A Mortezaali, et al. Photocatalytic reaction and degradation of methylene blue on TiO2 nano-sized particles. Optik 127 (2016): 7143-7154.
- SHS Chan, T Yeong Wu, JC Juan, et al. Recent developments of metal oxide semiconductors as photocatalysts in advanced oxidation processes (AOPs) for treatment of dye waste-water," Journal of Chemical Technology & Biotechnology 86 (2011): 1130-1158.
- W Zhang, et al. Liquid metal/metal oxide frameworks with incorporated Ga2O3 for photocatalysis. ACS applied materials & interfaces 7 (2015): 1943-1948.
- MN Rashed. Adsorption technique for the removal of organic pollutants from water and wastewater. Organic pollutants-monitoring, risk and treatment (2013): 167-194.
- N Yahya, et al. A review of integrated photocatalyst adsorbents for wastewater treatment. Journal of environmental chemical engineering 6 (2018): 7411-7425.
- SK Kansal, N Kaur, S Singh. Photocatalytic degradation of two commercial reactive dyes in aqueous phase using nanophotocatalysts. Nanoscale research letters 4 (2009): 709.
- WJ Ong, JJ Yeong, LL Tan, et al. Synergistic effect of graphene as a co-catalyst for enhanced daylight-induced photocatalytic activity of Zn 0.5 Cd 0.5 S synthesized via an improved one-pot co-precipitation-hydrothermal strategy. RSC Advances 4 (2014): 59676-59685.
- K Sahel, N Perol, H Chermette, et al. Photocatalytic decolorization of Remazol Black 5 (RB5) and Procion Red MX-5B-Isotherm of adsorption, kinetic of decolorization and mineralization. Applied Catalysis B: Environmental 77 (2007): 100-109.
- C Sahoo, AK Gupta, IM Sasidharan Pillai. Photocatalytic degradation of methylene blue dye from aqueous solution using silver ion-doped TiO2 and its application to the degradation of real textile wastewater. Journal of Environmental Science and Health, Part A 47 (2012): 1428-1438.
- S Alkaykh, A Mbarek, EE Ali-Shattle. Photocatalytic degradation of methylene blue dye in aqueous solution by MnTiO3 nanoparticles under sunlight irradiation. Heliyon 6 (2020): e03663.
- Q Xiang, J Yu, M Jaroniec. Graphene-based semiconductor photocatalysts. Chemical Society Reviews 41 (2012): 782-796.
- N Zhang, MQ Yang, S Liu, et al. Waltzing with the versatile platform of graphene to synthesize composite photocatalysts. Chemical reviews 115 (2015): 10307-10377.
- JG Radich, AL Krenselewski, J Zhu, et al. Is graphene a stable platform for photocatalysis? Mineralization of reduced graphene oxide with UV-irradiated TiO2 nanoparticles. Chemistry of Materials 26 (2014): 4662-4668.
- JG Radich, PV Kamat, Making graphene holey. Gold-nanoparticle-mediated hydroxyl radical attack on reduced graphene oxide. ACS nano 7 (2013): 5546-5557.
- WC Hou, et al. The contribution of indirect photolysis to the degradation of graphene oxide in sunlight. Carbon 110 (2016): 426-437.
- G Eda, et al. Blue photoluminescence from chemically derived graphene oxide. Advanced materials 22 (2010): pp. 505-509,.
- W Gao. The chemistry of graphene oxide. in Graphene oxide (2015): 61-95.
- W Gao, LB Alemany, L Ci, et al. New insights into the structure and reduction of graphite oxide. Nature chemistry 1 (2009): 403-408.
- CT Chien, et al. Tunable photoluminescence from graphene oxide. Angewandte Chemie International Edition 51 (2012): 6662-6666.
- L Guo, et al. Bandgap tailoring and synchronous microdevices patterning of graphene oxides. The Journal of Physical Chemistry C 116 (2012): 3594-3599.
- TF Yeh, SJ Chen, CS Yeh, et al. Tuning the electronic structure of graphite oxide through ammonia treatment for photocatalytic generation of H2 and O2 from water splitting," The Journal of Physical Chemistry C 117 (2013): 6516-6524.
- TF Yeh, FF Chan, CT Hsieh, et al. Graphite oxide with different oxygenated levels for hydrogen and oxygen production from water under illumination: the band positions of graphite oxide," The Journal of physical chemistry C 115 (2011): 22587-22597.
- TF Yeh, JM Syu, C Cheng, et al. Graphite oxide as a photocatalyst for hydrogen production from water," Advanced Functional Materials 20 (2010): 2255-2262.
- HC Hsu, et al. Graphene oxide as a promising photocatalyst for CO 2 to methanol conversion. Nanoscale 5 (2013): 262-268.
- D Tsukamoto, et al. Photocatalytic H2O2 production from ethanol/O2 system using TiO2 loaded with Au–Ag bimetallic alloy nanoparticles. Acs catalysis 2 (2012): 599-603.
- M Teranishi, Si Naya, H Tada. In situ liquid phase synthesis of hydrogen peroxide from molecular oxygen using gold nanoparticle-loaded titanium (IV) dioxide photocatalyst. Journal of the American Chemical Society 132 (2010): 7850-7851.
- N Kaynan, BA Berke, O Hazut, et al. Sustainable photocatalytic production of hydrogen peroxide from water and molecular oxygen," Journal of Materials Chemistry A (2014): 13822-13826.
- N Mohabansi, V Patil, N Yenkie. A comparative study on photo degradation of methylene blue dye effluent by advanced oxidation process by using TiO2/ZnO photo catalyst," Rasayan Journal of Chemistry 4 (2011): 814-819.
- P Montes-Navajas, NG Asenjo, R Santamaría, et al. Surface area measurement of graphene oxide in aqueous solutions. Langmuir 29 (2013): 13443-13448.
- A Bianco et al. All in the graphene family–A recommended nomenclature for two-dimensional carbon materials. ed: Elsevier (2013).
- N Cao, Y Zhang. Study of reduced graphene oxide preparation by Hummers’ method and related characterization. Journal of Nanomaterials ( 2015).
- X Liu, L Pan, T Lv, et al. Visible light photocatalytic degradation of dyes by bismuth oxide-reduced graphene oxide composites prepared via microwave-assisted method. Journal of colloid and interface science 408 (2013): 145-150.
- JM Campos-Martin, G Blanco-Brieva, JL Fierro. Hydrogen peroxide synthesis: an outlook beyond the anthraquinone process. Angewandte Chemie International Edition 45 (2006): 6962-6984.
- K Mase, M Yoneda, Y Yamada, et al. Seawater usable for production and consumption of hydrogen peroxide as a solar fuel. Nature communications 7 (2016): 1-7.
- D Wang, X Li, J Chen, et al. Enhanced photoelectrocatalytic activity of reduced graphene oxide/TiO2 composite films for dye degradation. Chemical engineering journal 198 (2012): 547-554.
- M Zainy, N Huang, SV Kumar, et al. Simple and scalable preparation of reduced graphene oxide–silver nanocomposites via rapid thermal treatment. Materials letters 89 (2012): 180-183,.
- E Bizani, K Fytianos, I Poulios, et al. Photocatalytic decolorization and degradation of dye solutions and wastewaters in the presence of titanium dioxide. Journal of Hazardous Materials 136 (2006): 85-94.
- WC Hou, YS Wang. Photocatalytic generation of H2O2 by graphene oxide in organic electron donor-free condition under sunlight. ACS Sustainable Chemistry & Engineering 5 (2017): 2994-3001.

