Effect of Co-Administration of Cadmium, Magnesium and Alcohol on the Liver, Kidney and Oxidative Stress Biomarkers of Wistar Rats
Article Information
Chidi John Ogham,1,2*, Jonathan Dabak1, Kiri Jaryum1
1Department of Biochemistry, Faculty of Basic Medical Sciences, College of Health Sciences, University of Jos, Jos, Nigeria
2Standards Organisation of Nigeria, Corporate Headquarters, Abuja, Nigeria.
*Corresponding Author: Chidi John Ogham. 1Department of Biochemistry, Faculty of Basic Medical Sciences, College of Health Sciences, University of Jos, Jos, Nigeria
Received: 29 April 2023; Accepted: 10 May 2023; Published: 19 May 2023
Citation: Chidi John Ogham, Jonathan Dabak, Kiri Jaryum. Effect of Co-Administration of Cadmium, Magnesium and Alcohol on the Liver, Kidney and Oxidative Stress Biomarkers of Wistar Rats. Archives of Nephrology and Urology. 6 (2023): 61-74.
View / Download Pdf Share at FacebookAbstract
Background: There was a health challenge in our study area with no known etiology which affected mostly alcoholics. Water quality assessment in the area, indicated that it is contaminated with cadmium and had high magnesium content. The aim of this work, therefore, was to mimic the co-administration of cadmium and magnesium with graded concentrations of alcohol using a rat model to assess the effect on the liver, kidney and redox status, in order to give a plausible explanation on the cause(s) of this health challenge.
Methods and Results: Rats were randomly divided into eight groups of 4 rats per group in metabolic cages. Group 1 served as normal control and fed with animal Feed and Water only. Group 2 was treated with feed and 6% Alcohol only (Test control). Group 3 to 8 were treated with the combination of cadmium, magnesium and graded concentrations of alcohol (aq). Treatments were done for a period of 21 days, after which the rats were sacrificed, serum was obtained for biochemical analysis; the liver and kidney were harvested for histopathological examinations and redox status assessment. The results revealed that increasing alcohol concentration with a constant concentration of Cd and Mg induces increasing degrees of hepatic, renal and oxidative damages. Pronounced damages in the tissues are in the alcohol concentrations above 4% v/v.
Conclusion: This suggest that alcoholics have higher risk of kidney, liver and oxidative stress diseases caused by cadmium toxicity in areas where the water source is polluted with cadmium as the case with our study area.
Keywords
Cadmium; Magnesium; Alcohol; Oxidative stress; Biomarkers; Liver; Kidney.
Cadmium articles, Magnesium articles, Alcohol articles, Oxidative stress articles, Biomarkers articles, Liver articles, Kidney articles.
Cadmium articles Cadmium Research articles Cadmium review articles Cadmium PubMed articles Cadmium PubMed Central articles Cadmium 2023 articles Cadmium 2024 articles Cadmium Scopus articles Cadmium impact factor journals Cadmium Scopus journals Cadmium PubMed journals Cadmium medical journals Cadmium free journals Cadmium best journals Cadmium top journals Cadmium free medical journals Cadmium famous journals Cadmium Google Scholar indexed journals Magnesium articles Magnesium Research articles Magnesium review articles Magnesium PubMed articles Magnesium PubMed Central articles Magnesium 2023 articles Magnesium 2024 articles Magnesium Scopus articles Magnesium impact factor journals Magnesium Scopus journals Magnesium PubMed journals Magnesium medical journals Magnesium free journals Magnesium best journals Magnesium top journals Magnesium free medical journals Magnesium famous journals Magnesium Google Scholar indexed journals Alcohol articles Alcohol Research articles Alcohol review articles Alcohol PubMed articles Alcohol PubMed Central articles Alcohol 2023 articles Alcohol 2024 articles Alcohol Scopus articles Alcohol impact factor journals Alcohol Scopus journals Alcohol PubMed journals Alcohol medical journals Alcohol free journals Alcohol best journals Alcohol top journals Alcohol free medical journals Alcohol famous journals Alcohol Google Scholar indexed journals Oxidative stress articles Oxidative stress Research articles Oxidative stress review articles Oxidative stress PubMed articles Oxidative stress PubMed Central articles Oxidative stress 2023 articles Oxidative stress 2024 articles Oxidative stress Scopus articles Oxidative stress impact factor journals Oxidative stress Scopus journals Oxidative stress PubMed journals Oxidative stress medical journals Oxidative stress free journals Oxidative stress best journals Oxidative stress top journals Oxidative stress free medical journals Oxidative stress famous journals Oxidative stress Google Scholar indexed journals Biomarkers articles Biomarkers Research articles Biomarkers review articles Biomarkers PubMed articles Biomarkers PubMed Central articles Biomarkers 2023 articles Biomarkers 2024 articles Biomarkers Scopus articles Biomarkers impact factor journals Biomarkers Scopus journals Biomarkers PubMed journals Biomarkers medical journals Biomarkers free journals Biomarkers best journals Biomarkers top journals Biomarkers free medical journals Biomarkers famous journals Biomarkers Google Scholar indexed journals Liver articles Liver Research articles Liver review articles Liver PubMed articles Liver PubMed Central articles Liver 2023 articles Liver 2024 articles Liver Scopus articles Liver impact factor journals Liver Scopus journals Liver PubMed journals Liver medical journals Liver free journals Liver best journals Liver top journals Liver free medical journals Liver famous journals Liver Google Scholar indexed journals Kidney articles Kidney Research articles Kidney review articles Kidney PubMed articles Kidney PubMed Central articles Kidney 2023 articles Kidney 2024 articles Kidney Scopus articles Kidney impact factor journals Kidney Scopus journals Kidney PubMed journals Kidney medical journals Kidney free journals Kidney best journals Kidney top journals Kidney free medical journals Kidney famous journals Kidney Google Scholar indexed journals metallothionine articles metallothionine Research articles metallothionine review articles metallothionine PubMed articles metallothionine PubMed Central articles metallothionine 2023 articles metallothionine 2024 articles metallothionine Scopus articles metallothionine impact factor journals metallothionine Scopus journals metallothionine PubMed journals metallothionine medical journals metallothionine free journals metallothionine best journals metallothionine top journals metallothionine free medical journals metallothionine famous journals metallothionine Google Scholar indexed journals alkaline phosphatase articles alkaline phosphatase Research articles alkaline phosphatase review articles alkaline phosphatase PubMed articles alkaline phosphatase PubMed Central articles alkaline phosphatase 2023 articles alkaline phosphatase 2024 articles alkaline phosphatase Scopus articles alkaline phosphatase impact factor journals alkaline phosphatase Scopus journals alkaline phosphatase PubMed journals alkaline phosphatase medical journals alkaline phosphatase free journals alkaline phosphatase best journals alkaline phosphatase top journals alkaline phosphatase free medical journals alkaline phosphatase famous journals alkaline phosphatase Google Scholar indexed journals
Article Details
1. Introduction
Bar is a land village separated by Bununu river to the north and surrounded by hills both to the east and west with a population of about 1300 people. Narration has it that some mineral resources were once exploited in the area in quantities not viable for commercial purposes.
A few years ago, a health crisis of epic proportions was reported in the village, after the community source of water was changed from surface water to groundwater for drinking, cooking, and irrigation. The change from using surface water for drinking and cooking was initially hailed as a tremendous breakthrough for public health because of the dramatic decline in mortality due to water-borne diseases caused by microbes. However, unknown to the organization that dug these wells for the community that the groundwater in the village was contaminated with some toxic metals of hydro-geological origin. Water quality assessment earlier carried out in the area, indicated that it is contaminated with cadmium and had high magnesium content [1]. This generated to an outbreak of a strange disease characterized by migraine, fever, anaemia, hypertension, degenerative dementia and liver enlargement which consequently had led to the death of dozens of people in this village. The disease, according to the villagers started in October 2003 and was attributed to the consumption of the hand-dug well water in the area. This incident was reported in a local Daily Trust newspaper of Wednesday May 31, 2006 and the once lively villagers lived in fears of the diseases [2].
An epidemiology study carried out by the public health department of the Bauchi State Ministry of Health discovered that the deaths from these diseases were mainly drinkers of locally brewed alcoholic beverage produced in the area. The study was however rather suggestive because it could not show a clear link between the health effects, concurrent exposure of toxic metals and alcohol consumption.
Literatures abound which point to the fact that environmental pollution is said to be one of the major challenges in the modern human society today [3]. Pollution and contamination by heavy metals in the environment is a threat to the environment and is of serious health concern in this modern age mainly due to growth in industrialization and urbanization [4]. The rates by which these metals are mobilized and transported in the environment have also greatly accelerated since the 1940s [5]. These metals occur naturally in the environment through weathering of metal-containing rocks and volcanic eruptions, while industrial emissions, mining, smelting, and agricultural activities like application of pesticides and phosphate fertilizers are principal anthropogenic sources [6]. Combustion of fossil fuels also contributes to the release of heavy metals such as cadmium (Cd) to the environment [7]. Heavy metals contaminate the food chains, persistent in the environment, and cause different health problems due to their toxicities. Chronic exposure to heavy metals in the environment is a major threat to living organisms [8], because the population living in polluted areas are not even aware of the danger lurking around.
Microbiological balance of soils is affected by metal concentrations higher than the threshold levels and can reduce their fertility [9]. Bioaccumulation of toxic heavy metals in biota of the riverine ecosystems may have adverse effects on animals and humans [10]. Higher levels of heavy metals in biota can have negative effects on the ecological health of aquatic animal species and may contribute to declines in their populations [11].
It should be emphasized that exposure to these toxic metals most often involves exposure to a combination of toxic metals rather than to just a single metal; thus, accurate assessment of health risk due to drinking metal-contaminated groundwater must consider potential interactions between the metals on the chemical, biochemical, and physiological levels. When subjects are exposed to metals in combination, the metals may each have their own typical health effects; either synergistically or antagonistically. In estimating the risks due to drinking water contaminants, it is vital to consider not only the health risks due to individual contaminants, but also those risks due to combinations of contaminants. Ingestion of metals in combination may increase or decrease the absorption and distribution of the individual metals in the digestive tract and circulatory system as well as also affecting the excretion of other metals [12,13].
Absorption of metals through drinking water can be affected by certain diets, behaviours and addiction. Interactions with dietary components and the general nutritional levels also affect the outcomes of exposure to toxic metals [14]. Health effects due to co-exposures to toxic metals are further affected by behavioural and cultural practices (e.g. smoking) and dietary habits (alcoholism). Particularly interesting are interactions between xenobiotics to which exposure is not often common. Examples of such substances are cadmium and ethanol. Interactions between cadmium and ethanol is an important problem in the field of modern toxicology, as both substances pose a risk to human and animal health [15]. Dabak et al. (2016) as also reported that magnesium possesses some level of protective effect against cadmium toxicity [16].
Alcoholism is a serious problem in almost in most societies. The excessive consumption of ethanol in the form of alcoholic beverages may be common among some industrial workers exposed to cadmium, including smokers [15]. Ethanol has been reported to increase the permeability of biological membranes to cadmium [17], which can make alcoholics more susceptible to the effect of cadmium toxicity. Findings suggest that with typical patterns of exposure, multiple mechanisms probably contribute to the uptake of Cd in the proximal tubule in vivo [18]. Regardless of the uptake mechanisms that are involved, it is clear that over time Cd can accumulate in the epithelial cells of the proximal tubule. The traditional view has been that when the tissue levels of Cd exceed a critical concentration of about 150 μg/g tissue, intracellular defenses such as metallothionine (MT) and glutathione (GSH) are overwhelmed and the cells undergo injury and begin to die [19,20].
Based on the above-mentioned studies, the dose, the duration, the chemical form of Cd in the kidney, liver and intestinal tissue, and the exposure route of Cd must be considered as an important factor in evaluating the chronic effects of long-term and short-term Cd administration. Liver and kidney are the important organs of metabolism, detoxification, storage and excretion of xenobiotics and their metabolites, and are especially vulnerable to damage. As the liver is an important target organ of ethanol [21], and the kidney of Cd toxicity [22]. Particulate matter exposures result in the delivery of metals to multiple extra-pulmonary sites where they form reactive centers that continually catalyze the generation of reactive oxygen species and induce oxidative stress.
This work is therefore designed to investigate the possible effects the concurrent administration of water containing cadmium and magnesium with graded concentrations of alcohol would exert on the liver, kidney and redox status, in order to document a plausible explanation on the cause(s) of this health challenges leading to deaths of mostly alcoholics in our study area. This in an in vivo study using rat models that employed methods towards estimating the interactions between parameters in subject to support relevant in vitro data, findings and correlations.
2. Materials and Methods
2.1 Experimental Animals
Thirty-two (32) 10-week old white albino rats with an average initial body weights of 230g were obtained from the animal house of the University of Jos, Nigeria and were fed commercial feed (Vital Feed) and provided with various treatment water ad libitum. They were housed in ventilated cages and maintained on a regular diurnal lighting cycle (12:12 light: dark). Chopped corn cob was used as bedding. They were also left to acclimatized for 7 days under standard environmental conditions before treatments.
2.2 Chemicals/Reagents
The feed used was vital feed (growers mash) produced by Grand Cereal and Oil Mills Ltd, Jos Plateau state. The cadmium chloride used was a product of May and Baker (M&B) Ltd, Gagenhan, England while ethanol was a product of British Drug House (BDH), England. Magnesium chloride used was a product of Sigma-Aldrich. Other chemicals used were of analytical grade purchased by Ministry of Education, Bauchi state for Government Science Secondary School Misau and also from NanaRich Medical Laboratories Bauchi and Prestige Laboratories Jos. All chemical preparations were done with distilled water which was distilled from pyrex apparatus. Standards of Cadmium were obtained from Water and Sanitation Agency (WATSAN) laboratory established by United Nations Children Fund (UNICEF) at Bauchi. The alanine aminotransferase (ALT; E-BC-K235-S), aspartate aminotransferase (AST; E-BC-K236-S), alkaline phosphatase (ALP; E-BC-K009-M), lactate dehydrogenase (LDH; E-BC-K766-M), albumin (ALB; E-BC-K057-5), Biuret Protein (E-BC-K165-S), total birilubin (E-BC-K760-M), Urea (BUN; E-BC-K183-S) and Creatinine (Cr; E-BC-K188-M) activity assay kits of Elabscience purchased from Hospilab, FCT. Rat Glucose 6 phosphate dehydrogenase (G6PH; E-EL-R0428) Elisa kit from Elabscience was also used.
2.3 Grouping and Treatment of Experimental Rats
Rats were randomly divided into eight groups of 4 rats per group in cages and all the groups drank the solution meant for each group ad libitum. The administration of the ethanol at a dose of 5 g of 96% ethanol/kg body wt/24 h was done through intragastric intubation at intervals of 12 hours all through the period of the experiment. During the whole course of the experiment, the animals were kept under identical conditions and had unlimited access to feed. As a case study for events taking place in Bar/Bula village, we have used cadmium and magnesium exposure level to correspond to those which occur in the ground water sampled in the area. Preparations of aqueous solutions containing 0.16mg/L of CdCl2 and 105mg/L of MgCl2 were served as representative water samples administered to the rats.
Group 1 (Normal control) – This group was placed on redistilled water to drink for the whole course of the experiment. Group 2 (Test control) was treated with 6% (v/v) aqueous solution of ethanol only. Group 3 was treated with 1% (v/v) aqueous solution of ethanol and drinking aqueous solution of the combination of 0.16mg/L of CdCl2 and 105mg/L of MgCl. Group 4 treated with 2% (v/v) aqueous solution of ethanol and drinking aqueous solution of 0.16mg/L of CdCl2 and 105mg/L of MgCl. Group 5 was treated with 3% (v/v) aqueous solution of ethanol and drinking aqueous solution of 0.16mg/L of CdCl2 and 105mg/L of MgCl. Group 6 was treated with 4% (v/v) aqueous solution of ethanol and drinking aqueous solution of 0.16mg/L of CdCl2 and 105mg/L of MgCl. Group 7 was treated with received 5% (v/v) aqueous solution of ethanol and drinking aqueous solution of 0.16mg/L of CdCl2 and 105mg/L of MgCl. Group 8 was treated with 6% (v/v) aqueous solution of ethanol and drinking aqueous solution of 0.16mg/L of CdCl2 and 105mg/L of MgCl. The animals were included in the study if they underwent successful intragastric intubation throughout the study period. The animals were excluded if they died prematurely before collection of analytical specimens.
During the course of the study, four different teams of investigators were involved; a first investigator was responsible for treatments preparation. A second investigator was responsible for administration of the treatment based on the groupings. A third investigator was responsible for anaesthetic procedure and performance of the surgical procedure whereas a fourth group of investigators (unaware of treatment) assessed the biochemical and histopathological examinations.
2.4 Sample Collection and Preparation
After 21 days’ treatments, the rats were sacrificed by cervical dislocation. Serum was obtained after centrifugation and kept frozen (-20oC) until needed for biochemical assays. The kidneys and livers were harvested and separated into two parts. One part was immediately frozen in liquid nitrogen and stored at -80oC for investigation of antioxidant status and a second was preserved in 10% formalin for histopathological examinations.
2.5 Biochemical Assays
Activities of serum alanine aminotransferase (ALT; E-BC-K235-S) and aspartate aminotransferase (AST; E-BC-K236-S) were determined according to the method of Reitman and Frankel (1957)[23], alkaline phosphatase (ALP; E-BC-K009-M, PNPP mehod), lactate dehydrogenase (LDH; E-BC-K766-M, WST-8 mehod), albumin (ALB; E-BC-K057-5, Bromocresol Green method), Biuret Protein (E-BC-K165-S), total birilubin (E-BC-K760-M), Urea (BUN; E-BC-K183-S, Urease method) and Creatinine (Cr; E-BC-K188-M, Sarcosine oxidase method) using activity assay kits of Elabscience purchased from Hospilab, FCT. Serum electrolytes; sodium (Na) ions, potassium (K) ions, bicarbonates (H3O-) ions and chloride (Cl) ions were measured using kits (Teco Diagnotics, California USA)
The serum ALT activity, AST activity, and ALP activity were determined by the method of Reitman and Frankel.23 For ALT activity analysis, ALT reacted with alanine and a-ketoglutarate and produced pyruvic acid.
Glutamate + pyruvate ? α-ketoglutarate + alanine
Pyruvic acid was then reacted with 2,4- dinitrophenylhydrazine (DNPH) to form phenylhydrazone, which could be dissolved in sodium hydroxide (10 ml of 0.4 M NaOH) and then detected at 505 nm. For AST activity analysis, AST catalyzed aspartate and a-ketoglutarate to form oxalacetate and glutamate. Oxalacetate could decarboxylate automatically to pyruvic acid, which could react with DNPH and then be detected at 510 nm. For ALP activity analysis, ALP catalyzed disodium phenyl phosphate to form phenol, which could react with 4-aminoantipyrine and potassium ferricyanide and could be detected at 520 nm
Estimation of blood urea nitrogen was carried out by the urease method. 5µl of serum as added into a microplate well with the urease reagent mix. The reaction mixture was incubated for 15mins after which 150µl of alkaline hypochlorite was added and further incubated for 10mins. The absorbance was read at 620nm. Estimation of creatinine in serum was carried out by the sarcosine oxidase method. 10µl of serum as added into a microplate well with 180µl of reagent mix. The reaction mixture was incubated at 37oCfor 5mins after which 60µl of reagent 2 (peroxidase) was added and further incubated for 2mins. The absorbance was read at 515nm.
Bromocresol green method for albumin determination involved mixing of 10µl of sample with 2500µl of reagent at pH 4 – 4.2 for 10 mins to form a yellowish-green complex which is measured at 628 nm. Biuret Protein method for Protein determination involved mixing of 50µl of sample with 2500µl of biuret working solution for 10 mins to form a purple complex which is measured at 540 nm.
Lactate and NAD+ are converted to pyruvate and NADH by the action of Lactate dehyrogenase. NADH strongly absorbs light at 340 nm, whereas NAD+ does not. The rate of increase in absorbance at 340 nm is directly proportional to the LD activity in the sample. This involved mixing 1000µl and 10µl and incubate at 37oC for 1 minute, measure the change in absorbance per minute (340nm) during 3 minutes
2.6 Redox Status Analysis
The liver and kidney tissues for redox status assessment were rapidly excised, washed in ice-cold 0.9% NaCl, and homogenized in nine volumes of buffer (0.1 mol/L phosphate buffer, pH 7.4) [24]. Homogenization was carried with the T10 basic Ultra-Turrax homogenizer (IKA, Staufen, Germany). Some homogenate was used for the determination of malondialdehyde (MDA), while the rest was centrifuged for 10 min at 800 g and then for 20 min at 9500 g to get post-mitochondrial supernatant (PMS). Performance of the assessment of the following parameters: MDA, catalase level, total thiol (SH) groups level, glucose 6 phosphate dehydrogenase (G6PH), and superoxide dismutase activity (SOD) at ILAB 300 plus analyzer (Instrumentation Laboratory, Milan, Italy) and Cary 60 UV-VIS spectrophotometer (Agilent Technologies, Santa Clara, CA, USA). The MDA concentration was determined as a thiobarbituric acid-reactive substance (TBARS) by a spectrophotometric assay based on the absorption maximum of the malondialdehyde complex and other TBARS with thiobarbituric acid at 535 nm [25]. The principle of the method for determining AOPP is a two-step measurement of sample absorption in the wavelength range of 200–400 nm, with peak at 340 nm. The measured difference in the measured absorbance values of 340 nm indicates the AOPP value for the given sample [26]. The principle of the method for determining the total SH-groups is as follows: aliphatic thiol compounds in the base environment are reacted with DTNB (2,2’-dinitro-5,5’-dithio-benzoic acid), wherein one mole of thiol produces one mole of p-nitrophenol. The resulting color has an absorption peak at 412 nm [27]. Determination of the activity of superoxide dismutase enzymes (SOD, EC 1.15.1.1.) was established in 1971 by Misra and Fridovich (1972) [28]. The method is leveraged on the ability of SOD to inhibit the spontaneous autoxidation of adrenaline at pH 10.2.
Assay in whole blood G-6-PD screening was performed using rat G-6-PD Sandwich Elisa kits. The screening was carried out on the day of blood collection. The wells for diluted standard, blank and sample were determined. 100 μL sample was added into the appropriate wells and the plate covered with the sealer provided in the kit with subsequent Incubation for 90 min at 37°C. The liquid from each well was then decanted with the immediate addition of 100 μL of Biotinylated Detection Ab working solution to each well and the plate covered with a new sealer and incubate for 1 hour at 37°C. 350 μL of wash buffer was added to each well and soaked for 1 min with subsequent aspiration and patting against clean absorbent paper till dried. The washing was then repeated for 3 times. 100 μL of HRP Conjugate working solution was added to each well, covered with a new sealer and incubate for 30 min at 37°C. The solution was decanted from each well and washed repeatedly for 5 times.90 μL of Substrate Reagent was added to each well, covered with a new sealer and incubate for about 15 min at 37°C. The plate was carefully protected from light. 50 μL of Stop Solution was then added to each well. The absorbance was determined at 450 nm.
2.7 Histopathological studies
Slices (0.5cm thick) of the left liver lobe and left kidney (from two animals of each group) were fixed in 10% formol saline for 24 h after which they were transferred to 70% alcohol for dehydration. The tissues were passed through 90% alcohol and chloroform for different durations, then transferred into two changes of molten paraffin wax for 20min each in an oven at 57ºC. Serial sections of 5-6µm thick were obtained from a solid block of tissue and stained with haematoxylin and eosin stains, after which they were passed through a mixture of equal concentration of xylene and alcohol. Following clearance in xylene, the tissues were oven- dried. Photomicrographs were taken with a JVC colour video digital camera (JVC, China) mounted on an Olympus light microscope (Olympus UK Ltd, Essex, UK) to demonstrate the cytoarchitecture of the liver. All alterations from the normal structure were registered.
2.8 Statistical analysis
Mean values obtained for the metals studied in the alcoholic beverage samples were compared by One-Way ANOVA at 95% level of significance using IBM SPSS statistics software version 20; assuming that there were significant differences among them when the statistical comparison gives p < 0.05.
3. Results
3.1 Effect of Treatments on Total proteins, Albumin. Bilirubin and Direct Bilirubin
Figure 1 shows the effect of treatments on total proteins, albumin, bilirubin and direct bilirubin. Results show that as the concentrations of total proteins and albumin were not significantly different (p> 0.05) between the normal control and that of groups 3, 4, 5 and 6 but there was significant decrease (P<0.05) in groups 7 and 8 when compared to normal control. As the concentration of alcohol was increased in the test groups, there was a significant (p< 0.05) decrease in the total proteins and albumin concentrations when compared to the test control. On the other hand, as the concentration of alcohol was increased in the test groups, there was significant (p < 0.05) increases in the concentrations of bilirubin and direct bilirubin when compared with the test control.
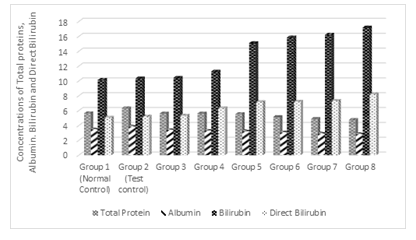
Figure 1: Effects of the co-administration of cadmium, magnesium and alcohol on some biochemical markers of hepatic injury
3.2 Effect of Treatments on ALP, AST and ALT
Figure 2 shows the effect of treatments on ALP, AST and ALT. Results show that as the concentrations of ALP in group 3, which had 1% of alcohol with the addition of Cd and Mg was not significantly different (p> 0.05) from normal control but was significant different (P<0.05) from the test control. As the concentration of alcohol was increased in the test groups, there was a significant (p< 0.05) increases in the ALP compared to the test control. On the other hand, as the concentration of alcohol was increased in the test groups, there was significant (p < 0.05) increases in the concentrations AST and ALT, which were significantly different from the test and normal controls.
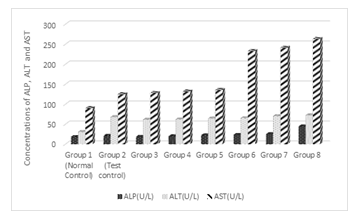
Figure 2: Effect of the co-administration of cadmium, magnesium and alcohol on alkaline phosphatase (ALP), alanine amino transferases (ALT) and aspartate amino transferases (AST)
3.3 Effect of Treatments on LDH activity in 1and 3 minutes
Figure 3 shows the effect of treatments on Lactic acid dehydrogenase (LDH) activity after 1 and 3 minutes. Results show that there was no significant difference (p > 0.05) between the normal and the test controls of LDH activity in 1 and 3 minutes; but there was significant difference (P<0.05) in the enzyme activity between the normal control and the test control in 3minutes. As the concentration of alcohol was increased in the test groups, the enzyme activity was significantly (p< 0.05) increased in 1 minute and also in 3 minutes. The increase in the enzyme activity in one minute was greater than the increase in 3 minutes.
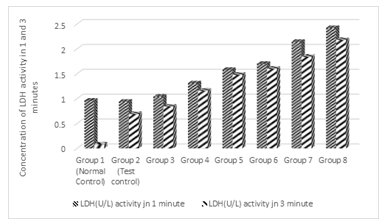
Figure 3: Effect of the co-administration of cadmium, magnesium and graded concentrations of alcohol on Lactic acid dehydrogenase (LDH) activity in 1 and 3 minutes.
3.4 Effect of Treatments on the concentration of Na+, K+, Cl-, HCO3-
Figure 4 shows the effect of treatments on the concentrations of Na+, K+, Cl- and HCO3- . Results show that there was no significant difference (p > 0.05) between the normal and the test control in the concentrations of Na+, K+, Cl- and HCO3- . However, when the same concentration of Cd and Mg were administered with 1%, 2%, 3%, 4%, 5% and 6%, there was significant (P<0.05) increase in Na+ concentration which was pronounced in groups 7 to 8 when compared to the normal and the test control. On the other hand, there was significantly low (P<0.05) concentration of K+ in all the test groups as compared to the normal and the test controls. Results also show that the concentration of Cl-ion was significantly (P<0.05) increased especially groups 6, 7 and 8 as compared to the normal and the test control. There was no significant difference (p > 0.05) between the concentration of HCO3- of groups 3, 4, 5, 6 and the test controls, but there was significant difference (P<0.05) between the concentration HCO3- of the controls and groups 7 and 8.
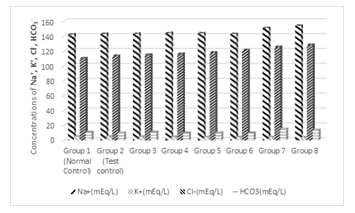
Figure 4: Effects of the co-administration of cadmium, magnesium and alcohol on the concentrations of Na2+, K+, Cl- and HCO3.
3.5 Effect of Treatments on the concentration of Urea and Creatinine
Figure 5 shows the effect of treatments on the concentrations of urea and creatinine. Results show that there was no significant difference (p > 0.05) between the normal and the test controls in the concentrations of urea. However, when the same concentration of Cd and Mg were administered with 1%, 2%, 3%, 4%, 5% and 6%, there was significant (P<0.05) increase in urea concentration. The increase was dependent on the increase in the concentration of alcohol. The same pattern was observed with the concentration of creatinine under the same treatments.
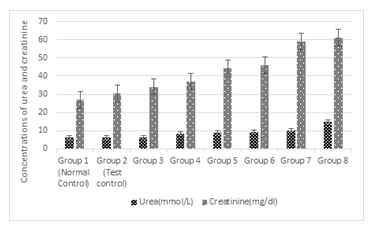
Figure 5: Effects of the co-administration of cadmium, magnesium and alcohol on the concentration of urea and creatinine
3.6 Effect of Treatments on the concentration of Glutathione (GSH), Malondialdehyde (MDA), Superoxide Dismutase (SOD), Catalase and Glucose-6-phosphate Dehydrogenase (G-6-PDH)
Figure 6 shows the effect of treatments on the concentrations of GSH, MDA, SOD, Catalase and G-6-PDH. Results show that there was significant decrease (p < 0.05) of the GSH concentration of the test control as compared to the normal control. However, when the same concentration of Cd and Mg were administered with 1%, 2%, 3%, 4%, 5% and 6%, there was significant (P<0.05) decrease which was progressive with increase in the alcohol concentration. The same pattern was observed with the concentration of SOD, Catalase and G-6-PDH. On the other hand, there was significant (p < 0.05) increase MDA concentration in the test control as compared to the normal control. As the same concentration of Cd and Mg were administered with 1%, 2%, 3%, 4%, 5% and 6%, there was significant (P<0.05) increase which was progressive with increase in the alcohol concentration
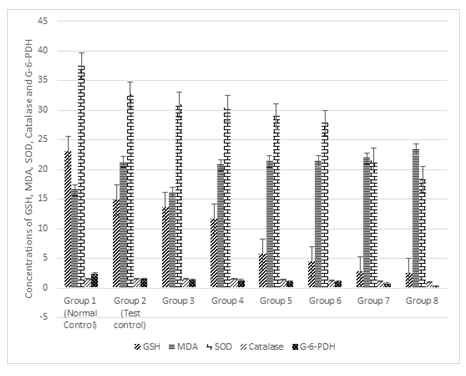
Figure 6: Effect of the co-administration of cadmium, magnesium and graded alcohol on oxidative stress biomarkers
3.7 Effect of the co-administration of cadmium, magnesium and graded concentrations of alcohol on the liver and kidney cellular integrity
Plates 1-10 show the results of the histopathological examinations of the liver and kidney of the rats treated with Cd and Mg with addition of graded concentrations of alcohol. Plate 1 is the liver section of control rats showing normal arrangement of hepatocytes running radiantly from the central vein and are separated by sinusoids containing Kupffer cells. They are regular and contain a large spheroidal nucleus with a distinctly marked nucleolus and peripheral chromatin distribution. Some cells have two nuclei each. Plate 2 is the kidney section of the normal control rats showing normal kidney morphology. Tubules are intact with podocytes and mesangial cell at the cortex.
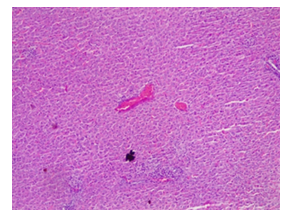
Plate 1: Micrograph of representative Rat Liver
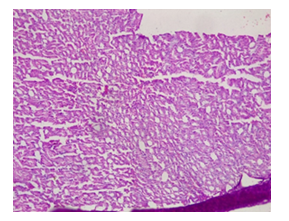
Plate 2: Micrograph of representative Rat section of control rat showing no pathological changes. Kidney section of control rat showing normal kidney morphology. Tubules are intact with podocytes and mesangial cell at the cortex .
Results of the Histopathological analysis of the liver of the test groups show that there are several changes such as hepatocytes hypertrophy, disorganization of the hepatic cords, chronic portal inflammation with mild periportal necrosis, chronic lobular inflammation with some focal necrosis, Noticeable lymphocytes infiltrates, chronic portal inflammation with periportal necrosis, severe cellular infiltration, lobular chronic inflammation with spotty necrosis and sinusoid enlargement as seen in plates 3, 4, 5 and 6.
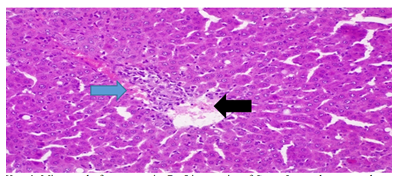
Plate 3: Micrograph of representative Rat Liver section of Group 5 treated concurrently with 3% alcohol and 0.16mg/l cadmium/185mg/l magnesium showing chronic portal inflammation (blue arrow) with mild periportal necrosis (black arrow).
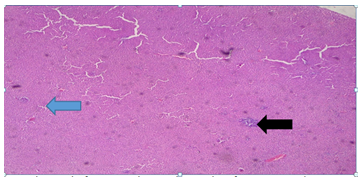
Plate 4: Micrograph of representative Rat Liver section of Group 6 treated concurrently with 4% alcohol and 0.16mg/l cadmium/185mg/l magnesium showing chronic lobular inflammation with some focal necrosis (blue arrow). Noticeable lymphocytes infiltrates seen (black arrow).
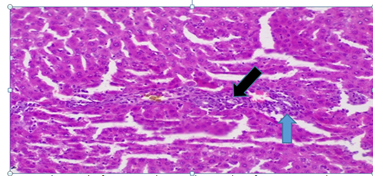
Plate 5: Micrograph of representative Rat Liver section of Group 7 treated concurrently with 5% alcohol and 0.16mg/l cadmium/185mg/l magnesium showing chronic portal inflammation with periportal necrosis (blue arrow). Black arrow showing severe cellular infiltration.
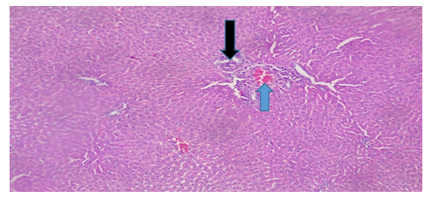
Plate 6: Micrograph of representative Rat Liver section of Group 8 treated concurrently with 6% alcohol and 0.16mg/l cadmium/185mg/l magnesium showing lobular chronic inflammation with spotty necrosis (black arrow), sinusoid enlargement (blue arrow).
Results of the Histopathological analysis of the kidney of the test groups show that there are several changes such as normal gross morphology with focal tubular necrosis, severe degeneration of glomerular content and severe epithelial necrosis, focal tuberitis with necrosis, Tubular epithelial cell degeneration and necrosis with inflammatory cells infiltration, inflammation of the glomerulus with focal hyalinization, rapidly progressive mesangial proliferation, Neutrophils infiltrates, degeneration of glomerular content and enlargement of the glomeruli due to proliferation and swelling of the mesangial cells are evident as in Plates 7, 8, 9 and 10.
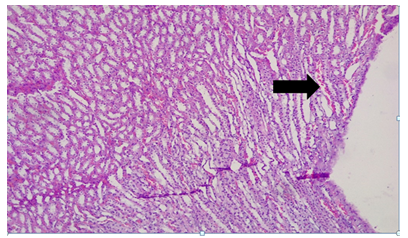
Plate 7: Micrograph of representative Rat Kidney section (medullary parts) of Group 5 treated concurrently with 3% alcohol and 0.16mg/l cadmium/185mg/l magnesium showing normal gross morphology and focal tuberitis with necrosis (black arrow).
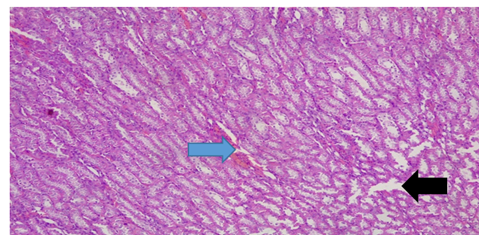
Plate 8: Micrograph of representative Rat Kidney section (medullary part) of Group 6 treated concurrently with 4% alcohol and 0.16mg/l cadmium/185mg/l magnesium showing normal gross morphology with focal tubular necrosis (black arrow). It also shows severe degeneration of glomerular content and severe epithelial necrosis (blue arrow). X300
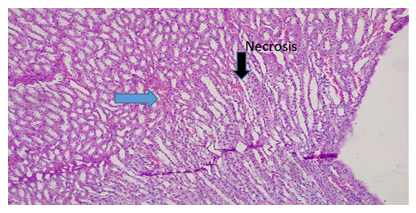
Plate 9: Micrograph of representative Rat Kidney section (medullary part) of Group 7 treated concurrently with 5% alcohol and 0.16mg/l cadmium/185mg/l magnesium showing focal tuberitis with necrosis. Tubular epithelial cell degeneration and necrosis (black arrow) with inflammatory cells infiltration (blue arrow). X300).
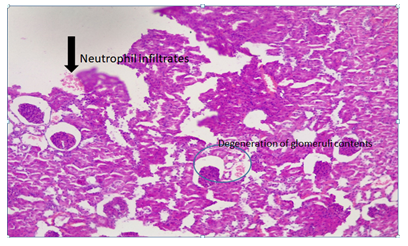
Plate 10: Micrograph of representative Rat Kidney section of Group 8 treated concurrently with 6% alcohol and 0.16mg/l cadmium/185mg/l magnesium showing inflammation of the glomerus with focal hyalinization. Rapidly progressive mesangial proliferation, Neutrophils infiltrates, degeneration of glomerular content and enlargement of the glomeruli probably due to proliferation and swelling of the, mesangial cells were evident. X300.
4. Discussion
4.1 Effect on the Liver
Our results had shown that there was significantly high (P<0.05) concentrations of Total Protein and Albumin in the test control when compared to the normal control. On the other hand, there was significantly low (P<0.05) concentrations for the test groups, when compared to the normal control. The decrease was progressive as the concentration of alcohol was increased. The low serum protein concentration across the group could indicate liver impairment, as liver is being known as the main site of protein synthesis in the plasma, primarily albumin [29], or the altered animal’s nutritional status [30]. Studies has shown that liver injury can qualitatively and quantitatively affect the synthesis of liver plasma proteins [31]. Plasma albumin and total plasma protein loss could be due to hepatocellular dysfunction or liver disease [32].
The results also show significantly high (P<0.05) concentrations in Bilirubin and Direct Bilirubin in all the test groups when compared to control group. In this study, the high concentrations of total bilirubin and unconjugated bilirubin suggest damage to the heme molecule. This is an indicative of hepatic dysfunction which could be as a result of oxidative damage in the liver [33].
The liver transaminases (AST and ALT) and alkaline phosphatase (ALP) enzyme activity in serum are most frequently measured for liver diseases diagnosis particularly infection of hepatitis, alcoholic cirrhosis, biliary obstruction and hepatocarcinoma. Liver enzymes, AST and ALT, are considered as important biomarkers of liver injury and hence used in the detection of cadmium hepatotoxicity. Results show that there was significantly high (P<0.05) concentrations of ALP, AST and ALT when compared to the normal control. The concentrations of ALP, AST and ALT increased with increase in the concentration of alcohol. AST and ALT leakages from the liver cytosol into the blood stream increases their concentrations in the plasma of the test groups which could mean that there was injury to the liver. Aminotransferases (AST and ALT), are enzymes that are predominantly found in the liver. ALT is stored solely in the cytoplasm, while AST found both in the cytosol and mitochondria of hepatocytes [34]. Similar cause leading to the slight increase in the concentration of ALP could have led to their leakages into the circulation, which could be due to destruction of the liver structural integrity [35].
Results also show that there were significant increases (P<0.05) in LDH levels in the test groups when compared to the normal controls. There was no significant difference between the test control and the test groups. Increase in the concentration of alcohol in the test groups caused a progressive increase in LDH levels in the rats. LDH is an intracellular enzyme. When serum levels of LDH is raised, it is suggestive of hepato-cellular damage [36]. From this study, it appears that this parameter is the best tool that elucidates the dose dependence effect of alcohol on liver injury. Analysis of the LDH levels of the homogenates of the liver can be regarded as a good biomarker for diagnosis of liver and cancer diseases. The effect of alcohol on liver injury, which was dose-dependent was vividly shown by the LDH levels in the test groups. Increase in the concentration of alcohol caused a progressive increase in LDH levels in the rats.
Examination of the liver using histopathological analysis reveals several alterations, including enlargement of hepatocytes and disruption of the hepatic cords mostly from groups with higher concentration of alcohol. Swelling of intracellular organelles especially mitochondria and endoplasmic reticulum leads to the observed liver cells enlargement. cell vacuolation is a reaction of the cellular defense mechanism against toxic substances that are harmful to the liver. These harmful substances are aggregated vacuoles and prevented from interfering with cellular metabolism. Disruption in lipid infiltrates and fat metabolism is also as a cause of cytoplasmic vacuolation. The infiltration of lymphocytic cells observed in this study in the test groups show evidence of cell irritability, inflammation and hypersensitivity to the toxicant used. The presence of lymphocytic infiltration and sinusoidal blood congestion in the groups that received higher alcoholic doses indicates significant liver damage following treatments.
4.2 Effect on the Kidney
In this study, it was observed that the treatments significantly (p<0.05) increased creatinine and chloride ions level in a dose dependent manner when compared with the control. There was significantly high (P<0.05) increase in urea levels in the test groups when compared with the normal control. Increase in the concentration of alcohol caused a progressive and highly significant (P<0.05) increases in urea levels in the test groups. These changes indicate that even at the lower alcohol concentrations, the excretory function of the kidney could be impaired in the presence of Cd. The ingestion of cadmium via drinking water or through the food chain, leads to its accumulation in the kidney and liver of subjects [37,38]. Urea concentration was significantly increased in all the test groups when compared with the controls, and so also creatinine. Increase in the concentration of alcohol caused a progressive and highly significant (P<0.05) increase in creatinine levels in the rats.
Changes in urea and creatinine levels could be an indication of impairment of the excretory function of the kidney by cadmium even at the lower alcohol concentration. The kidney transports and eliminate Creatinine as a chemical waste product via the bloodstream. Its inability to filter creatinine leads its rise in the blood. This invariably means that impairment of the renal organ leads to rise in creatinine level in the blood [39].
The study also shows that there was significantly high (P<0.05) increase in Na+ concentrations in the test groups when compared to the control with the last two highest alcohol concentrations standing out. There was significantly low (P<0.05) concentrations of HCO3 at the lower concentrations of alcohol in the test groups, but there were significantly high increases in HCO3 concentrations in the groups treated with the higher concentrations of alcohol when compared to control. Impaired excretory function is also supported by the fact that levels of some serum ions have been changed (Na, K, HCO3- and Cl), in the blood and kidneys. The result of serum electrolytes indicated a possible impairment of the kidney function. The pronounced effect on the HCO3- concentration in the test groups that had the highest concentration of alcohol is suggestive of the degree of impairment of the kidney. Depleted potassium ion which is suggestive of renal failure, is important in assessing the integrity of the kidney [40]. The decrease in potassium ion concentration, coupled with increase in chloride ion concentration, supports the notion that chloride ion acts as a counter-ion to potassium (or sodium ion), which is consistent with previous studies. [40]. These observations, also could be due to the fact that changes in membrane structure can affect water balance and ion flux, and every process within the cell [42]. Abnormities or changes in specific membrane constituents may results in different diseases, indicating that the proper functioning of the cells rely on the integrity of their membranes.
The significant increase (P < 0.05) in ALP activity of the test groups in this study could also indicate damage to the kidney. The increase in ALP activity could lead to random removal of membrane phosphate esters leading to depletion of energy-rich phosphate compounds which could compromise the integrity of the organ or cell leading to cell death. The integrity of the plasma membrane of a cell can be gotten through ALP assessment. [43].
The above phenomenon is further supported by the pathological changes in kidney ultrastructure (injured brush border microvilli and swollen mitochondria in the proximal convoluted tubular cells) and necrosis which was observed in the test groups with higher concentrations of alcohol. Renal injuries became more pronounced as alcohol concentration increased. Histopathology revealed signs of tubular necrosis, interstitial fibrosis and glomerular epithelial cell hypertrophy in small areas of the kidney cortex. The observed effect of alcohol on Cd nephrotoxicity can be stated as thus; as the concentration of alcohol increases, nephrotoxicity of Cd increases.
4.3 Redox status
All investigated parameters of oxidative stress were negatively affected by cadmium treatment. These observed changes agreed with evidences of previous studies that Cd toxicity is mediated by decrease in antioxidant enzymes, production of reactive oxygen species and lipid peroxidation [44]. The occurrence of lipid peroxidation in liver and kidney increased in the treated rats evident in the significantly high (P<0.05) values in MDA levels for all groups when compared to the control. Lipid peroxidation is the main cause of cadmium-induced hepatotoxicity and be due to depletion of non-protein sulfhydryl containing compounds. Lipids interact with reactive oxygen species leading to peroxidative changes that result in elevated lipid peroxidation. The significantly increased (p < 0.05) lipid peroxidation with increasing alcohol concentration in the treatments could be an indication of a reduction in non-enzymatic antioxidants of the defense mechanisms.
Cadmium and alcohol-induced cell and organ injury is strongly associated with oxidative stress [45]. Hepatic disorientation is caused by these substances by changing the activities of superoxide dismutase, catalase and glutathione (GSH) enzymes in liver tissues. The activities of the antioxidant enzymes CAT, SOD, GSH and G6PDH in the groups of rats decreased in the study revealing the damage in the liver and kidney. SOD activity was decreased with progressive increase in alcohol concentration in the organs of the of rats. The reduced activity of SOD as a result of increasing alcohol concentrations in the treatments could be responsible for the accumulation of O -, H2O2 or the products of its decomposition [45].
The activity of GSH was significantly decrease (p < 0.05) between the GSH concentration of the normal control and the test control group. Upon the addition of Cd, Mg and the graded concentrations of alcohol in the test groups, GSH level decreased sharply with increasing concentration of alcohol. The fall in antioxidant enzymes level in the test groups could be due to increase in lipid peroxidation as the concentration of alcohol was elevated. Dinu et al. [46] reported that enzymes responsible for recycling and using glutathione in the kidney becomes more active upon exposure to an increase amount of alcohol, resulting in reduction of GSH level in tissues of the experimental groups [47]. Administration of alcohol and cadmium induces lipid peroxidation and depletes GSH reserves. The synthesis of reactive oxygen intermediates during alcohol metabolism leads to GSH oxidation, and as a result reducing its levels [48]. Reports has it that when Cd levels in the tissue passes concentration of about 150 μg/g, the intracellular defense mechanisms of the cells, metallothionine (MT) and glutathione (GSH), are overwhelmed leading to cell damage and their death [19,20].
The observed decrease in GSH level as a response to the increasing concentration of alcohol administration correlates with the increase in the Glutathione transferase activity. The rise in GSH involvement in the conjugation process, which is required as a result of increase in GSH activity, appears to be a plausible explanation to GSH level decrease as a result of alcohol consumption. Oxidative stress leads to the activation of increased GSH activity [49]. Then follows the depletion of catalase in blood which is consistent with the accumulation of cadmium in blood and tissues due to enhanced uptake of Cd by alcohol, and more production of reactive oxygen species (ROS).
Superoxide radical, hydroxyl radical and nitric oxide radicals are generated indirectly through the Fenton reaction from non-radical hydrogen peroxide during cadmium toxicity, unlike other heavy metals [50]. The iron and copper from a number of cytoplasmic and membrane proteins like ferritin are replaced by cadmium, leading to the release and increase in the concentration of unbound iron or copper ions. These unbound ions are implicated in oxidative stress via the Fenton reactions [51]. Superoxide dismutase (SOD) is a major enzymatic antioxidant, which degrades O2.− and catalase, and the GSH redox system, which alleviates the formation of H2O2. Manganese SOD (which is located in mitochondria), Cu–Zn SOD (which resides in the cytoplasm) and extracellular SOD (which lines blood vessels) are the three important forms of SOD. GSH, a water-soluble, low-molecular-weight tripeptide (L-γ-glutamyl-L-cysteinyl glycine) present in high concentrations in each cell is also important. It is also present extracellularly and is particularly abundant in lung epithelial lining fluids [52]. The antioxidant, GSH, forms intermolecular disulphide non-radical end-product-oxidized glutathione (GSSG). GSH is also a cofactor for various enzymes that decrease oxidative stress [53]. Invariably, NADPH donates electron to a reductase reaction for either the export of GSSG from the cell or conversion to GSH. The abundant presence of GSH in the liver makes it the first line of defense against Cd hepatotoxicity as Cd binds tightly to thiol groups, and hepatic GSH depletion by diethyl maleate significantly enhances cadmium-induced hepatotoxicity [54]. Hepatic GSH depletion by diethyl maleate leads to elevated Cd-generated radical adduct signals in the bile suggesting that disruption of the cellular GSH system is a key element for cadmium-induced oxidative stress in the liver [55].
Glucose-6-phosphate dehydrogenase (G6PDH) is an important enzyme in the pentose phosphate pathway (PPP) and plays an essential role in the oxidative stress response by producing the main intracellular reductant, nicotinamide adenine dinucleotide phosphate (NADPH). From this study, liver function profiles of G-6-PDH of the rats shows significantly low (P<0.05) values as the concentration of alcohol was increased in the test groups when compared to the controls. Increase in the concentration of alcohol caused a progressive and highly significant (P<0.05) decrease in G-6-PDH levels in the rats. Our result also showed that progressively low G-6-PDH levels across the test groups have increased MDA levels than control G-6-PDH status. Since MDA is a byproduct of lipid peroxidation, this may signify increase lipid peroxidation in G-6-PDH low groups. The protection of the body from the harmful effects of free radicals by endogenous and exogenous antioxidants leads to redox balance maintenance [56]. In the rats’ plasma, the use of G-6-PDH for neutralizing oxidative stress agents leads to their decrease levels. Extended exposure and influence of free radicals, even at low levels, may cause harm to biologically essential molecules and potentially lead to tissue damages and diseases [56].
5. Conclusions
The results of this study show that the higher the concentration of alcohol administered with a constant concentration of Cd and Mg, the higher the concentrations of liver and kidney injury biomarkers in the serum of rats. The results also show that there was reduce concentration of oxidative stress biomarkers and increased by-products of oxidative stress markers. This result suggests that populations living on Cd-polluted water and soil, and are alcoholics, are at a higher risk of Cd-induced hepatotoxicity and nephrotoxicity, and a wide variety of diseases promoted by by-products of oxidative stress. This could have been the case with the inhabitants of our study area where the outbreak of strange diseases was killing mostly alcoholics in the community.
Declarations
Ethical approval and consent to participate
All experimental procedures were approved by the Ethical Committee on Animal Experimental unit of the University of Jos, Faculty of Pharmaceutical Sciences Reference number: F17-00379, in compliance with the Guide for the Care and Use of Laboratory Animals published by the US National Institutes of Health (NIH publication no. 85-23, revised 1996).
Consent for publication
Not Applicable
Availability of data and materials
Ogham CJ, Dabak JD and Jaryum KH. 2023. Physicochemical and metal assessment of Bar village well water and the effect of co-administration of cadmium, magnesium and alcohol on some organs. Unpublished PhD Thesis, University of Jos, Plateau State, Nigeria,148-149. https://doi.org/10.21203/rs.3.rs-1738108/v1
Competing interests
The authors declare that they have no competing interests.
Funding
This research received no specific grant from any funding agency in the public, commercial, or not-for-profit sectors.
Authors’ contribution
CO conceived, researched and funded the study; CO also drafted the manuscript; JD designed, supervised and provided significant input in all sections of the work to improve the quality of the manuscript; KJ Co-supervised and was involved in literature search. All authors read and approved the final manuscript.
Acknowledgements
The authors posthumously acknowledge the support of late Engr. A. Marafa, a former Director Bauchi State ministry of water resources and rural development for is administrative support. The participation of Mr. Istifanus Gurumtet in various stages of this study cannot be left unmentioned.
References
- Ogham CJ, Dabak JD and Jaryum KH. 2023. Physicochemical and metal assessment of Bar village well water and the effect of co-administration of cadmium, magnesium and alcohol on some organs. Unpublished PhD Thesis, University of Jos, Plateau State, Nigeria, 148-149. https://doi.org/10.21203/rs.3.rs-1738108/v1
- Tashikalmah H. 2006, May31. Bauchi: Villagers raise alarm over waterborne disease. Daily Trust; p.5. https://allafrica.com/stories/200605310148.html
- Ali H. & Khan E. 2016. Environmental chemistry in the twenty-first century. Environmental Chemistry Letters, 15(2), 329-346. https://link.springer.com/article/10.1007/s10311- 016-0601-3
- Hashem, MA, Nur-A-Tomal, MS, Mondal, NR, & Rahman, MA. 2017. Hair burning and liming in tanneries is a source of pollution by arsenic, lead, zinc, manganese and iron. Environmental Chemistry Letters, 15(3), 501-506.doi: 10.1007/s10311-017-0634-2
- Khan FU, Rahman AU, Jan A & Riaz M. 2004. Toxic and trace metals (Pb, Cd, Zn, Cu, Mn, Ni, Co and Cr) in dust, dustfall/soil. Journal of the Chemical Society of Pakistan (Pakistan), 26. https://www.researchgate.net/publication/286330049
- Alengebawy A, Abdelkhalek ST, Qureshi SR, Wang MQ. Heavy Metals and Pesticides Toxicity in Agricultural Soil and Plants: Ecological Risks and Human Health Implications. Toxics. 2021 Feb 25;9(3):42. PMID: 33668829, doi: 10.3390/toxics9030042.
- Spiegel H. 2002. Trace element accumulation in selected bioindicators exposed to emissions along the industrial facilities of Danube Lowland. Turkish Journal of Chemistry, 26(6), 815-824. https://dergipark.org.tr/en/pub/tbtkchem/issue/11943/142838
- Wieczorek-Dabrowska M, Tomza-Marciniak A, Pilarczyk B & Balicka-Ramisz A. 2013. Roe and red deer as bioindicators of heavy metals contamination in north-western Poland. Chemistry and Ecology, 29(2), 100-110. https://doi.org/10.1080/02757540.2012.711322
- Barbieri M. 2016. The importance of enrichment factor (EF) and geoaccumulation index (Igeo) to evaluate the soil contamination. J Geol Geophys, 5(1), 1-4. http://dx.doi.org/10.4172/2381-8719.1000237
- Malik DS & Maurya PK. 2014. Heavy metal concentration in water, sediment, and tissues of fish species (Heteropneustis fossilis and Puntius ticto) from Kali River, India. Toxicological & Environmental Chemistry, 96(8),1195-1206. http://dx.doi.org/10.1080/02772248.2015.1015296
- Luo J, Ye Y, Gao Z & Wang W. 2014. Essential and nonessential elements in the red-crowned crane Grus japonensis of Zhalong Wetland, northeastern China. Toxicological https://doi.org/10.1080/02772248.2015.1007989
- Ahmed F, & Ishiga H. 2006. Trace metal concentrations in street dusts of Dhaka city, Bangladesh. AtmosphericEnvironment, 40(21),3835-3844. http://dx.doi.org/10.1016/j.atmosenv.2006.03.004
- Dabak JD, Gazuwa SY and Ubom GA. 2018. Effect of grade concentrations of Ca on nephrotic cells of Cd and Pb co-intoxicated rats. Journal of Environmental Toxicology and public Health 3: 9-17. http://doi.org/10.5281/zenodo.1165285
- Koboldt DC, Fulton RF, McLellan M, Schmidt H, Kalicki-Veizer J, McMichael J, ... & Iglesia M. 2012. Comprehensive molecular portraits of human breast tumours. Nature, 490(7418),61-70.PMID: 23000897, https://doi.org/10.1038/nature11412
- Omar AMS. 2013. Histopathological and physiological effects of liver and kidney in rats exposed to cadmium and ethanol. Global Advanced Research Journal of Environmental, 2(3), 93-106. http://garj.org/garjest/index.htm
- Dabak JD, Gazuwa SY and Ubom GA (2017). Nephroprotective effect of graded concentrations of Mg on cd and Pb co-intoxicated rats. Journal of Basic and Applied Research International 23(1): 41-50. https://www.ikprress.org/index.php/JOBARI/article/view/4061
- Brzóska MM, Galazyn-Sidorczuk M & Dzwilewska I. 2013. Ethanol consumption modifies the body turnover of cadmium: a study in a rat model of human exposure. Journal of Applied Toxicology, 33(8), 784-798. PMID: 22407952; DOI: 10.1002/jat.2734
- Prozialeck WC, & Edwards JR. 2012. Mechanisms of cadmium-induced proximal tubule injury: new insights with implications for biomonitoring and therapeutic interventions. Journal of Pharmacology and Experimental Therapeutics, 343(1), 2-12. PMID: 22669569; doi: 10.1124/jpet.110.166769
- Gobe G & Crane D. 2010. Mitochondria, reactive oxygen species and cadmium toxicity in the kidney. Toxicology letters, 198(1), 49-55 PMID: 20417263; DOI: 10.1016/j.toxlet.2010.04.013
- Prozialeck WC & Edwards JR. 2010. Early biomarkers of cadmium exposure and nephrotoxicity. Biometals, 23(5), 793-809. PMID: 20107869; DOI: 10.1007/s10534-010-9288-2
- Teschke R. Alcoholic Liver Disease: Alcohol Metabolism, Cascade of Molecular Mechanisms, Cellular Targets, and Clinical Aspects. Biomedicines. 2018 Nov 12;6(4):106. PMID:30424581, DOI: 10.3390/biomedicines 6040106.
- Satarug S, Vesey DA & Gobe GC. 2017. Health risk assessment of dietary cadmium intake: do current guidelines indicate how much is safe? Environmental health perspectives, 125(3), 284-288. PMID: 28248635; DOI: 10.1289/EHP108
- Bergmeyer, H. U., & Bernt, E. 1974. Colorimetric assay of Reitman and Frankel. In Methods of enzymatic analysis Academic press pp. 735-739.
- https://www.elsevier.com/books/methods-of-enzymatic-analysis-v2/bergmeyer/978-0-12-091302-2
- Pawa S & Ali S. 2004. Liver necrosis and fulminant hepatic failure in rats: Protection by oxyanionic form of tungsten. Biochim. Biophys. Acta Mol. Basis Dis., 1688, 210–222. PMID: 15062871; DOI: 10.1016/j.bbadis.2003.12.004
- Girotti MJ, Khan N & McLellan BA. 1991. Early measurement of systemic lipid peroxidation products in the plasma of major blunt trauma patients. J. Trauma, 31, 32–35. PMID: 1846013; DOI: 10.1097/00005373-199101000-00007
- Witko-Sarsat V, Friedlander M, Capeillère-Blandin C, Nguyen-Khoa T, Nguyen AT, Zingraff J & Jungers,P. 1996. Descamps-Latscha,B. Advanced oxidation protein products as a novel marker of oxidative stress in urema. Kidney Int. 49, 1304–1313. PMID: 8731095; DOI: 10.1038/ki.1996.186
- Ellman GL. 1959. Tissue Sulfhydryl Groups. Arch. Biochem. Biophys. 82, 70–77. PMID: 13650640; DOI: 10.1016/0003-9861(59)90090-6
- Misra HP & Fridovich I. 1972. The role of superoxide anion in the autoxidation of epinephrine and a simple assay for superoxide dismutase. J. Biol. Chem. 247, 3170–3175. PMID: 4623845
- Burtis CA & Ashwood ER. 1994. Tietz textbook of clinical chemistry. Amer Assn for Clinical Chemistry. https://www.scirp.org/(S(351jmbntvnsjt1aadkozje))/reference/referencespapers.aspx?reference id=1318123
- Sharma SK, Goloubinoff P & Christen P. 2008. Heavy metal ions are potent inhibitors of protein folding. Biochemical and biophysical research communications, 372(2), 341-345. PMID: 18501191; DOI: 10.1016/j.bbrc.2008.05.052
- Ibiam AU, Ugwuja EI, Ejeogo C & Ugwu O. 2013. Cadmium-induced toxicity and the hepatoprotective potentials of aqueous extract of jessiaea nervosa leaf. Advanced pharmaceutical bulletin, 3(2), 309. PMID: 24312853; doi: 10.5681/apb.2013.050
- Asagba S. 2010. Alteration in the activity of oxidative enzymes in the tissues of male wistar albino rats exposed to cadmium. International journal of occupational Medicine and Environmental Health, 23(1), 55-62. PMID: 20442063; DOI: 10.2478/v10001-010-0002-
- Renugadevi J & Prabu SM. 2010. Cadmium-induced hepatotoxicity in rats and the protective effect of naringenin. Experimental and Toxicologic Pathology, 62(2), 171-181. PMID: 19409769; DOI: 10.1016/j.etp.2009.03.010
- Haidry MT & Malik A. 2014. Hepatoprotective and antioxidative effects of Terminalia arjuna against cadmium provoked toxicity in albino rats (Ratus norvigicus). Biochem Pharmacol, 3(130), 2167-0501. DOI: 10.4172/2167-0501.1000130
- Dabak JD, Gazuwa SY and Ubom GA. 2015b. The hepatoprotective effects of concomitant administration of calcium and magnesium on cadmium and lead co-intoxicated rats. British Journal of Applied Science & Technology 11(5): 1-10. DOI: 10.9734/BJAST/2015/19787
- Kim YD, Yim DH, Eom SY, Moon SI, Park CH, Kim G B, ... & Kim H. 2015. Temporal changes in urinary levels of cadmium, N-acetyl-β-d-glucosaminidase and β2- macroglobulin in individuals in a cadmium- contaminated area. Environmental toxicology and pharmacology, 39(1), 35-41. PMID: 25434760; DOI: 10.1016/j.etap.2014.10.016
- Andjelkovic M, Buha Djordjevic A, Antonijevic E, Antonijevic B, Stanic M, Kotur- Stevuljevic J, Spasojevic-Kalimanovska V, Jovanovic M, Boricic N, Wallace D, Bulat Z. 2019. Toxic Effect of Acute Cadmium and Lead Exposure in Rat Blood, Liver, and Kidney. Int J Environ Res Public Health. Jan 18;16(2):274. PMID: 30669347, DOI: 10.3390/ijerph16020274.
- Dabak JD, Gazuwa SY and Ubom GA 2015. The Nephroprotective Effects of Graded Concentrations of Calcium and Magnesium on Nephrotoxicities Induced by a Constant Toxic Concentration of Cadmium and Lead in Rats. International Journal of Biochemistry Research and Review. 7(1): 36-44. DOI:10.9734/IJBCRR/2015/17119
- Adiyanti SS, Loho T. 2012. Acute Kidney Injury (AKI) biomarker. Acta Med Indones. Jul;44(3):246-55. PMID: 22983082.
- Traslavina RP, King EJ, Loar AS, Riedel ER, Garvey MS, Ricart-Arbona R, Wolf FR, Couto SS. 2010. Euthanasia by CO2 inhalation affects potassium levels in mice. J Am Assoc Lab Anim Sci. May;49(3):316-22. PMID: 20587163.
- Antwi-Baffour S, Adjei JK, Tsyawo F, Kyeremeh R, Botchway FA, Seidu MA. 2019. A Study of the Change in Sodium and Potassium Ion Concentrations in Stored Donor Blood and Their Effect on Electrolyte Balance of Recipients. Biomed Res Int, Sep 29;2019:8162975. PMID: 31662997; doi: 10.1155/2019/8162975.
- Ray S, Kassan A, Busija AR, Rangamani P, Patel HH. 2016. The plasma membrane as a capacitor for energy and metabolism. Am J Physiol Cell Physiol. Feb 1;310(3):C181-92. PMID: 26771520, DOI: 10.1152/ajpcell.00087.2015. Epub 2015 Nov 25.
- Javed M, Ahmad I, Ahmad A, Usmani N, Ahmad M. 2016. Studies on the alterations in haematological indices, micronuclei induction and pathological marker enzyme activities in Channa punctatus (spotted snakehead) perciformes, channidae exposed to thermal power plant effluent. Springerplus. Jun 17;5(1):761. PMID: 27386247,DOI: 10.1186/s40064-016-2478-9.
- Matovic V, Buha A, Bulat Z, Dukic-Cosic D, Miljkovic M, Ivaniševic J & Kotur-Stevuljevic J. 2012. Route-dependent effects of cadmium/cadmium and magnesium acute treatment on parameters of oxidative stress in rat liver. Food and chemical toxicology, 50(3-4), 552-557. PMID: 22240416; DOI: 10.1016/j.fct.2011.12.035
- Brzóska MM, Moniuszko-Jakoniuk J, Pilat-Marcinkiewicz B, Sawicki B. 2003. Liver and kidney function and histology in rats exposed to cadmium and ethanol. Alcohol AlcoholJan-Feb;38(1):2-10. PMID: 12554600, DOI: 10.1093/alcalc/agg006.
- Dinu D, Nechifor MT & Movileanu L. 2006. Ethanol-induced alterations of the antioxidant defense system in rat kidney. Journal of biochemical and molecular toxicology, 19(6), 386-395. PMID: 16421892; DOI: 10.1002/jbt.20101
- Rodrigo R, Trujillo, S, Bosco C Orellana M, Thielemann L & Araya, J. 2002. Changes in (Na+ K)-adenosine triphosphatase activity and ultrastructure of lung and kidney associated with oxidative stress induced by acute ethanol intoxication. Chest, 121(2), 589-596. PMID: 11834676; DOI: 10.1378/chest.121.2.589
- Balasubramaniyan VKSJ, Sailaja JK & Nalini N. 2003. Role of leptin on alcohol-induced oxidative stress in Swiss mice. Pharmacological Research, 47(3), 211-216. PMID: 12591016;DOI: 10.1016/s1043-6618(02)00317-1
- Das SK & Vasudevan DM. 2005. Effect of ethanol on liver antioxidant defense systems: A dose dependent study. Indian Journal of Clinical Biochemistry, 20(1), 80-84. PMID: 23105499; DOI: 10.1007/BF02893047
- Kurutas EB. 2016. The importance of antioxidants which play the role in cellular response against oxidative/nitrosative stress: current state. Nutr J. Jul 25;15(1):71. PMID: 27456681, DOI: 10.1186/s12937-016-0186-5.
- Matovic V, Buha A, Ðukic-Cosic D & Bulat Z. 2015. Insight into the oxidative stress induced by lead and/or cadmium in blood, liver and kidneys. Food and Chemical Toxicology, 78, 130-140.PMID: 25681546; DOI: 10.1016/j.fct.2015.02.011
- Buha A, Bulat Z, Dukic-Cosic D & Matovic, V. 2012. Effects of oral and intraperitoneal magnesium treatment against cadmium-induced oxidative stress in plasma of rats. Archives of Industrial Hygiene and Toxicology, 63(3), 247-254. PMID: 23152374; DOI: 10.2478/10004-1254-63-2012-2217
- Mohammed MS, Gulrana K, Mohammad FA, Sohail H & Mohammad HAS. 2016. Farah Islam and Fakhrul I. Cadmiuminduced nephrotoxicity via oxidative stress in male wistar rats and capsaicin protects its toxicity. Bull Env Pharmacol Life Sci, 5, 5-11. https://www.researchgate.net/publication/299537837
- Suwazono Y, Nogawa K, Morikawa Y, Nishijo M, Kobayashi E, Kido T, ... & Nogawa K. 2015. All-cause mortality increased by environmental cadmium exposure in the Japanese general population in cadmium non-polluted areas. Journal of Applied Toxicology, 35(7), 817-823. PMID: 25534008; DOI: 10.1002/jat.3077
- Liu J, Qu W & Kadiiska MB. 2009. Role of oxidative stress in cadmium toxicity and carcinogenesis. Toxicology and applied pharmacology, 238(3), 209-214. PMID: 19236887; DOI: 10.1016/j.taap.2009.01.029
- Sen S, Chakraborty R, Sridhar C, Reddy YSR & De B. 2010. Free radicals, antioxidants, diseases and phytomedicines: current status and future prospect. International journal of pharmaceutical sciences review and research, 3(1), 91-100. https://www.researchgate.net/publication/261912585
