Echocardiographic Evaluation of His Bundle Pacing in Patients with Prolonged PR Intervals
Article Information
Ethan Fry1*, Karam Ayoub2, Vincent L Sorrell1, Joseph Souza1, Aaron Hesselson1, Steve Leung1, Kristin Ellison1
1Department of Medicine, Division of Cardiovascular Medicine, Gill Heart and Vascular Institute, University of Kentucky, Lexington, KY, USA
2Department of Medicine, Division of Cardiovascular Medicine, Vanderbilt University Medical Center, Nashville, TN, USA
*Corresponding author: Ethan Fry, Department of Medicine, Division of Cardiovascular Medicine, Gill Heart and Vascular Institute, University of Kentucky, Lexington, KY, USA.
Received: 15 Febraury 2023; Accepted: 20 Febraury 2023; Published: 16 March 2023
Citation:
Ethan Fry, Karam Ayoub, Vincent L Sorrell, Joseph Souza, Aaron Hesselson, Steve Leung, Kristin Ellison. Echocardiographic Evaluation of His Bundle Pacing in Patients with Prolonged PR Intervals. Cardiology and Cardiovascular Medicine. 7 (2023): 69-78.
View / Download Pdf Share at FacebookAbstract
Background: Patients with PR intervals >240ms have atrio-ventricular (AV) dyssynchrony, which can increase risk of atrial fibrillation and allcause mortality. When requiring pacing, long AV delays (AVDs) have been programmed to avoid ventricular dyssychrony. His bundle pacing (HBP) may provide improved AV synchrony in patients with prolonged PR.
Methods: 10 patients with sinus node dysfunction and prolonged PR who received HBP were studied. Real-time echocardiographic was performed with 3 pacemaker modes (RV septal, non-selective HBP, and selective HBP) using the following pacemaker settings: control (no ventricular pacing), pacing with AVD of 180ms, 150ms, 120ms, 100ms, and 70ms. Echocardiographic Doppler measurements: EA/RR, >40% = AV synchrony; E/e’, <8 = normal left atrial pressure; pulmonic-to-aortic preejection time difference, <40ms = interventricular synchrony; septal-tolateral wall activation time difference, <56ms = intraventricular synchrony; and LVOT VTI. Unpaired T test was used to evaluate for significance. Exclusion criteria: persistent atrial fibrillation, second-degree AV block.
Results: Compared to control programming, HBP showed a 31.5% increase in EA/RR time, a decrease in E/e’ of 26.9%, and an increase in the LVOT VTI of 21.3%. Compared to RV septal pacing, there was a similar increase in LVOT VTI. These findings met statistical significance and were considered optimal based on Doppler echocardiography findings primarily at AVDs of 150ms and 120ms. Comparisons between selective and non-selective pacing were not significantly different.
Conclusion: Compared to controls and RV septal pacing, physiologic His bundle pacing was shown to increase markers of AV synchrony and LV stroke volume while maintaining ventricular
Keywords
Atrio-Ventricular Synchrony; Echocardiogram; His Bundle Pacing; Prolonged PR; Selective; Non-Selective
Atrio-Ventricular Synchrony articles; Echocardiogram articles; His Bundle Pacing articles; Prolonged PR articles; Selective articles; Non-Selective articles
Article Details
1. Introduction
Pacing techniques have advanced significantly over the past 20 years. Conventional pacing at the right ventricular (RV) apex results in ventricular dyssynchrony, impaired contractility, increased incidence of atrial fibrillation, and decline in ejection fraction [1-4]. Significant data has emerged regarding the benefits of physiologic conduction system pacing with either His bundle pacing (HBP) or left bundle branch pacing (LBBP) [5-7]. Both techniques utilize the intrinsic conduction system to activate the ventricle and can avoid pacemaker-induced dyssynchrony. Several studies have shown the feasibility of conduction system pacing [5, 6], and a recent retrospective study has suggested mortality benefit with physiologic pacing compared to conventional RV pacing [7].
Patients with prolonged PR intervals (>200ms) are at risk for atrio-ventricular (AV) dyssynchrony, impaired diastolic and systolic ventricular function, atrial fibrillation and increased all-cause mortality [8-11]. Conversely, resynchronization with BiV pacing in patients with PR prolongation >230ms and non-LBBB resulted in a significant reduction in risk of death or heart failure, supporting the benefits of AV synchrony restoration [12]. In clinical practice, conventional dual chamber pacing utilizes long AV delays (AVDs) in an effort to avoid RV pacing and preserve ventricular synchrony. However, this programming adversely results in AV dyssynchrony. HBP, with either selective (activating only the His bundle) or non-selective (activating the His bundle and the surrounding RV tissue) settings, may result in improved AV synchrony without causing ventricular dyssynchrony.
In this pilot study, Doppler echocardiography was utilized to investigate the cumulative atrioventricular effects of HBP in patients with a prolonged PR interval.
2. Methods
2.1 Population
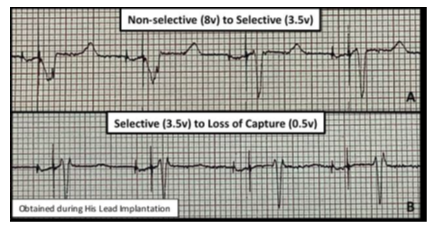
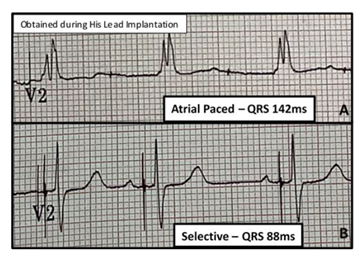
The protocol was approved by the institutional review board at the University of Kentucky. After appropriate informed consent was obtained, ten patients with sinus node dysfunction and PR >240ms who received physiologic His bundle pacemakers were recruited. Baseline electrocardiograms (ECG) at the time of device implantation were obtained. All patients received physician-guided serial echocardiographic evaluations during specific pacemaker settings: Control (native rhythm), AVD of 180ms, 150ms, 120ms, 100ms, and 70ms. These pacemaker settings were obtained during 3 separate pacemaker modes – 1) RV septal pacing only, 2) non-selective HBP, and 3) selective HBP. These pacing modes were achieved by adjusting the output on the His lead as previously described [5, 6] (Figure 1). Patients served as their own controls by comparing changes seen during pacing to their native rhythm. Patients were excluded if they had a history of persistent atrial fibrillation or Mobitz 1 second-degree AV block.
Figure 1: ECG Representation of Pacemaker Modes
2.2 Echocardiography
Focused 2D and Doppler echocardiographic images were performed serially at baseline and at each pacemaker setting. Parasternal long axis (PLAX), apical 2, 3, and 4 chamber views were obtained. Pulsed-wave Doppler (PWD) of the mitral early (E) and late (A) filling and the right and left ventricular outflow tract (RVOT, LVOT) velocities and continuous wave Doppler (CWD) of the LVOT were recorded. Tissue Doppler of the tricuspid and mitral annular velocities were obtained. Multiple semi-quantitative measurements, time intervals, and ratios were obtained.
Markers of AV synchrony, left atrial pressure (LAP), intraventricular synchrony, and LV stroke volume were primary points of investigation. E wave to A wave time compared to the R-to-R interval (EA/RR) was the primary measure of AV synchrony and represents the relative time for left ventricular filling with values >40% considered synchronous [13,14]. Average E/e’ was used as a marker of LAP with values <8 considered normal and values >14 considered elevated. Aortic to pulmonic pre-ejection time differences were used as a marker of inter-ventricular synchrony (<40ms considered normal). Septal to lateral wall activation time (AT) was used as a marker of intra-ventricular synchrony (<56ms considered normal) [15, 16]. LVOT VTI can be used to calculate stroke volume (SV) and cardiac output (CO) using the following formulas: SV = LVOT area (πr2;2) * LVOT stroke distance (VTI; cm); CO = SV* HR. As patients served as their own controls (e.g. LVOT area is constant) and since patients were paced (e.g. HR was constant), LVOT VTI was used as an effective surrogate marker for stroke volume and by extension cardiac output (Table 1).
Table 1: Echocardiographic Parameters and Clinical Significance

Table 1: Echocardiographic measurements, normal values, and their clinical significance.
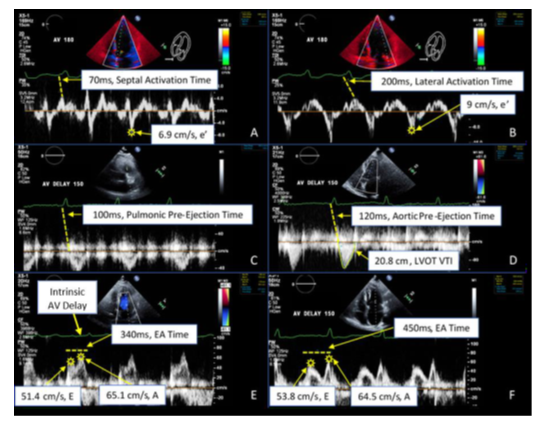
Echocardiographic measurements were performed blinded to the pacing mode (Figure 2). Selective, non-selective, and RV septal pacing modes were attempted in all 10 patients, but clinical and technical limitations resulted in collectable data for selective pacing in 6 of the patients, non-selective pacing in 6 of the patients, and RV septal pacing in 4 of the patients. A total of 83 comprehensive echo Doppler analyses were performed with more than 800 individual echo measurements and 400 echo calculations. Ten percent of these findings were randomly and independently verified with an expert echocardiographer to provide internal validity.
Figure 2: Echocardiographic Doppler Spectrum
Figure 2: Doppler data acquisition. All measurements depicted were obtained at the various AVDs (180ms through 70ms), with several depicted here. (A) Tissue Doppler velocities of the septal (A) and lateral (B) mitral annulus demonstrating the e’ and activation times (dashed line - beginning of QRS to peak mechanical activation). Pulsed-wave Doppler velocities from the pulmonic (C) and aortic (D) outflow tracts demonstrating the pre-ejection times (dashed line - beginning of QRS to initiation of flow) and VTI measures. Pulsed-wave Doppler velocities from the mitral inflow during baseline (control) prolonged AVD (E) and paced AVD 150ms (F) demonstrating the E and A wave velocities and E-A time (dashed line). Note the increased E/A separation and longer ventricular filling time during paced AVD setting of 150ms.
2.3 Statistical Analysis
Sample characteristics are presented using descriptive statistics. Frequencies and percentages are used to describe categorical variables. Means are used to describe continuous variables. An unpaired T test was utilized to test for associations in univariate comparisons of categorical data at a 95% confidence interval. See supplementary index for all p-value tables.
Supplemental Table: Statistical Echocardiographic Indice Comparisons
|
P-Values - Selective Compared to Non-Selective |
|||||
|
AVD 180 |
AVD 150 |
AVD 120 |
AVD 100 |
AVD 70 |
|
|
EA/RR |
0.3904 |
0.3767 |
0.4206 |
0.1944 |
0.1937 |
|
E/e' |
0.4237 |
0.6886 |
0.6067 |
0.693 |
0.9767 |
|
Pre-ejection time PA |
0.5871 |
0.3129 |
0.3975 |
0.0646 |
0.1 |
|
Activation Time SL |
0.0922 |
0.0965 |
0.1438 |
0.1603 |
0.2209 |
|
LVOT VTI |
0.1984 |
0.1545 |
0.1623 |
0.5373 |
0.0935 |
|
LVOT VTI % Change |
0.6549 |
0.7653 |
0.8276 |
0.4386 |
0.3914 |
|
P-Values – Combined Selective/Non-selective Compared to Septal |
|||||
|
AVD 180 |
AVD 150 |
AVD 120 |
AVD 100 |
AVD 70 |
|
|
EA/RR |
0.2096 |
0.2408 |
0.2339 |
0.2259 |
0.2381 |
|
E/e' |
0.5007 |
0.4462 |
0.087 |
0.1133 |
0.1855 |
|
Pre-ejection time PA |
0.0822 |
0.1413 |
0.0442 |
0.0289 |
0.2444 |
|
Activation Time SL |
0.0008 |
0.0643 |
0.0088 |
0.0057 |
0.0426 |
|
LVOT VTI |
0.4307 |
0.418 |
0.4878 |
0.3171 |
0.3782 |
|
LVOT VTI % Change |
0.0036 |
0.0029 |
0.0089 |
0.0079 |
0.0166 |
|
P-Values - Selective Compared to Septal |
|||||
|
AVD 180 |
AVD 150 |
AVD 120 |
AVD 100 |
AVD 70 |
|
|
EA/RR |
0.1367 |
0.0849 |
0.061 |
0.1981 |
0.1428 |
|
E/e' |
0.02 |
0.0464 |
0.091 |
0.1323 |
0.126 |
|
Pre-ejection time PA |
0.1075 |
0.0653 |
0.0494 |
0.0007 |
0.0171 |
|
Activation Time SL |
<0.0001 |
0.0002 |
0.0121 |
<0.0001 |
<0.0001 |
|
LVOT VTI |
0.8767 |
0.8938 |
0.9563 |
0.5135 |
0.7984 |
|
LVOT VTI % Change |
0.0165 |
0.0158 |
0.0397 |
0.0309 |
0.0268 |
|
P values – Non-Selective Compared to Septal |
|||||
|
AVD 180 |
AVD 150 |
AVD 120 |
AVD 100 |
AVD 70 |
|
|
LVOT VTI % Change |
0.0353 |
0.0185 |
0.027 |
0.0097 |
0.0834 |
|
P Values - Combined Selective/Non-Selective Compared to Control |
|||||
|
Control to AVD 180ms |
Control to AVD 150ms |
Control to AVD 120ms |
Control to AVD 100ms |
Control to AVD 70ms |
|
|
EA/RR |
0.0117 |
<0.0001 |
<0.0001 |
<0.0001 |
0.0002 |
|
E/e' |
0.1019 |
0.0479 |
0.0642 |
0.2839 |
0.8185 |
|
LVOT VTI |
0.2221 |
0.0682 |
0.0527 |
0.1421 |
0.4032 |
|
P Values - Combined Selective/Non-Selective AVD Comparisons |
|||||
|
180ms to 150ms |
180ms to 120ms |
180ms to 100ms |
180ms to 70ms |
||
|
EA/RR |
0.0183 |
0.0041 |
0.0033 |
0.0273 |
|
|
E/e' |
0.4769 |
0.6558 |
0.4758 |
0.05 |
|
|
LVOT VTI % |
0.0628 |
0.0641 |
0.5127 |
0.0753 |
|
Supplemental Tables: Results of unpaired T-test analysis for the echo parameters specified between multiple combinations consisting of 2 different pacing modalities. Activation Time SL = Activation time difference between the septal and lateral walls at the mitral annulus as measures by Doppler. Pre-ejection time PA = Pre-ejection time difference between pulmonary to aortic as measured by Doppler.
3. Results
The average age was 76 years old with primarily Caucasian (100%) men (80%). The average baseline PR interval was 304ms (SD = 74). 50% of patients had prolonged QRS >120ms. Most patients (80%) were prescribed beta blockers or anti-arrhythmic medications and 60% had a history of paroxysmal atrial fibrillation (Table 2).
Table 2: Baseline Clinical and Electrocardiographic Characteristics
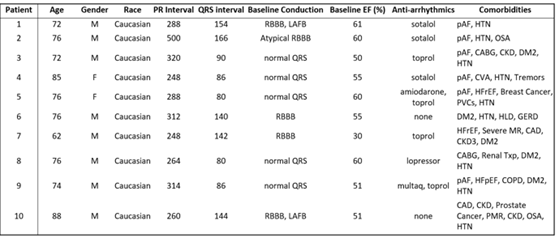
Table 2: PR and QRS Intervals Obtained Prior to HBP. CAD- Coronary Artery Disease; CABG- Coronary Artery Bypass Graft; CKD- Chronic Kidney Disease; COPD- Chronic Obstructive Pulmonary Disease; CVA- Cerebrovascular Accident; DM2- Diabetes Mellitus; HFpEF- Heart Failure with Preserved Ejection Fraction; HFrEF- Heart Failure with Reduced Ejection Fraction; HTN- Hypertension; LAFB- Left Anterior Fascicular Block; MR- Mitral Regurgitation; OSA- Obstructive Sleep Apnea; pAF- Paroxysmal Atrial Fibrillation; PMR- Polymyalgia Rheumatic; RBBB- Right Bundle Branch Block; SND- Sinus Node Dysfunction; txp- Transplant.
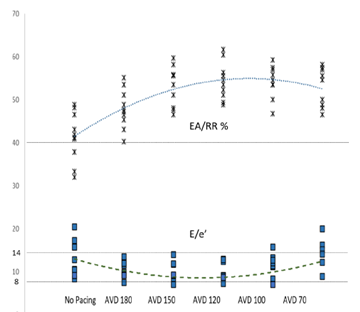
Markers of AV synchrony were initially evaluated and compared. EA/RR time increased with HBP compared to controls with a maximal change seen at an AVD of 120ms (31.5%) (Table 3). The change in the EA/RR ratio when compared to controls was statistically significant at all AVD categories, though the largest difference was seen at AVDs of 150,120, and 100ms (p<0.001). Controls had 4 patients with EA/RR ratio <40%, which increased to >40% with HBP (Figure 3). E/e’ showed peak reduction at an AVD of 120ms with a decrease in the E/e’ ratio of 33.6% compared to controls (Figure 3). At shorter AVDs (100 and 70ms), the E/e’ actually increased (Table 3). No control patient had normal LAP (E/e’ <8) and 4 had elevated LAP (E/e’ >14). With HBP, all patients achieved an E/e’ <14 and 3 were able to achieve E/e’ <8 (Figure 3). Reduction of the E/e’ value was statistically significant when compared to control at an AVD of 150ms (p=0.048). To evaluate whether changes seen were due primarily to initiation of pacing as opposed to reduction in AV delay, changes between AVD 180ms and AVD 150-70ms were compared which showed significant increases in EA/RR time (at all AVDs) and trends of reduction in E/e’ (at AVDs of 150 and 120ms) (Table 3).
Figure 3: AV Synchrony and Left Sided Filling Pressures
Figure 3: The superior portion of the graph details the EA/RR ratio in percentages. AVD values are displayed in milliseconds. A dotted line depicts the average value trends as you progress from control to AVD of 70. The inferior portion details the E/e’ absolute values with a similar dashed line depicting average trend. Straight dotted lines are displayed at 40% EA/RR%, 14 E/e’, and 8 E/e’, which are the thresholds for AV synchrony (above line), elevated LAP (above line), and normal LAP (below line) respectively.
Table 3: Average Values of HBP Pacing Compared to Control
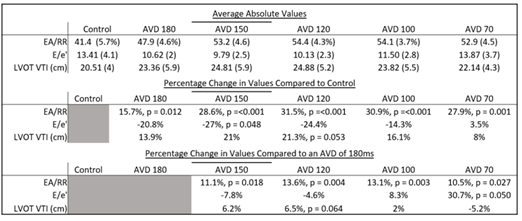
Table 3: Divided into 3. The top section has the average values obtained for each category. Standard deviation displayed in (). The middle section displays the percentage change of the various pacing categories obtained in the top compared to controls. The bottom section displays the percentage change of these same pacing categories compared to what was obtained with an AVD of 180ms.
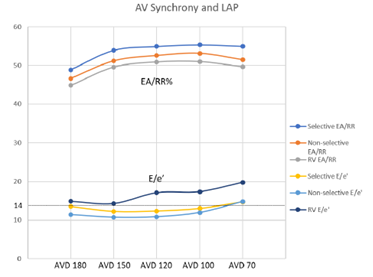
To evaluate for potential benefit in patients that would normally qualify for standard dual chamber pacing, HBP was compared to conventional RV pacing which demonstrated an increase in the EA/RR ratio at all AVDs. The most prominent increase was seen when comparing selective HBP to RV pacing at an AVD of 120ms (p = 0.06) (Figure 4). E/e’ values were decreased in the HBP group when compared to the conventional RV pacing group. Selective pacing at AVDs of 180ms and 150ms showed a significant decrease in E/e’ (p = 0.02 and 0.046, respectively) when compared to RV pacing. There was no significant difference when comparing E/e’ between selective and non-selective pacing at any AVDs, though selective HBP trended towards higher EA/RR and lower E/e’ values (Figure 4).
Figure 4: Comparison of AV Synchrony Between Pacing Groups
Figure 4: Measures of AV synchrony displayed with a straight dotted line detailing the clinical mark of 14, above which indicates elevated LAP. Dark blue line is selective EA/RR; Orange line is non-selective EA/RR; Gray line is right ventricular EA/RR; Yellow is selective HBP E/e’; Light blue is non-selective HBP E/e’; and Purple is right ventricular E/e’.
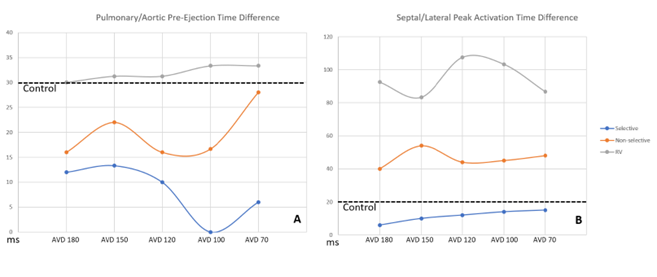
HBP resulted in shorter Pulmonary/Aortic pre-ejection time differences compared to controls, with selective HBP demonstrating significant reductions when compared to conventional RV pacing at AVDs of 120ms, 100ms, and 70ms (p = 0.049, <0.001, and 0.017). Though no pacing groups had Pulmonary/Aortic pre-ejection time differences >40ms, which is the clinical mark of inter-ventricular dyssynchrony. RV pacing was considered intra-ventricularly dyssynchronous, however, at all AVDs with pre-ejection times >56ms. HBP pacing with both selective and non-selective modes demonstrated more intra-ventricular synchrony (93% improvement) compared to conventional RV pacing (p<0.001). Selective pacing had shorter activation time differences compared to controls. (Figure 5b).
Figure 5: Comparison of Ventricular Synchrony Between Pacing Groups
Figure 5: Measures of ventricular synchrony displayed with inter-ventricular synchrony in panel A, while intra-ventricular synchrony displayed in panel B. The average control pre-ejection/activation times for inter/intra ventricular synchrony are displayed with straight dotted lines. Blue line is selective HBP; Orange is non-selective HBP; Gray is right ventricular pacing.
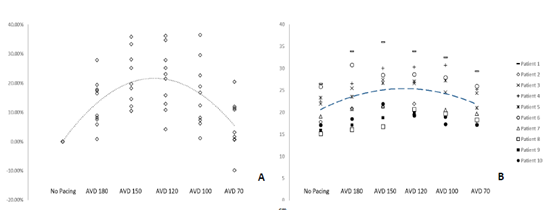
A mean increase in LVOT VTI was seen with HBP that peaked at an AVD of 120ms with an increase of 21.3% when compared to controls (p = 0.053) (Table 3, Figure 6a). Figure 6b details individual patient variation of LVOT VTI, showing a degree of patient variability at the various AVDs. The highest values were primarily seen at an AVD of 150ms or 120ms. The mean LVOT VTI worsened at an AV delay of 70ms when compared to the mean LVOT VTI at 180ms (Table 3).
Figure 6: Absolute and Percent Change of LVOT VTI
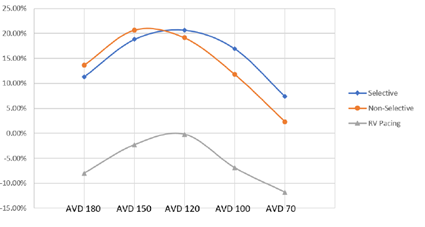
HBP resulted in increased LVOT VTI at all AVDs when compared to RV pacing (p = 0.01) for non-selective and p = 0.016 for selective) (Figure 7), without significant differences between non-selective or selective. RV pacing was deleterious to LVOT VTI compared to control and was only able to achieve no difference between control and RV pacing at an AVD of 120ms.
Figure 7: LVOT VTI % Change Between Pacing Modes
In 2 cases, patient 1’s QRS decreased from 166ms to 90ms while patient 7’s QRS decreased from 142ms to 88ms (Figure 8) due to the capture of an atypical RBBB and RBBB respectively, below the level of the block.
Figure 8: RBBB Capture
4. Discussion
Physiologic pacing via the His bundle began clinical use in the early 2000s [17]. Recent data from experienced centers demonstrated >90% HBP lead placement success and similar fluoroscopy and procedural times in patients with a narrow QRS at baseline when compared to right ventricular pacing [18]. Biventricular pacing/cardiac resynchronization therapy (CRT) has proven to be very effective in improving LV global systolic function in patients with LBBB or widened QRS and need for pacing with reduced ejection fraction [19,20] and is considered a standard therapeutic approach for this patient population. HBP can also provide CRT when the His lead is able to capture the virtual electrode of pacing, distal to the site of block within the His bundle, recruiting the blocked bundles [21–23]. In patients in whom HBP was successfully achieved, echocardiographic outcomes were comparable or trended towards better for HBP-CRT relative to BiV-CRT [24, 25]. Of note, biventricular pacing is not indicated for patients with QRS <120ms or non LBBB morphologies [20], and may not achieve adequate resynchronization in patients with prolonged PR intervals [26].
With respect to individual components, HBP shows a noteworthy improvement in markers of AV synchrony when compared to controls. All patients with His bundle pacing were able to achieve >40% EA/RR and E/e’ <14 compared to 60% of controls, and 30% achieving normal LAP pressures compared to 0% of controls. This is due to atrial lead sensing, which may allow for closer pairing of ventricular contractions with atrial activity. Though HBP trended towards higher markers of AV synchrony, improvement in these markers occurred in both HBP and RV pacing. However, HBP outperformed RV pacing in other ways, including LVOT VTI. This finding indicates that HBP may allow for more synchronized filling of the ventricle, independent of optimizing AVDs. While AV synchrony was optimized for most patients at an AVD of 150ms or 120ms it is important to note that two patients had optimum improvement with an AVD of 100ms. This highlights the individual nature of pacing optimization and that each patient is unique in their pacemaker needs. In addition, optimal AVDs may change over time for patients based on other factors, such as loading conditions, requiring additional optimization over time.
RV pacing resulted in marked intra-ventricular dyssynchrony (>56ms), while there was no evidence of His bundle pacing causing any degree of ventricular dyssynchrony. Improvement in intra-ventricular synchrony may be affected by correction or improvement of underlying conduction disease with HBP, which was most evident in 2 patients who had recruitment of the right bundles. This is emphasized by an average shortening of the QRS duration by 24ms with HBP in patients with underlying conduction disease, compared to controls. However, this degree of QRS narrowing did not meet markers of statistical significance and when evaluating the entire cohort, the average decrease in QRS was only 4ms.
Both AV and ventricular synchrony changes are likely secondary to utilization of the pre-existing conduction system. Being able to harness the native circuitry avoids ventricular dyssynchrony, as long as there is an absence of infra-Hissian conduction disease, or if the conduction system pacing captures beyond the level of the block. This, in turn, allows maintenance of ventricular synchrony at lower AVDs, which results in improved AV synchrony.
Improvement of LVOT VTI with HBP was significant with an average increase of >20% compared to controls which approached statistical significance (p = 0.053), without a notable difference between non-selective and selective HBP. The increased LVOT VTI is in part due to improved AV synchrony and subsequent LV filling, resulting in higher stroke volume. This is supported by simultaneous drops in AV synchrony and LVOT VTI at the shorter AVD of 70ms, despite ventricular synchrony being maintained. Furthermore, the highest LVOT VTIs and the most improved AV synchrony were seen at similar AVDs (150ms and 120ms). However, the degree of improvement in AV synchrony when comparing HBP to RV pacing (10.6%) was less than what was seen when comparing HBP to controls (31.5%). This would suggest that maintaining ventricular synchrony along with increased AV synchrony contributed to the increased LVOT VTI seen in HBP when compared to RV pacing. QRS narrowing when compared to baseline is unlikely to have contributed to the increase LVOT VTI, as there was only a minimal reduction in QRS on average, as previously noted. The increased LVOT VTI seen with HBP is a valuable physiologic finding as it serves as a marker of LV stroke volume. Accordingly, His bundle pacing at AVDs that maximize LVOT VTI may result in improved symptoms, and/or hemodynamics. In addition, very low LVOT VTI is predictive of adverse outcomes [27] and therefore, augmenting this value may improve prognosis. This is particularly important when considered RV pacing in patients with compromised LV function, as RV pacing was shown to be primarily deleterious to LVOT VTI.
These findings are applicable to not only patients with sinus node dysfunction and prolonged PR intervals, but theoretically may benefit patients with heart failure and prolonged PR intervals who would otherwise not qualify for resynchronization therapy, such has those without an underlying LBBB or IVCD. This echo study provides greater understanding of the physiologic and structural impacts of His bundle pacing in the setting of prolonged PR intervals, as well as providing insight into potential benefits of individual patient device programming.
5. Limitations
There are several limitations in this study. This is a single center, non-randomized study and the population is small, limiting generalizability. Interventricular synchrony was primarily shown via septal to lateral wall activation time and independent assessment of the right ventricular wall was not performed. LV stroke volume was not directly measured with the LVOT VTI being used as a surrogate marker. Lastly, there was an overall decrease in QRS duration which may have contributed to the Doppler findings, though this decrease was not statistically significant and is thought less likely to have impacted the results.
6. Conclusions
In this single center, observational study, patients with prolonged PR intervals >240ms were demonstrated by Doppler echocardiography to have improved markers of AV synchrony, LAP, and LV stroke volume using physiologic HBP compared to controls or conventional RV pacing, while maintaining ventricular synchrony. This benefit of HBP was noted with both selective and non-selective pacing modes. Doppler echocardiographic evaluation of other forms of conduction system pacing, such as left bundle branch or left bundle branch area pacing, would be beneficial. Larger prospectively designed studies are required to demonstrate if these imaging findings portend clinical benefits, especially in the heart failure population.
References
- Tops LF, Schalij MJ, Bax JJ. The effects of right ventricular apical pacing on ventricular function and dyssynchrony implications for therapy. J Am Coll Cardiol 54 (2009): 764-776.
- Tse HF, Lau CP. Long-term effect of right ventricular pacing on myocardial perfusion and function. J Am Coll Cardiol 29 (1997): 744-749.
- Sweeney MO, Hellkamp AS, Ellenbogen KA, et al. Adverse effect of ventricular pacing on heart failure and atrial fibrillation among patients with normal baseline QRS duration in a clinical trial of pacemaker therapy for sinus node dysfunction. Circulation 107 (2003): 2932-2937.
- Wilkoff BL, Cook JR, Epstein AE, et al. Dual Chamber and VVI Implantable Defibrillator Trial Investigators. Dual-chamber pacing or ventricular backup pacing in patients with an implantable defibrillator: the Dual Chamber and VVI Implantable Defibrillator (DAVID) Trial. JAMA 288 (2002): 3115-3123.
- Deshmukh PM, Romanyshyn M. Direct His-bundle pacing: present and future. Pacing Clin Electrophysiol 27 (2004): 862-870.
- Sharma PS, Ellenbogen KA, Trohman RG. Permanent His Bundle Pacing: The Past, Present, and Future. J Cardiovasc Electrophysiol 28 (2017): 458-465.
- Sharma PS, Patel NR, Ravi V, et al. Clinical outcomes of left bundle branch area pacing compared to right ventricular pacing: Results from the Geisinger-Rush Conduction System Pacing Registry. Heart Rhythm 19 (2022): 3-11.
- Crisel RK, Farzaneh-Far R, Na B, et al. First-degree atrioventricular block is associated with heart failure and death in persons with stable coronary artery disease: data from the Heart and Soul Study. Eur Heart J 32 (2011): 1875-1880.
- Salden FCWM, Kutyifa V, Stockburger M, et al. Atrioventricular dromotropathy: evidence for a distinctive entity in heart failure with prolonged PR interval? Europace 20 (2018): 1067-1077.
- Cheng S, Keyes MJ, Larson MG, et al. Long-term outcomes in individuals with prolonged PR interval or first-degree atrioventricular block. JAMA 301 (2009): 2571-2577.
- Nielsen JB, Pietersen A, Graff C, et al. Risk of atrial fibrillation as a function of the electrocardiographic PR interval: results from the Copenhagen ECG Study. Heart Rhythm 10 (2013): 1249-1256.
- Stockburger M, Moss AJ, Klein HU, et al. Sustained clinical benefit of cardiac resynchronization therapy in non-LBBB patients with prolonged PR-interval: MADIT-CRT long-term follow-up. Clin Res Cardiol 105 (2016): 944-952.
- Yu CM, Sanderson JE, Gorcsan J 3rd. Echocardiography, dyssynchrony, and the response to cardiac resynchronization therapy. Eur Heart J 31 (2010): 2326-2337.
- Cai B, Huang X, Li L, et al. Evaluation of cardiac synchrony in left bundle branch pacing: Insights from echocardiographic research. J Cardiovasc Electrophysiol 31 (2020): 560-569.
- Gorcsan J 3rd, Abraham T, Agler DA, et al. American Society of Echocardiography Dyssynchrony Writing Group. Echocardiography for cardiac resynchronization therapy: recommendations for performance and reporting--a report from the American Society of Echocardiography Dyssynchrony Writing Group endorsed by the Heart Rhythm Society. J Am Soc Echocardiogr 21 (2008): 191-213.
- Bax JJ, Bleeker GB, Marwick TH, et al. Left ventricular dyssynchrony predicts response and prognosis after cardiac resynchronization therapy. J Am Coll Cardiol 44 (2004): 1834-1840.
- Deshmukh P, Casavant D, Romanyshyn M, et al. Permanent direct HB pacing: A novel approach to cardiac pacing in patients with normal His-Purkinje activation. Circulation 101 (2000): 869-877.
- Sharma PS, Dandamudi G, Naperkowski A, et al. Permanent His-bundle pacing is feasible, safe, and superior to right ventricular pacing in routine clinical practice. Heart Rhythm 12 (2015): 305-312.
- Cleland JG, Daubert JC, Erdmann E, et al. Cardiac Resynchronization-Heart Failure (CARE-HF) Study Investigators. The effect of cardiac resynchronization on morbidity and mortality in heart failure. N Engl J Med 352 (2005): 1539-1549.
- Moss AJ, Hall WJ, Cannom DS, et al. MADIT-CRT Trial Investigators. Cardiac-resynchronization therapy for the prevention of heart-failure events. N Engl J Med 361 (2009): 1329-1338.
- Lustgarten DL, Crespo EM, Arkhipova-Jenkins I, et al. His-bundle pacing versus biventricular pacing in cardiac resynchronization therapy patients: A crossover design comparison. Heart Rhythm 12 (2015): 1548-1557.
- Vijayaraman P, Dandamudi G. Anatomical approach to permanent His bundle pacing: Optimizing His bundle capture. J Electrocardiol 49 (2016): 649-657.
- Upadhyay GA, Cherian T, Shatz DY, et al. Intracardiac Delineation of Septal Conduction in Left Bundle-Branch Block Patterns. Circulation 139 (2019): 1876-1888.
- Upadhyay GA, Vijayaraman P, Nayak HM, et al. His Corrective Pacing or Biventricular Pacing for Cardiac Resynchronization in Heart Failure. J Am Coll Cardiol 74 (2019): 157-159.
- Vinther M, Risum N, Svendsen JH, et al. A Randomized Trial of His Pacing Versus Biventricular Pacing in Symptomatic HF Patients With Left Bundle Branch Block (His-Alternative). JACC Clin Electrophysiol 7 (2021): 1422-1432.
- Atwater BD, Emerek K, Sørensen PL, et al. PR Prolongation predicts inadequate resynchronization with biventricular pacing in left bundle branch block. Pacing Clin Electrophysiol 42 (2019): 1477-1485.
- Tan C, Rubenson D, Srivastava A, et al. Left ventricular outflow tract velocity time integral outperforms ejection fraction and Doppler-derived cardiac output for predicting outcomes in a select advanced heart failure cohort. Cardiovasc Ultrasound 15 (2017): 18.

