Diagnostic Sensitivity, Specificity, and Likelihood Ratio Dependent on Prevalence of Disease-Underlying Cause
Article Information
Walter Fierz
LabPoint Laboratoires Médicaux SA | Route de la Plaine 49 | CH – 1580 Avenches, Switzerland
*Corresponding author: Walter Fierz, LabPoint Laboratoires Médicaux SA | Route de la Plaine 49 | CH – 1580 Avenches, Switzerland.
Received: 02 July 2023; Accepted: 10 July 2023; Published: 18 July 2023
Citation: Walter Fierz. Diagnostic Sensitivity, Specificity, and Likelihood Ratio Dependent on Prevalence of Disease-Underlying Cause. Archives of Microbiology and Immunology. 7 (2023): 96-110
View / Download Pdf Share at FacebookAbstract
In the process of medical diagnostics many types of tests are used, among them in vitro diagnostic laboratory tests. The performances of such tests are usually examined in clinical studies with a disease prevalence that is different from the prevalence of the disease in another clinical setting. The question then is whether diagnostic test characteristics like sensitivity, specificity and likelihood ratios are independent on the prevalence of the disease. The answer to this question is quite important when applying the test performance characteristics of a clinical study in a different clinical diagnostic setting. Here, it is demonstrated that, apart from special cases, test characteristics are indeed dependent on the prevalence of the disease. First, the underlying theoretical model of this dependence is demonstrated and, second, the model is validated with three practical diagnostic examples, i.e myocardial infarction, autoimmune disease, and vitamin-B12 deficiency.
Keywords
ROC, Likelihood Ratio, sensitivity, specificity, prevalence, AMI, troponin, SLE, SmDP-S, Vitamin-B12
ROC articles, Likelihood Ratio articles, sensitivity articles, specificity articles, prevalence articles, AMI articles, troponin articles, SLE articles, SmDP-S articles, Vitamin-B12 articles
Article Details
1. Introduction
One aspect that needs to be discussed when using Likelihood Ratios (LR) in clinical diagnostics is the question whether sensitivities, specificities, i.e. ROC curves, and with them, LR are independent on the prevalence of the disease to be diagnosed. In fact, there is quite some controversy about this question in the literature. An early publication to this topic, that is often cited, claims that sensitivity, specificity and LR vary with disease prevalence [1]. At the same time, Choi provided the statistical model for a solution to the problem [2]. A later review gave many examples for the influence of disease prevalence on test characteristics [3]. On the other hand, in many publications, sensitivities, specificities, and LR are considered independent of disease prevalence without providing reasons for that claim.
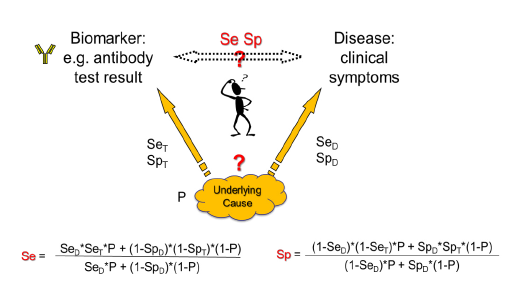
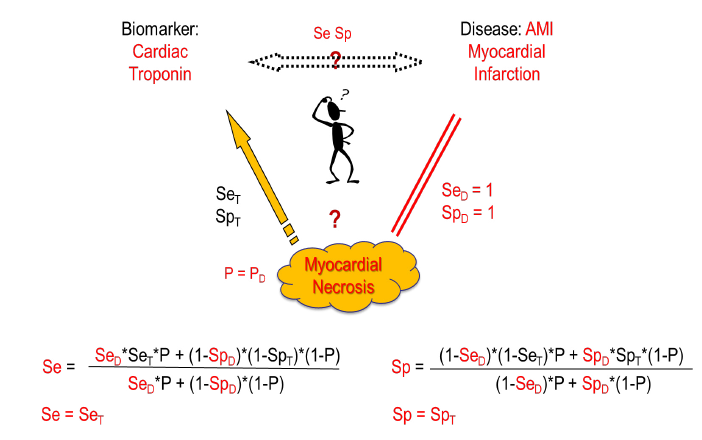
Here we try to clarify the issue based on Choi’s causal model [2]. Usually, in diagnostic tests a biomarker is measured that correlates with a certain disease. Generally, an underlying cause creates the disease and at the same time gives rise to the biomarker. When the biomarker is measured, the underlying cause, e.g. a virus, is detected with a certain sensitivity (SeT) and specificity (SpT) of the test. On the other side, the disease is induced by the underlying cause with a certain disease-specific sensitivity (SeD) and specificity (SpD), i.e. the cause might not always lead to disease (SeD<1) and/or the disease might have other causes (SpD<1). The overall relation between the biomarker and the disease with its relation-specific sensitivity (Se) and specificity (Sp) is then dependent on the prevalence of the underlying cause (P) (figure 1).
Whereas this causal model shows the general correlation between disease prevalence and test characteristics, there are important special cases: When the disease is always induced by the underlying cause (SeD=1) and has no other causes (SpD=1), then Se=SeT and Sp=SpT independent of the disease prevalence and only defined by the biomarker test accuracy to detect the underlying cause. This might be the case e.g., in certain viral infections like HIV infection or COVID-19 where we look not for the clinical disease but for the infection status. In autoimmunity, an example would be myasthenia gravis with antibodies to acetylcholine receptor or muscle specific kinase or low-density lipoprotein receptor-related protein as biomarkers and at the same time causal agents for the disease. Other examples might be given when the disease is partly defined by the presence of the biomarker like in ANCA associated vasculitis [4]. But in other cases, like ANA-diagnostics, the cause that leads to ANAs not always leads to connective tissue disease (CTD) (SeD<1) and not every CTD is ANA-positive (SpD<1).
Is there a way out of this dependence on disease prevalence? The best solution would be given when the test population that is used for clinical studies would exhibit the same prevalence of the disease in question as the population in a clinical setting. However, very often when testing rare diseases, the studies use a study population with a much higher prevalence. In these cases, the ROC curves and LR of the study cannot directly be applied in the diagnostic situation in a population with much lower prevalence. It would be necessary to recalculate the ROC curve and LRs using the formulas shown in figure 1 [2].
2. Results
First, the underlying theoretical model of the prevalence dependency is illustrated and, second, the model is validated with three practical diagnostic examples.
2.1 Model
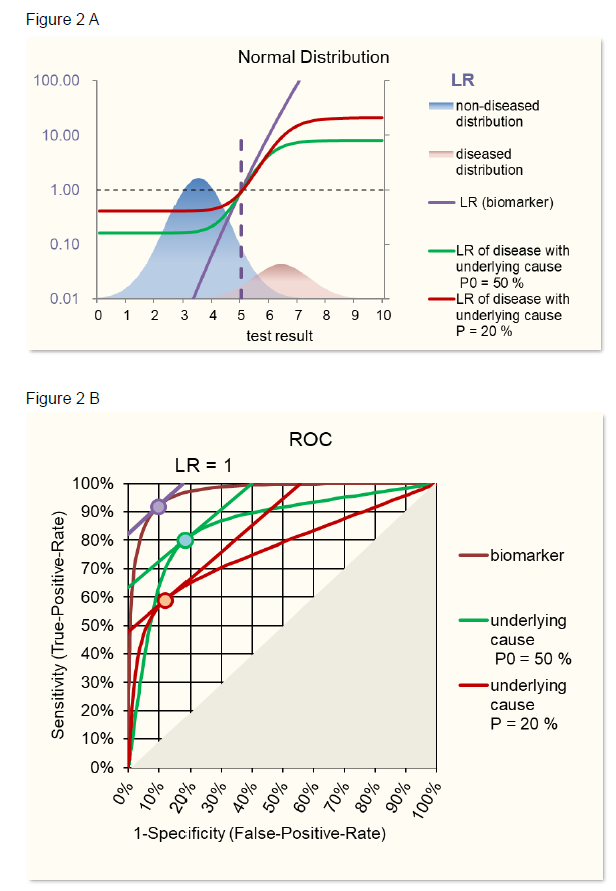
Theoretical examples are given in figure 2 using ROC curves based on normal distributions and in figure 3 using ROC curves based on, more general, S-distributions [5, 6]. When the characteristics of a biomarker test to detect the underlying cause is not explicitly known, SeT and SpT can be deduced from the Se and Sp of the biomarker-disease relation and SeD and SpD of the relation between underlying cause and disease using following formulas based on Choi’s causal model [2] (figure 1).

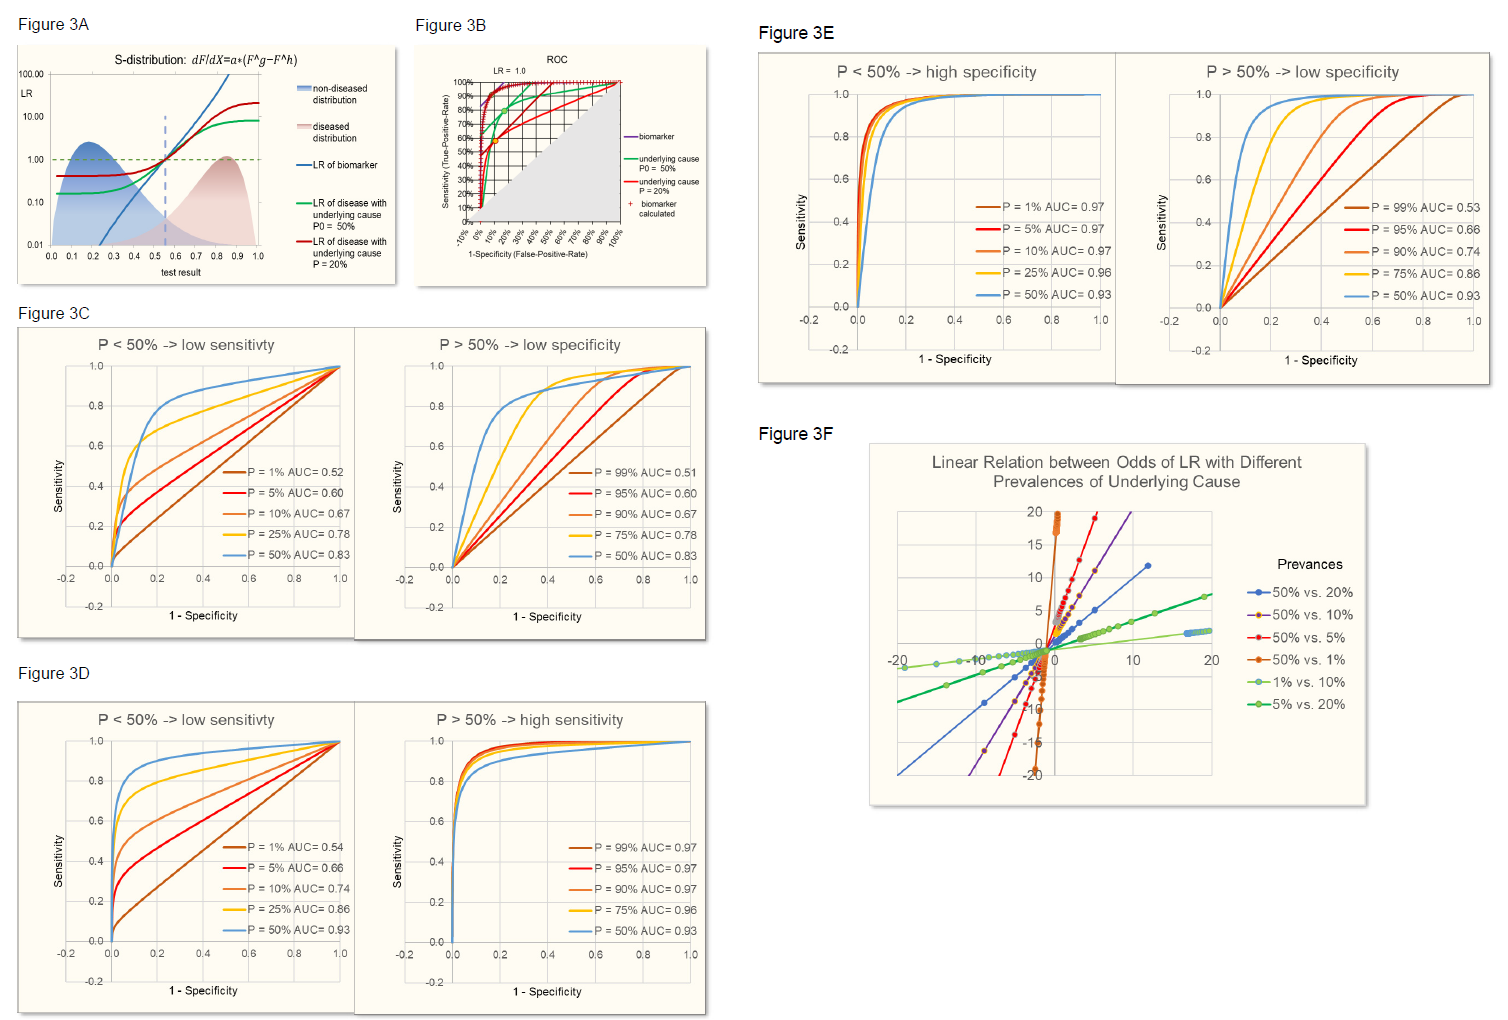
Figure 3B demonstrates the identity of such calculated biomarker ROC with the original biomarker ROC.
With SeD and SpD lower than 1, when varying prevalences, the maximum area under the curve AUC, a measure of the discriminating power of the test, is reached with a prevalence of 50%. Prevalences lower than 50% lead to lower sensitivities and prevalences above 50% lead to lower specificities (figure 3C), the latter having also been observed in the review of Leeflang [3].
Figure 3: S-distributions of biomarker test results for diseased and control population (A) leading to ROC curves (B) depend on the prevalence of the underlying cause as described in figure 2. With SeD and SpD lower than 1 (here e.g. = 0.85), prevalence (P) smaller than 50% leads to lower sensitivity and slightly higher specificity. Prevalence higher than 50% leads to lower specificity (C) and slightly higher sensitivity. When SeD = 1, P > 50% leads to higher sensitivities and specificities approaching 1 (D). When SpD = 1, P < 50% leads to higher specificities and sensitivities approaching 1 (E). The relation between odds of LR (odds=LR/(1-LR)) based on different prevalences always is linear (F).
In addition, it is demonstrated that there is a linear relationship between the odds of LR of one prevalence of the underlying cause of disease and the odds of LR of another prevalence (figure 3F). Of note, this linear relationship is independent on the parameters of the normal or S-distributions of the positive and negative population, provided that the characteristics of the distributions don’t change with the prevalence. However, linear relations of course depend on the sensitivity (SeD) and specificity (SpD) of the relation between underlying cause and disease.
2.2 Validation
The theoretical model is validated with three real-life examples using first acute myocardial infarction, second, an autoimmune disease, and third, Vitamin-B12 deficiency.
2.2.1 Acute myocardial infarction (AMI) and cardiac troponin
In AMI diagnostics, high-sensitivity cardiac troponin (hs-cTnT) is used as a biomarker for myocardial infarction early after symptom onset [7]. The underlying cause of AMI is cardiac ischemia leading to necrosis of the heart muscle and consequent release of troponin that is extensively used as a biomarker for AMI. In this example, the prevalence of the underlying cause, i.e. necrosis, is dependent on the time after the first ischemic symptoms. For measurement of troponin, the Elecsys® high-sensitive Troponin-T blood test was used. The troponin levels were evaluated at time 0, when patients were presenting with suspected AMI within 1 h of symptom onset to the emergency department, after 3 hours, and after 6 hours. Myocardial necrosis was diagnosed by at least one hs-cTnT value above the 99th percentile together with significant rising and/or falling, and ST segment elevation in the electrocardiogram (STEMI). Controls were patients with, unstable angina, patients with other cardiac problems and patients with symptoms of non-cardiac origin.
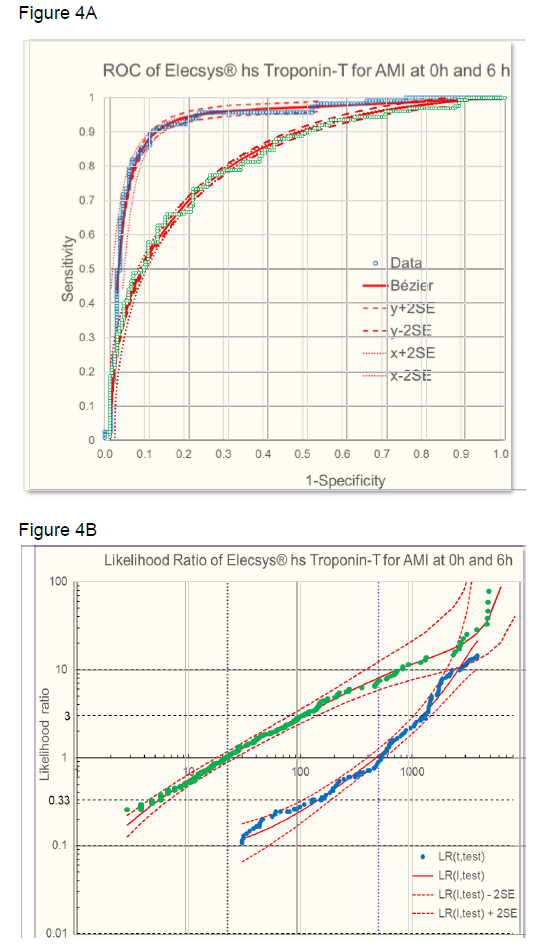
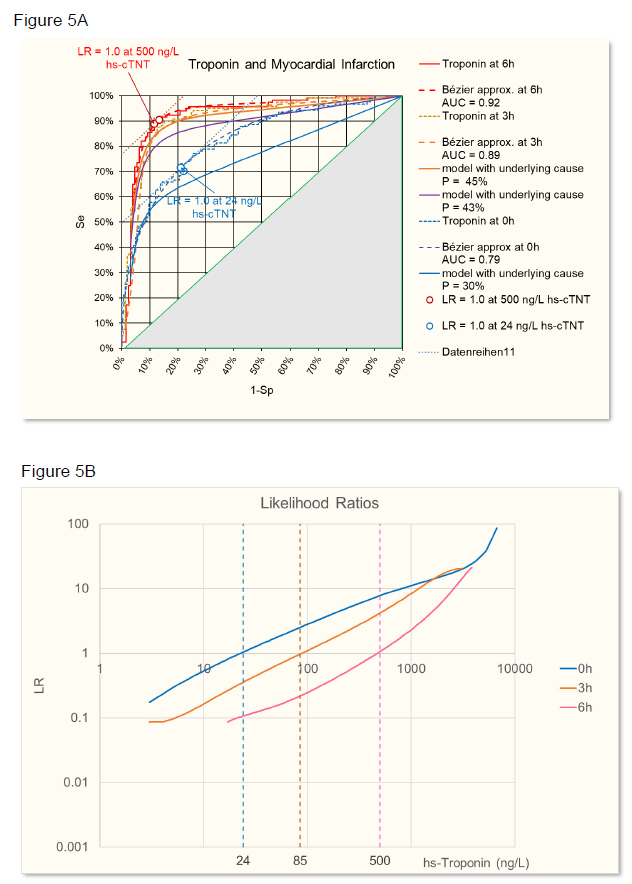
The sensitivity and specificity of the troponin test was evaluated at time 0h, 3h, and 6h using ROC analysis. The ROC from raw data were approximated with a Bézier curve (figure 4A) to calculate likelihood ratios (figure 4B [8, 9]. At time 0h, the troponin test was less discriminant (AUC = 0.79) than later when necrosis has progressed at time 3h (AUC = 0.89) or at time 6h (AUC = 0.92) (figure 5A). Accordingly, LRs were different at the three time points and troponin levels increased in time, based on increasing myocardial necrosis (figure 5B).
B: Likelihood ratios of AMI dependent on troponin levels at time 0h (● grren) and 6h (● blue) l- approximated (red line ± 2 SE [8].
Figure 5: A: ROC of AMI given by troponin levels at time 6h (red), 3h (orange), and 0h (blue). Raw data and Bézier cruve approximations are given. Calculated ROC for different prevalences (P) of the underlying cause (necrosis) are given for time 0h and 3h. In addition, a hypothetical ROC for a time point between 0h and 3h is calculated. The points on the ROC where LR =1 (slope of the tangent to the curve) with troponin levels as indicated in B are given for 6h and 0h.
B: Likelihood ratios of AMI dependent on troponin levels at time 6h (red), 3h (orange), and 0h (blue).
Using Choi’s causal model [2] and assuming that at time 6h the myocardial necrosis leading to infarction has reached a level where SeD = 1 and SpD =1, i.e. necrosis equals infarction (P = PD), then Se = SeT and Sp = SpT, according to figure 6. Starting from this situation, the ROC of other time points have been calculated using the parameters given in table 1, time point 2h being hypothetical, in between 0h and 3h. SeD is assumed to equal 100%, since in the study one criterium for the final clinical diagnosis of AMI is at least one hs-cTnT value above the 99th percentile, so the sensitivity of disease diagnosis to myocardial necrosis is 100%. SpD is lower than 100% because at the time of troponin measurement at 0h and 3h myocardial necrosis has not yet reached the level that leads to the final diagnosis of AMI. The prevalence of necrosis is calculated from the prevalence of disease with SeD and SpD that were estimated to optimize the fit of the calculated ROC with the observed ROC at time 0h and 3h.
Table 1
|
Time point |
P Disease |
SeD estimated |
SpD estimated |
P Necrosis |
|
P = PD * SpD / SeD |
||||
|
3h observed |
47.40% |
100% |
95% |
45% |
|
2h hypothetical |
100% |
90% |
43% |
|
|
0h observed |
42.60% |
100% |
70% |
30% |
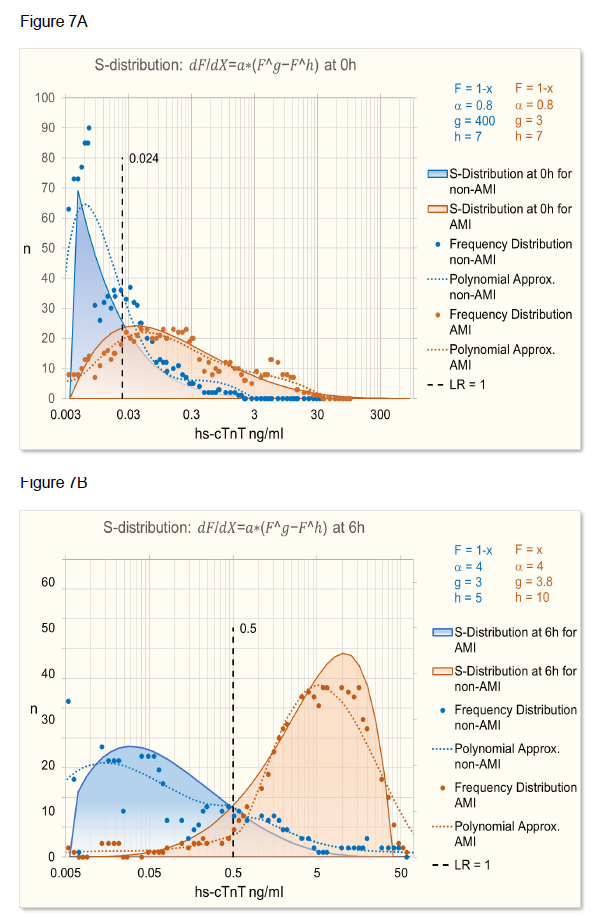
As can be seen in figure 5A, the calculated ROC at time 0h does not quite fit the observed ROC. The reason for it is that the distribution of troponin levels at time 0h and 6h is different as can be seen in figure 7.
2.2.2 Systemic lupus erythematosdes (SLE) and SmDP-S antibodies
In the laboratory, several autoantibodies are used to diagnose SLE. Most commonly, for a first screening, anti-nuclear antibodies (ANA) tests are used that might detect several sub species of ANA [10]. One specific biomarker for SLE are antibodies to SmD that provide a high specificity for SLE (Sp >98%), albeit with a low sensitivity (Se <15%) [11]. Here, we use study data provided by the manufacturer of a test to detect such antibodies (EliA SmDP-S) to diagnose SLE.
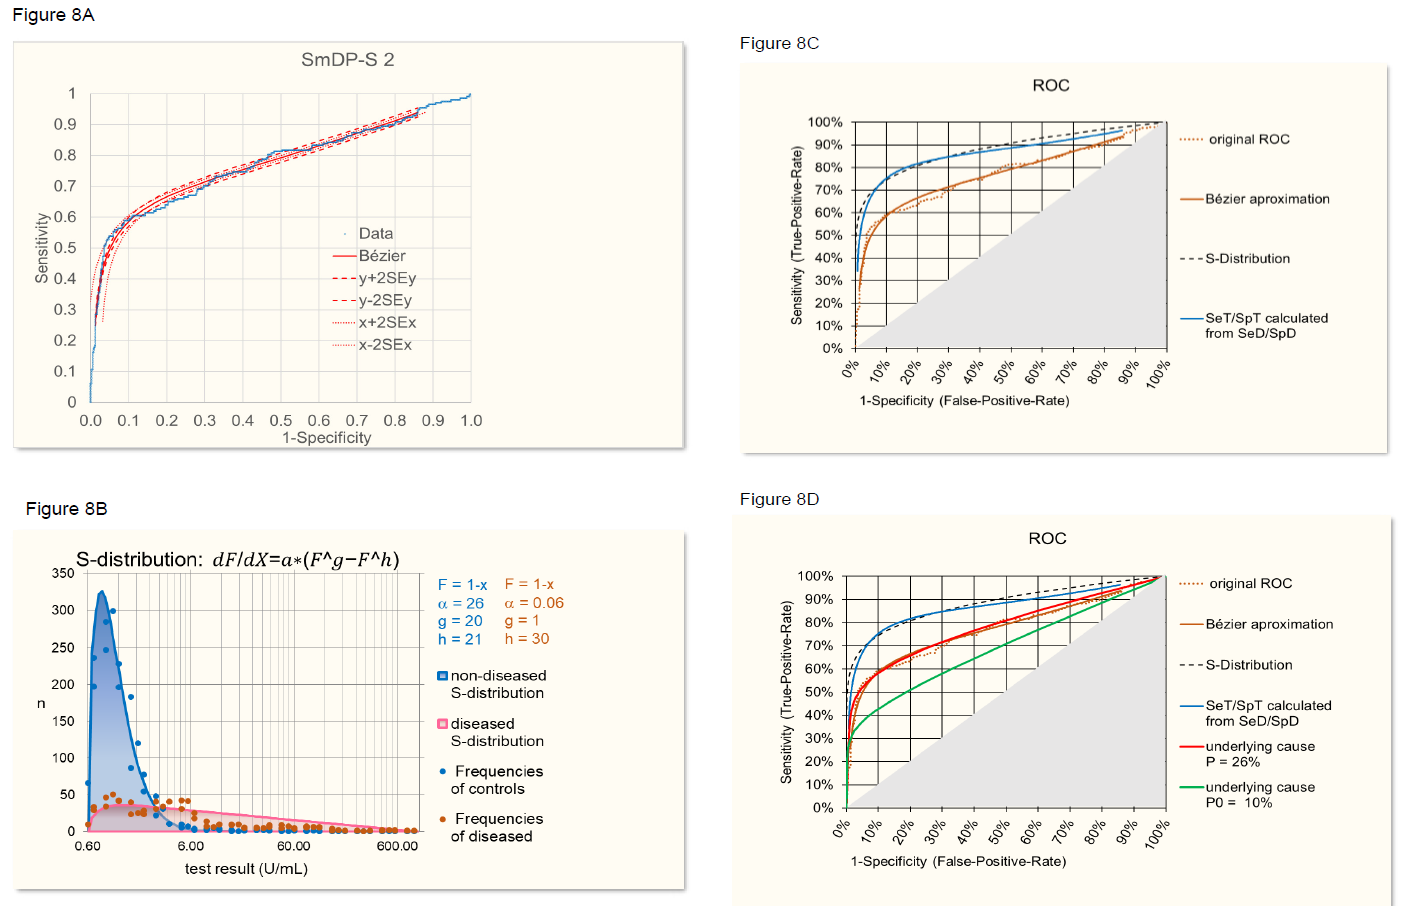
First, the ROC curve provided by the company was smoothed by using approximation with a Bézier curve (figure 8A [8] [9]). Second, the frequency distribution of control and diseased cases was adjusted by exclusion of SLE patients with SmDP-S values identical to controls, assuming that a different underlying cause is involved (figure 8B). From this frequency distributions a ROC curve was established (figure 8C) representing the relation between SeT and SpT when assuming that the characteristics of the distributions are independent on the prevalence. On the other hand, SeT and SpT were calculated from the original, Bézier approximated ROC curve using the formulas of the theoretical model described above. When assuming SeD = 100% and SpD = 80%, the two SeT/SpT-curves, i.e. the curve based on frequency distributions and the curve calculated according to the model, overlap quite well (figure 8C). Of course, the values of SeD and SpD, relating disease with underlying cause, are estimates because the underlying cause is not known in this case, but the optimized alignment of the SeT/SpT based on frequency distributions on one side and on the model on the other side, as described above, provides a means to estimate SeD and SpD.
Next, the ROC curve was backcalculated from SeT/SpT of the frequency distributions for a prevalence of the underlying cause of P = 22% (P = P(disease in the study): 27% times SpD (80%) over SeD (100%).). Figure 8D shows the agreement of the back-calculated ROC curves with the original ROC curve. Furthermore, when using SeT/SpT calculated by the model from the original Bézier curve and backcalculated using the model, the result was absolutely identical with the original Bézier curve demonstrating that the formulas of the model are correct. For illustrating purposes, a hypothetical prevalence of the underlying cause of P = 10% was assumed and the corresponding ROC curve calculated (figure 8D).
- Original ROC and Bézier approximation.
- S-distribution approximation of frequencies of anti- SmDP-S levels in SLE patients and controls.
- Overlap, the ROC curve based on frequency S-distributions and the curve calculated according to the model assuming SeD = 95% and SpD = 90% (blue).
- Agreement of the ROC curve backcalculated from SeT/SpT with P = 26% with the original ROC curve (red). A hypothetical ROC curve calculated for an assumed P = 10% is given for illustrative purpose (green).
2.2.3 Vitamin-B12 Deficiency
The model can also be used for relating two different biomarkers. Since in vitamin-B12 deficiency there is no clinical definition that can be used as a gold-standard for B12 deficiency, there are two different biomarkers in use to detect B12 deficiency, 1) the active form of B12, i.e. holotranscobolamin (holoTC) and 2) methylmalonic acid (MMA) the increase thereof being a metabolic consequence of B12 deficiency. The underlying cause for both biomarkers is B12 deficiency.
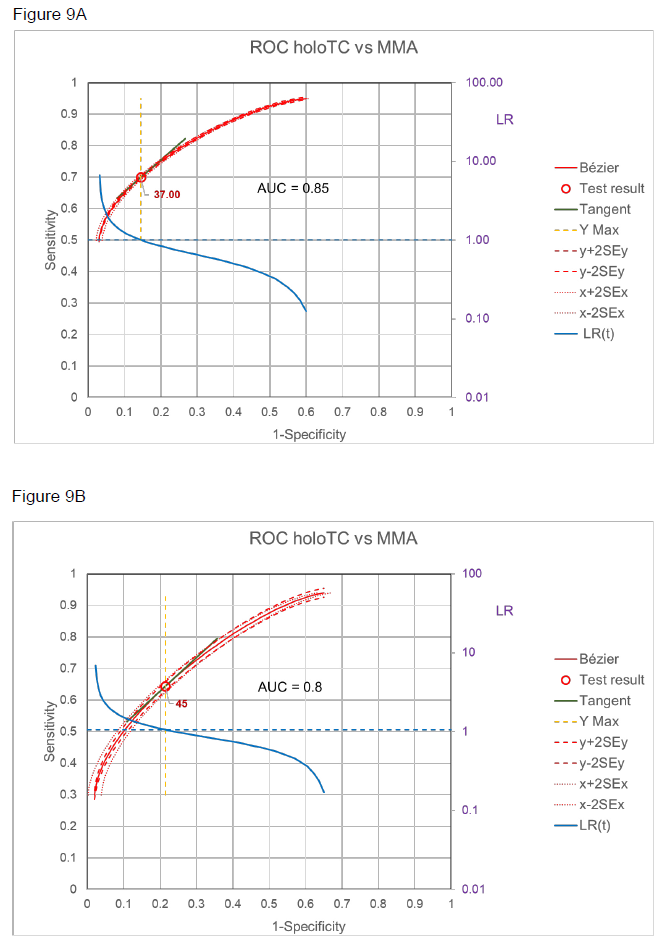
The relation of the two markers, holoTC and MMA in patients with normal renal function, is demonstrated by the ROC curves in figure 9 A and B with two different thresholds for MMA [12], i.e. with definite metabolic vitamin B12 deficiency (MMA > 0.75 mol/L, A) and probable metabolic vitamin B12 deficiency (MMA > 0.45 mol/L, B). Using Choi’s causal model [2] and assuming that with MMA > 0.75 mol/L SpD = 1, i.e. there is no other cause for such high MMA, then Se = SeT and Sp nearly equals SpT. in other words, the ROC given in figure 9A for definite metabolic vitamin B12 deficiency can be taken as the ROC of SeT/SpT.
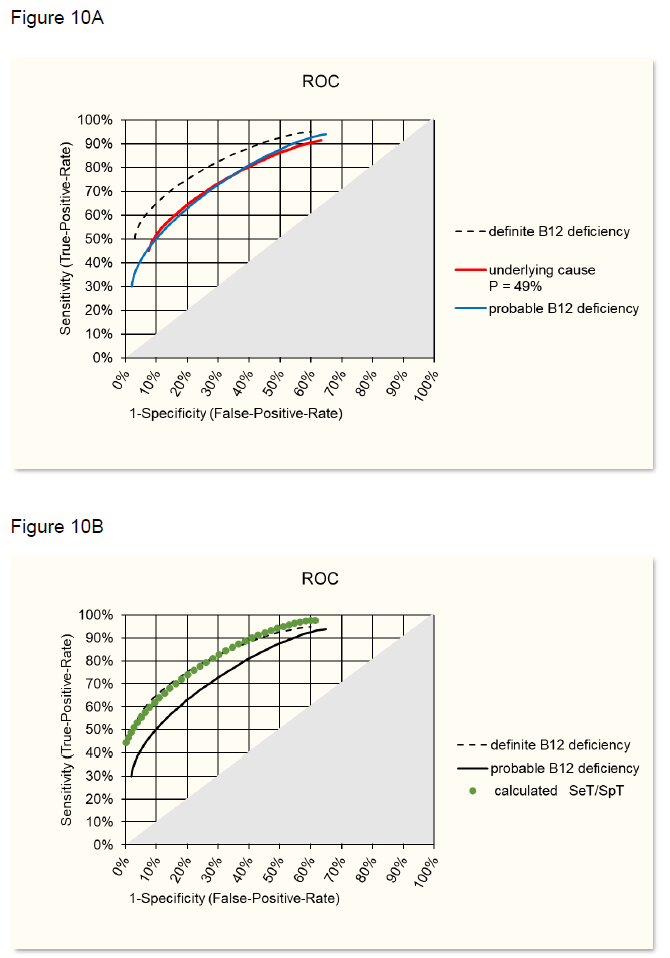
Starting from this situation, the ROC curve for probable metabolic vitamin B12 deficiency has been calculated with Pprobable = 49% of the study [12]. The best fit with the observed ROC (figure 9B) was reached when assuming SeD = 0.9 and SpD = 0.9 (figure 10A), i.e 10% of the cases would have different reasons for moderate increase of MMA and in 10% B12 deficiency would not be detected by MMA increase. Using SeD = 0.9 and SpD = 0.9 and using the formulas in the theoretical model one can calculate SeT and SpT and this ROC curve then overlaps with the ROC of definite B12 deficiency as shown in figure 10B.
B: Overlap of calculate SeT/SpT ROC with ROC of definite B12 deficiency (figure 9A).
3. Conclusion
Based on the theoretical model of Choi [2] and validated with data from three studies of clinical diseases, AMI, SLE and B12 deficiency, it is demonstrated that test characteristics like ROC, sensitivity, specificity and with it LR vary with prevalence of the disease-underlying cause. This holds as long as the sensitivity and/or specificity of disease in relation to the cause (SeD, SpD) is not 100%. Since in many cases the underlying cause that leads to disease and biomarker is not known, only different studies with different prevalence of the cause will detect the relation of prevalence and test characteristics. In cases where we lack such studies, an approximation of SeD and SpD is possible by aligning ROC curves for SeT/SpT based on frequency distributions of diseased and control cases with SeT/SpT-ROC curves calculated from sensitivities (Se) and specificities (Sp) of a particular study, as shown in validation case 2.
Knowing or estimating SeD and SpD of the disease relation to the underlying cause would allow in principle to calculate the LR of a test result in a situation with a certain prevalence from the LR of that test result in a situation with a different prevalence, since there is a linear relation between the odds of both LR (figure 3D). However, the relation between SeD/SpD and the parameter of this linear odds relation has not yet been established.
Acknowledgments
The provision of data is thankfully acknowledged to B. Walz for AMI laboratory data and M. Bergner for AMI clinical data, and to N. Olschowka (Fisher Scientific AG) for SLE EliA SmDP- S data.
References
- Brenner H, Gefeller O. Variation of sensitivity, specificity, likelihood ratios and predictive values with disease prevalence. Stat Med 16 (1997): 981-991.
- Choi BC. Causal modeling to estimate sensitivity and specificity of a test when prevalence changes. Epidemiology 8 (1997): 80-6.
- Leeflang MMG, Rutjes AWS, Reitsma JB, Hooft L, Bossuyt PMM. Variation of a test’s sensitivity and specificity with disease prevalence. Can Med Assoc J 185 (2013): E537 LP-E544.
- Bossuyt X, Damoiseaux J, Rasmussen N, Van Paassen P, Hellmich B, Baslund B, et al. Harmonization of antineutrophil cytoplasmic antibodies (ANCA) testing by reporting test result-specific likelihood ratios: Position paper. Clin Chem Lab Med 59 (2021): 35-39.
- Voit EO. The S-Distribution A Tool for Approximation and Classification of Univariate, Unimodal Probability Distributions. Biometrical J 34 (1992): 855-878.
- Sorribas A, March J, Trujillano J. A new parametric method based on S-distributions for computing receiver operating characteristic curves for continuous diagnosis tests. Stat Med 21 (2002): 1213-1235.
- Schoenenberger AW, Stallone F, Walz B, Bergner M, Twerenbold R, Reichlin T, et al. Incremental value of heart-type fatty acid-binding protein in suspected acute myocardial infarction early after symptom onset. Eur Hear journal Acute Cardiovasc care 5(2016): 185-192.
- Fierz W. Likelihood ratios of quantitative laboratory results in medical diagnosis: The application of Bézier curves in ROC analysis. PLoS One 13 (2018).
- Fierz W. A simplified method to approximate a ROC curve with a Bézier curve to calculate likelihood ratios of quantitative test results. MethodsX 7 (2020): 100915.
- Bossuyt X, De Langhe E, Borghi MO, Meroni PL. Understanding and interpreting antinuclear antibody tests in systemic rheumatic diseases. Nat Rev Rheumatol 16 (2020): 715-726.
- Mahler M, Stinton LM, Fritzler MJ. Improved serological differentiation between systemic lupus erythematosus and mixed connective tissue disease by use of an SmD3 peptide-based immunoassay. Clin Diagn Lab Immunol 12 (2005): 107-113.
- Clarke R, Sherliker P, Hin H, Nexo E, Hvas AM, Schneede J, et al. Detection of vitamin B12 deficiency in older people by measuring vitamin B12 or the active fraction of vitamin B12, holotranscobalamin. Clin Chem 53 (2007): 963-970.

