Corneal Endothelium and Central Corneal Thickness Changes in Patients with Primary Open Angle Glaucoma
Article Information
Amira Elagamy*, 1, Manal Tawashi2, Mohamed Berika3
1Assistant Professor of Ophthalmology, Department of Optometry and Vision Sciences, College of Applied Medical Sciences,King Saud University, Saudi Arabia and Mansoura Ophthalmic Center,Faculty of Medicine, Mansoura University, Egypt
2Optometrist in Prince Mohammed Bin Nasser Hospital in Jazan, Saudi Arabia
3Associate Professor, Rehabilitation Science Department, College of Applied Medical Sciences, King Saud University, Saudi Arabia and Anatomy Department, Faculty of Medicine, Mansoura University, Mansoura, Egypt
*Corresponding author: Amira Elagamy, Assistant Professor of Ophthalmology, Department of Optometry and Vision Sciences, College of Applied Medical Sciences,King Saud University, Saudi Arabia and Mansoura Ophthalmic Center,Faculty of Medicine, Mansoura University, Egypt
Received: 04 October 2022; Accepted: 12 October 2022; Published: 26 October 2022
Citation: Amira Elagamy, Manal Tawashi, Mohamed Berika. Corneal Endothelium and Central Corneal Thickness Changes in Patients with Primary Open Angle Glaucoma. Journal of Ophthalmology and Research 5 (2022): 141-146.
View / Download Pdf Share at FacebookAbstract
Purpose: The purpose of this study was to compare corneal endothelial morphometric changes and central corneal thickness (CCT) in patients with primary open-angle glaucoma (POAG) with age-matched, non-glaucomatous control subjects using CEM-530 NIDEK indirect specular microscope. In addition, the associations between endothelial changes and IOP; glaucoma duration and topical anti-glaucoma medications were performed.
Methods: The study included 44 patients (44 eyes) with POAG and 50 control (non-glaucomatous) subjects (50 eyes). Corneal endothelial changes and CCT were measured for all patients using CEM-530 NIDEK indirect specular microscope.
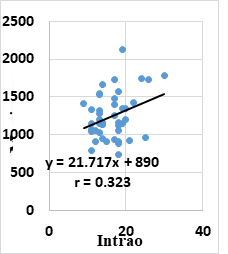
Results: This study demonstrated a high statistically significant difference in endothelial cell density (ECD), average cell area, maximum cell area and standard deviation of cell area between the 2 groups (P=0.000). However, the study showed no statistically significant differences in coefficient of variation (CV), hexagonality and CCT between the 2 groups. Pearson correlation analysis showed that POAG group had a statistically weak positive correlation between IOP and maximum cell area (r=0.323 & P=0.033) and hexagonality (r=0.313 & P=0.038). Moreover, POAG group had a statistically weak negative correlation between age and CCT (r= -0.303 & P=0.046).
Conclusion: This study documented lower ECD and larger average endothelial cell area in POAG patients. Therefore, it is mandatory to use all precautions to protect the corneal endothelial cells from further impairment during any anterior segment operations. In addition, the study confirmed a positive correlation between IOP and maximum cell area in glaucomatous eyes. On the other hand, endothelial parameters and CCT showed no significant correlations with the number of medications and duration of glaucoma. Therefore, further studies using a longitudinal large populatio
Keywords
primary open-angle glaucoma, endothelial cell density, central corneal thickness, non-contact specular microscopy
primary open-angle glaucoma articles, endothelial cell density articles, central corneal thickness articles, non-contact specular microscopy articles
Article Details
1. Intruduction
Glaucoma is a group of ocular disorders manifested by a specific pattern of optic nerve neuropathy, and visual field defects that are related significantly but not in all cases with an elevated intraocular pressure (IOP) [1, 2]. Helayel et al 2021 [3] evaluated the profile of glaucoma in the Eastern Region of Saudi Arabia. They demonstrated that Primary open-angle glaucoma (POAG) was the most prevalent type of glaucoma (27.7%), followed by secondary glaucomas (26.7%), primary angle-closure glaucoma (PACG) (18.2%). Corneal thickness and endothelial cell density are indirect measures of endothelial function, which are rapidly attained, reproducible, and reflective of compromised endothelial function [4]. Many studies [5-9] investigated the impact of different types of glaucoma on corneal endothelium and central corneal thickness, but their results are controversial. The purpose of this study was to compare corneal endothelial morphometric changes and central corneal thickness in patients with POAG with age-matched, non-glaucomatous control subjects using CEM-530 NIDEK indirect specular microscope. In addition, the associations between endothelial changes and IOP; glaucoma duration and topical anti-glaucoma medications were performed.
2. Methods
2.1 Study Design
This study was a prospective, hospital-based, non-randomized, case-control, observational, and quantitative study. It got the Institutional Review Board (IRB) approval of Health Sciences Colleges Research on Human Subjects, College of Medicine, King Saud University. It adhered to tenets of the Declaration of Helsinki regarding research on human tissues. All the participants signed comprehensive consent after explanation of the study procedures.
2.2 Subjects
The study included 44 patients [44 eyes] {25 males (56.8%); 19 females (43.2%)} with POAG and 50 control (non-glaucomatous) subjects [50 eyes] {26 males (52%), 24 females (48%)}. The age range of POAG group was 40-64 years (mean: 51.43±7.02 years), and the age range of the control group was 40-70 years (mean: 48.6±7.64 years). All patients were recruited from ophthalmology department at the Prince Mohammed bin Nasser Hospital in Jazan, Saudi Arabia, by non-randomized convenience sampling method from January and March 2020.
The diagnosis of POAG was based on an elevated IOP > 21 mmHg (≥1 time), retinal nerve fiber layer defect on red-free photo, visual field loss compatible with glaucoma with or without glaucomatous optic disc changes in the presence of open, normal-appearing anterior chamber angle. Control eyes have IOP ≤21 mmHg without anti-glaucoma treatment and normal looking optic disk without any signs of glaucomatous or ischemic optic neuropathy. The exclusion criteria were patients with angle-closure glaucoma, a history of corneal diseases such as corneal endothelial dystrophy, intraocular diseases, contact lens use, ocular trauma or surgery (including intraocular surgery and laser treatment). In addition, patients with systemic diseases such as diabetes that could affect the corneal endothelium were excluded.
2.3 Methods
All patients underwent a comprehensive ophthalmological examination including visual acuity assessment using the Snellen chart visual acuity, IOP measurement using Goldmann applanation tonometry, slit lamp biomicroscopy and fundus examination. Ophthalmological records of POAG patients were reviewed including duration of glaucoma, and anti-glaucoma medications (number and types).
Central corneal thickness (CCT) and corneal endothelial morphometric data such as endothelial cell density (ECD), coefficient of variation (CV), percentage of hexagonal cells (HEX), maximum cell area, minimum cell area, standard deviation of cell area (SD) were calculated for all patients using CEM-530 NIDEK indirect specular microscope (class 1 led product, 2013). The measurements were acquired in the semi-automatic mode of the instrument. Three images from the central cornea were taken, and the best image was saved for analysis. The parameters from the right eye only were used for statistical analysis to prevent pseudo-replication from using data from both eyes.
2.4 Statistical Analysis
All data was analyzed using Statistical Package for the Social Sciences (SPSS) version 23.0 software (SPSS Inc., Chicago, IL, USA). Descriptive statistics (means and standard deviations) were used for expressing quantitative variables. Frequencies and percentages were used for expressing qualitative variables. Independent t-test was done to compare between the two groups for the variables in the study. Pearson correlation coefficient was used for studying the correlation between variables. Graphs for mean and standard error for variables of each group were done using SPSS graphs. P < 0.05 and P<0.01 were considered statistically significant (*) & highly significant (**) respectively.
3. Results / Case report
The study included 44 eyes with POAG and 50 non-glaucomatous eyes (control group). These 2 groups were matched regarding age and sex. This study showed no statistically significant difference in IOP between the two groups (P=0.070). POAG group showed mean of IOP 16.36± 4.51 (10.00-30.00 mmHg) compared to 14.36±3.39 (10.00-20.00 mmHg) in the control group. POAG group had mean of glaucoma duration 3.99±4.44 (1-17years). Moreover, in POAG group, there were 16 patients (36.36%) on 1 medication (latanoprost), 15 patients (34.09%) on 2 medications (latanoprost and timolol), 12 patients (27.27%) on 3 medications (latanoprost, timolol and brimonidine) and one patient (2.27%) on 4 medications (latanoprost, timolol, brimonidine and dorzolamide) to control IOP. Participant demographic and clinical data are shown in table 1.
|
Demographic Data |
Control group |
POAG group |
|
(n = 50) |
(n = 44) |
|
|
Age (years) |
48.6±7.64 |
51.43±7.02 |
|
Mean ± SD |
(40 -70) |
(40-64) |
|
Gender |
||
|
Male |
26 (52%) |
25 (56.8%) |
|
Female |
24 (48%) |
19 (43.2%) |
|
IOP mmHg |
14.86±3.39 |
16.36±4.51 |
|
Mean ± SD |
(10.00-20.00) |
(10.00-30.00) |
|
Duration (y) |
-- |
(1-17) |
|
3.99±4.44 |
||
|
Number of Medications |
--- |
(1-4) |
|
16 (36.36%) ------>1 |
||
|
15 (34.09%)------>2 |
||
|
12 (27.27%) ------>3 |
||
|
1 (2.27%) -------->4 |
Table 1: Demographic and clinical data of the participants
Independent t-test was performed to compare the variables in the study between the two groups. P < 0.05 and P < 0.01 were considered statistically significant (*) & highly significant (**) respectively.
|
Data |
Control group |
POAG group |
P-Value |
|
(n=50) |
(n=44) |
||
|
Endothelial Cell Density (ECD)(cell/mm2) |
|||
|
Mean ± SD |
2604.44±247.26 |
2209.45±475.34 |
0.000** |
|
Coefficient of Variation (CV) (%) |
|||
|
Mean ± SD |
29.06±4.437 |
30.27±4.857 |
0.209 |
|
Hexagonality (%) |
|||
|
Mean ± SD |
67.86±5.406 |
68.02±6.086 |
0.891 |
|
Average cell area (μm2) |
|||
|
Mean ± SD |
387.94±44.206 |
458.79±99.284 |
0.000** |
|
Standard deviation of cell area (μm2) |
|||
|
Mean ± SD |
106.06±24.658 |
132.34±42.819 |
0.000** |
|
Maximum cell area (μm2) |
|||
|
Mean ± SD |
1034.9±285.49 |
1245.36±304.02 |
0.001** |
|
Minimum cell area (μm2) |
|||
|
Mean ± SD |
141.06±19.62 |
148.54±21.06 |
0.078 |
|
Central corneal Thickness (CCT) (µm) |
|||
|
Mean ± SD |
540.36±34.74 |
544.15±37.02 |
0.609 |
Table 2: Endothelial morphometric changes and CCT between glaucomatous and control eyes (mean ± SD).
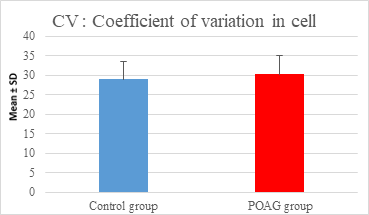
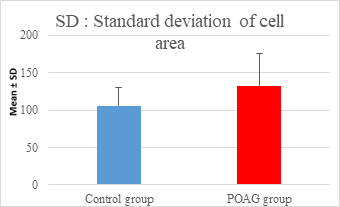
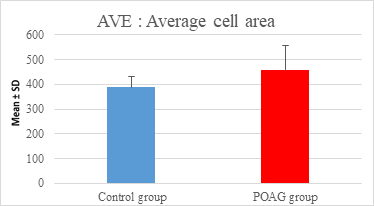
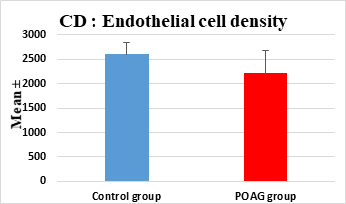
This study demonstrated a high statistically significant difference in ECD, average cell area, maximum cell area and standard deviation of cell area between the 2 groups (P=0.000). ECD was significantly lower in POAG group (2209.45±475.34 cell/mm2) than (2604.44±247.26 cell/mm2) in the control group (P=0.000). Average cell area was significantly larger in POAG group (458.79±99.284 μm2) than in the control group (387.94±44.206 μm2) (P=0.000). Standard deviation of cell area was significantly greater in POAG group (132.34±42.819 μm2) than in the control group (132.34±42.819 μm2) (P=0.000). Maximum cell area was significantly larger in POAG group (1245.36±304.02 μm2) than in the control group (1034.9±285.49 μm2) (P=0.001). However, the study showed no statistically significant differences in CV, hexagonality and CCT between the 2 groups. Endothelial morphometric changes and CCT between glaucomatous and control eyes are shown in table 2 (figures 1- 4).
Pearson correlation analysis showed that POAG group had a statistically weak positive correlation between mean IOP and maximum cell area (r=0.323 & P=0.033) (figure 5) and hexagonality (r=0.313 & P=0.038). Moreover, POAG group had a statistically weak negative correlation between age and CCT (r=- 0.303 & P=0.046). On the other hand, Pearson correlation analysis showed that endothelial parameters and CCT had no significant correlations with the number of medications and duration of glaucoma in POAG group.
4. Discussion
The corneal endothelium is critical in preserving a healthy transparent cornea. The proper function of corneal endothelium necessitates a definite cell density and morphology which are more sensitive indicators of functional alterations of the corneal endothelium [10]. Corneal endothelial cells have a restricted regenerative capability, so the maintenance of these cells is of great importance. Glaucoma has a worldwide prevalence of 3.5% of the population aged 40-80 years. The harmful influence of glaucoma on the corneal endothelium may be initiated by the direct damage from the persistently high IOP, the glaucoma medication toxicity, and the hypoxic injury to endothelial cells due to an impaired aqueous drainage or a combination of these [8, 11, 12]. Yüksel et al [13] explained the effect of glaucoma on the corneal endothelium by the stagnation of aqueous circulation with a subsequent decrease in convenience of vital metabolites to the endothelial cells that causes a low endothelial density and architecture, rather than the mere elevated IOP. Understanding and investigating the extent of this impact on the corneal endothelium is mandatory for preserving the corneal clarity and visual acuity in all glaucoma patients. This study evaluated corneal endothelial changes and CCT in patients with POAG compared to control patients. The study found no statistically significant difference in IOP between the two groups (P=0.070) because all POAG patients enrolled in the study were on glaucoma medications. POAG group showed mean of IOP 16.36± 4.51 (10.00-30.00 mmHg) compared to 14.36±3.39 (10.00-20.00 mmHg) in the control group.
In this study, POAG group showed a significantly lower ECD and a larger average cell area compared to the control group. This finding matched with Zarnowski et al [6] Cho et al [7] and Yu et al [10] Cho et al [7] investigated POAG patients who did not receive antiglaucoma medication. Yu et al [10] demonstrated that POAG eyes had significantly lower ECD compared to the healthy control eyes (P < 0.001) and the treated eyes had significantly lower ECD compared to the untreated eyes. Also, Bhomaj et al8 documented a significant reduction in endothelial cell count in POAG patients compared to normal eyes (185 cells/mm2) (95% CI = 132-238 cells lower, P < 0.001). In their study, timolol monotherapy was the most common anti-glaucoma treatment being used by POAG patients (n = 30 %), followed by latanoprost (n = 14%) and combination of latanoprost and timolol (n = 14 %). A few patients were using brimonidine either alone (n = 12%) or in combination with timolol (n = 8%). Minority patients were using a combination of dorzolamide with timolol (n = 9%). In addition, Swamy and Tasneem 2020 [14] found a significant difference in ECD between the newly detected POAG patients and controls (P<0.001). Additionally, Knorr et al5 showed a 31% decrease in corneal ECD in POAG patients compared with the healthy subjects. Similarly, Cho et al [7] and Gagnon et al [11] confirmed a 13.0% reduction in ECD in POAG patients compared to control eyes. Gagnon et al [11] examined glaucoma patients who had used glaucoma medication. Tham et al 2006 [15] explained the significant increase of average cell area in glaucomatous eyes by the renewing incapacity of corneal endothelium. The corneal endothelial cells have to expand to maintain corneal clarity. However, Lee et al [9] and Korey et al [16] demonstrated no reduction in ECD in POAG eyes. Korey et al [16] assumed that the corneal endothelium has the capability to adapt to a gradual and modest increase in IOP, even if it continues for a prolonged period, without displaying significant changes. Conversely, Inatani et al [17] suggested that a slight increase in IOP over an extended period can lead to glaucoma progression, and it may also induce a reduction in ECD. On the other hand, the length of the duration which is required by the minor elevation of IOP to cause a significant decrease in ECD is still unknown. Consequently, longitudinal studies may be necessary to approve this hypothesis.
This study demonstrated no significant differences between the 2 groups regarding CV and hexagonality. This result agreed with Cho et al [7]. However, Bhomaj et al [8] confirmed significantly higher CV values. They reported significant pleomorphism and polymegathism in eyes with POAG (P < 0.001). Swamy and Tasneem 2020 [14] found a significant difference between hexagonality and CV between the newly detected POAG patients and controls (P=0.001, P=0.002 respectively). However, many studies [18-20] confirmed that the alterations in CV and Hexagonality are only induced by an acute corneal endothelial damage. The current study documented no significant differences between the 2 groups regarding CCT which matched with Lee et al.9 Also, Wu et al [21] documented no significant difference in CCT among NTG, POAG, and normal subjects but a higher CCT in OHT subjects. Conversely, Swamy and Tasneem 2020 [14] found a significant difference in CCT between the newly detected POAG patients and controls (P=0.027).
This study investigated the association between corneal endothelial changes and IOP, glaucoma duration and medications. The study reported a positive correlation between mean IOP and maximum cell area in POAG group (r=0.323 & P=0.033) which agreed with Yu et al10 who showed a positive correlation between maximum cell area and mean IOP (r = 0.218, P = 0.029). Moreover, they found a positive correlation between the average cell area and mean IOP (r = 0.228, P = 0.022) and minimum cell area and mean IOP (r = 0.290, P = 0.003). However, they documented a negative correlation between cell density and mean IOP (r = −0.286, P = 0.004). On the other hand, they did not report any association between the mean IOP and the percentage of hexagonal cells.
Swamy and Tasneem 2020 [14] investigated the association between ECD and mean IOP in the newly detected POAG patients and controls and found that the patients with 10-15mm Hg have ECD of 2500-3000 cells/mm2 compared to ECD of 2000-2500 cells/ mm2 (39%) with an increasing IOP beyond of 20-25mm Hg. Pearson correlation analysis in this study showed that endothelial parameters and CCT had no significant correlations with the number of medications and duration of glaucoma in POAG group. On the other hand, POAG group had a statistically weak negative correlation between age and CCT. This result agreed with Galgauskas et al [22] who reported a statistically significant negative correlation was found between CCT and age (r=-0.263, P<0.05). However, Natarajan et al23 found no statistical difference in CCT among various ages.
This study had some limitations. First, the study did not include a group of newly diagnosed POAG patients to exclude the effect of glaucoma medication on the corneal endothelium. Second, pre medication records of the endothelial morphometric parameters of POAG group were not available to evaluate accurately the extent of damage after the medication. The unavailability of these records made us unable to determine whether the reason for decreased ECD was the amount of elevated IOP or other factors such as congenital problems. Third, evaluation of the correlation between the endothelial morphometric parameters and Cup-Disc Ratio was not performed in this study. Fourth limitation is the lack of longitudinal data to show rate of progressive loss of ECD.
Conclusion
This study documented lower ECD and larger average endothelial cell area in POAG patients. Therefore, it is mandatory to use all precautions to protect the corneal endothelial cells from further impairment during any anterior segment operations. In addition, the study confirmed a positive correlation between IOP and maximum cell area in glaucomatous eyes. On the other hand, endothelial parameters and CCT showed no significant correlations with the number of medications and duration of glaucoma. Therefore, further studies using a longitudinal large population-based prospective design are recommended to verify the extent of endothelial damage caused by POAG and to determine factors prognostic of enhanced endothelial damage.
References
- Shetgar AC. Central Corneal Thickness In Normal Tension Glaucoma, Primary Open Angle Glaucoma And Ocular Hypertension. Bangalore Medical College 2006: 1-7
- Reznicek L, Muth D, Kampik A, Neubauer AS, Hirneiss C. Evaluation of a novel Scheimpflug-based non-contact tonometer in healthy subjects and patients with ocular hypertension and glaucoma. Br. J. Ophthalmol 97 (2013): 1410-1414.
- Helayel HB, AlOqab A, Subaie MA, Habash AA. Profile of Glaucoma in the Eastern Region of Saudi Arabia. A Retrospective Study. Saudi J Med Med Sci 9 (2021): 167-174.
- Lass JH, Khosrof SA, Laurence JK, Horwitz B, Ghosh K, and Adamsons I. “A double-masked, randomized, 1-year study comparing the corneal effects of dorzolamide, timolol, and betaxolol. Dorzolamide Corneal Effects Study Group.” Arch. of Ophthalmol 116 (1998): 1003-1010.
- Knorr HL, Handel A, Naumann GO. “Morphometric ¨ and qualitative changes in corneal endothelium in primary chronic open angle glaucoma.” Fortschritte der Ophthalmologie 88 (1991): 118-120.
- Zarnowski T, Lekawa A, Dyduch A, Turek R, Zagorski Z. “Corneal endothelial density in glaucoma patients.” Klinika Oczna 107 (2005): 448-451.
- Cho SW, Kim JM, Choi CY, and Park KH. “Changes in corneal endothelial cell density in patients with normal-tension glaucoma.” Jpn. J. Ophthalmol 53 (2009): 569-573.
- Bhomaj P, Umarani S, Kudache J. Study of corneal endothelial morphology in primary open angle glaucoma and pseudo-exfoliative glaucoma patients compared with age related normal. J. of Clin. Ophthalmol 8 (2020): 95-99.
- Lee JWY, Wong R LM, Chan, JCH, Wong, IYH, Lai JSM. Differences in corneal parameters between normal tension glaucoma and primary open-angle glaucoma. Int. Ophthalmol 35 (2015): 67-72.
- Yu ZY, Wu L, Qu B. Changes in corneal endothelial cell density in patients with primary open-angle glaucoma. World J. Clin 7 (2019): 1978-1985.
- Gagnon MM, Boisjoly HM, Brunette I, Charest, M. & Amyot, M. Corneal endothelial cell density in glaucoma. Cornea 16 (1997): 314-318.
- Janson BJ, Alward WL, Kwon YH, et al. Glaucoma-associated corneal endothelial cell damage: A review. Surv. Ophthalmol 63 (2018): 500-506.
- Yüksel N, Emre E, Pirhan D. Evaluation of corneal microstructure in pseudoexfoliation syndrome and glaucoma: In vivo scanning laser confocal microscopic study 41 (2016): 34-40.
- Swamy NN, Tasneem AF. Evaluation of corneal morphology among newly detected patients with primary open angle glaucoma. J. Clin. Res. Ophthalmol 7 (2020): 008-014.
- Tham C C Y, Kwong Y YY, Lai JSM, Lam DSC. Effect of a previous acute angle closure attack on the corneal endothelial cell density in chronic angle closure glaucoma patients. J Glaucoma 15 (2006): 482-485.
- Korey M, Gieser D, Kass MA, Waltman SR, Gordon M, et al Central corneal endothelial cell density and central corneal thickness in ocular hypertension and primary open-angle glaucoma. Am. J. Ophthalmol 94 (1982): 610-616.
- Inatani M, Iwao K, Inoue T, et al. Long-term relationship between intraocular pressure and visual field loss in primary open-angle glaucoma. J. Glaucoma 17 (2008): 275-279.
- Matsuda M, Suda T, Manabe R. Serial alterations in endothelial cell shape and pattern after intraocular surgery. Am. J. Ophthalmol 98 (1984): 313-319.
- Kim JH, Kim CS. The change in corneal endothelial cells after glaucoma valve implantation. J. Korean Ophthalmol. Soc 47 (2006): 1972-1980.
- Phillips C, Laing R, Yee R. Specular Microscopy. In: Krachmer JH, Mannis MJ, Holland EJ (eds). Cornea, 2nd ed. Philadelphia, Elsevier Mosby 261-277.
- Wu LL, Suzuki Y, Ideta R, Araie M. Central corneal thickness of normal tension glaucoma patients in Japan. Jpn. J. Ophthalmol 44 (2000): 643-647.
- Galgauskas S, Juodkaite G, Tutkuvien? J. Age-related changes in central corneal thickness in normal eyes among the adult Lithuanian population. Clin Interv Aging 9 (2014): 1145-1151.
- Natarajan M, Das K, Jeganathan J. Comparison of central corneal thickness of primary open angle glaucoma patients with normal controls in South India. Oman J. Ophthalmol 6 (2013): 33-36.

