Comparison of Computed Tomographic Hounsfield Numbers with Ultrasonographic Categorization of the Fatty Liver Disease
Article Information
Muhammad Yousaf1*, Dr. Sarah Maryam2*, Dr. Muhammad Fiaz3, Dr. Asif Hanif4, Mehreen Fatima5, Dr. Raham Bacha6, Syed Muhammad Yousaf Farooq7, Syeda Rabi Madina8, Professor Dr. Syed Amir Gilani9
1B.Sc. (Hons) MIT, ARDMS, MS MIT Student and Senior Lecturer Department (UIRSMIT) FAHS, University of Lahore, Pakistan
2MBBS, DMRD Assistant professor UIRSMIT FAHS, University of Lahore, Pakistan
3MBBS, FCPS, MCPS, FRCR II, Professor of Radiology, Alrazi Healthcare Lahore, Pakistan
4Associate Professor, Department UIPH FAHS, University of Lahore, Pakistan
5Assistant Professor, Department (UIRSMIT) FAHS, University of Lahore, Pakistan
6MD, MS Ultrasound, Assistant Professor, Department (UIRSMIT) FAHS, University of Lahore, Pakistan
7B.Sc. Ultrasound, M.Sc. Ultrasound Lecturer, Department (UIRSMIT) FAHS, University of Lahore, Pakistan
8B.Sc. Ultrasound, M.Sc. Ultrasound Lecturer, Department (UIRSMIT) FAHS, University of Lahore, Pakistan
9MBBS, DMRD, PhD Radiology, PhD Ultrasound, Dean Faculty of Allied Health Sciences, The University of Lahore, Pakistan
*Corresponding Author: Muhammad Yousaf, ARDMS, MS MIT Student and Senior Lecturer Department (UIRSMIT) FAHS, University of Lahore, Pakistan
Received: 03 December 2019; Accepted: 16 December 2019; Published: 27 December 2019
Citation: Muhammad Yousaf, Sarah Maryam, Muhammad Fiaz, Raham Bacha, Syed Muhammad Yousaf Farooq, Syeda Rabi Madina, Syed Amir Gilani. Comparison of Computed Tomographic Hounsfield Numbers with Ultrasonographic Categorization of the Fatty Liver Disease. Journal of Radiology and Clinical Imaging 2 (2019): 059-070.
View / Download Pdf Share at FacebookAbstract
Objective: To compare CT Hounsfield Numbers with Ultrasonographic categorization of the FLD.
Material and Methods: It was a Cross sectional analytical study. By Purposive sampling 227 Patients of FLD were sampled from Radiology Department AL Razi Healthcare MM Alam Road Lahore and Radiology Department Shalamar Hospital Shalamar Road Lahore. The data was collected for 9 months. Patients of both gender of age between 20-80 years, who underwent both CT and USG scans of abdomen and with Ultrasonographic diagnosis of diffuse FLD was included. The USG categories of FLD were compared with mean Liver CTHFN. Statistical analysis was done by ANOVA; p value of CTHFN was found significant for each Ultrasonographic category of FLD.
Results: In this study 227 patients of FLD was taken. The mean age of population was 49.88 ± 14.52 years. The frequency of male population was 141(62.11%) and female was 86 (37.89%). The mild, moderate and severe FLD was found in 159 (70.04%), 50(22.03%) and 18(7.93%) patients respectively. The mean values of Liver CTHFN in mild, moderate and sever FLD categories by USG were 42.08 ± 5.07 HU, 24.41 ± 4.19 HU and 3.09 ± 6.64 HU respectively. These values along with P values and 95% Confidence Interval (CI). In multiple comparison the Least Significant Difference (LSD) of USG categories of FLD with mean Liver CTHFN, p value was significant when mild FLD was compared with moderate and severe FLD, Moderate FLD was compared with mild and severe FLD and severe FLD was compared with mild and moderate FLD.
Conclusion: In best of our knowledge to date this is third study comparing USG grades of FLD with CTHFN to determine CTHFN for each Ultrasonographic category of FLD. We found significant p values of CTHFN for all grades of FL
Keywords
Fatty Liver Disease (FLD); Computed Tomography Hounsfield Numbers (CTHFN)
Fatty Liver Disease (FLD) articles, Computed Tomography Hounsfield Numbers (CTHFN) articles
Fatty Liver Disease articles Fatty Liver Disease Research articles Fatty Liver Disease review articles Fatty Liver Disease PubMed articles Fatty Liver Disease PubMed Central articles Fatty Liver Disease 2023 articles Fatty Liver Disease 2024 articles Fatty Liver Disease Scopus articles Fatty Liver Disease impact factor journals Fatty Liver Disease Scopus journals Fatty Liver Disease PubMed journals Fatty Liver Disease medical journals Fatty Liver Disease free journals Fatty Liver Disease best journals Fatty Liver Disease top journals Fatty Liver Disease free medical journals Fatty Liver Disease famous journals Fatty Liver Disease Google Scholar indexed journals Computed Tomography Hounsfield Numbers articles Computed Tomography Hounsfield Numbers Research articles Computed Tomography Hounsfield Numbers review articles Computed Tomography Hounsfield Numbers PubMed articles Computed Tomography Hounsfield Numbers PubMed Central articles Computed Tomography Hounsfield Numbers 2023 articles Computed Tomography Hounsfield Numbers 2024 articles Computed Tomography Hounsfield Numbers Scopus articles Computed Tomography Hounsfield Numbers impact factor journals Computed Tomography Hounsfield Numbers Scopus journals Computed Tomography Hounsfield Numbers PubMed journals Computed Tomography Hounsfield Numbers medical journals Computed Tomography Hounsfield Numbers free journals Computed Tomography Hounsfield Numbers best journals Computed Tomography Hounsfield Numbers top journals Computed Tomography Hounsfield Numbers free medical journals Computed Tomography Hounsfield Numbers famous journals Computed Tomography Hounsfield Numbers Google Scholar indexed journals Alcoholic Fatty Liver Disease articles Alcoholic Fatty Liver Disease Research articles Alcoholic Fatty Liver Disease review articles Alcoholic Fatty Liver Disease PubMed articles Alcoholic Fatty Liver Disease PubMed Central articles Alcoholic Fatty Liver Disease 2023 articles Alcoholic Fatty Liver Disease 2024 articles Alcoholic Fatty Liver Disease Scopus articles Alcoholic Fatty Liver Disease impact factor journals Alcoholic Fatty Liver Disease Scopus journals Alcoholic Fatty Liver Disease PubMed journals Alcoholic Fatty Liver Disease medical journals Alcoholic Fatty Liver Disease free journals Alcoholic Fatty Liver Disease best journals Alcoholic Fatty Liver Disease top journals Alcoholic Fatty Liver Disease free medical journals Alcoholic Fatty Liver Disease famous journals Alcoholic Fatty Liver Disease Google Scholar indexed journals Non-Alcoholic Fatty Liver Disease articles Non-Alcoholic Fatty Liver Disease Research articles Non-Alcoholic Fatty Liver Disease review articles Non-Alcoholic Fatty Liver Disease PubMed articles Non-Alcoholic Fatty Liver Disease PubMed Central articles Non-Alcoholic Fatty Liver Disease 2023 articles Non-Alcoholic Fatty Liver Disease 2024 articles Non-Alcoholic Fatty Liver Disease Scopus articles Non-Alcoholic Fatty Liver Disease impact factor journals Non-Alcoholic Fatty Liver Disease Scopus journals Non-Alcoholic Fatty Liver Disease PubMed journals Non-Alcoholic Fatty Liver Disease medical journals Non-Alcoholic Fatty Liver Disease free journals Non-Alcoholic Fatty Liver Disease best journals Non-Alcoholic Fatty Liver Disease top journals Non-Alcoholic Fatty Liver Disease free medical journals Non-Alcoholic Fatty Liver Disease famous journals Non-Alcoholic Fatty Liver Disease Google Scholar indexed journals Computed Tomographic Hounsfield numbers articles Computed Tomographic Hounsfield numbers Research articles Computed Tomographic Hounsfield numbers review articles Computed Tomographic Hounsfield numbers PubMed articles Computed Tomographic Hounsfield numbers PubMed Central articles Computed Tomographic Hounsfield numbers 2023 articles Computed Tomographic Hounsfield numbers 2024 articles Computed Tomographic Hounsfield numbers Scopus articles Computed Tomographic Hounsfield numbers impact factor journals Computed Tomographic Hounsfield numbers Scopus journals Computed Tomographic Hounsfield numbers PubMed journals Computed Tomographic Hounsfield numbers medical journals Computed Tomographic Hounsfield numbers free journals Computed Tomographic Hounsfield numbers best journals Computed Tomographic Hounsfield numbers top journals Computed Tomographic Hounsfield numbers free medical journals Computed Tomographic Hounsfield numbers famous journals Computed Tomographic Hounsfield numbers Google Scholar indexed journals Liver attenuation articles Liver attenuation Research articles Liver attenuation review articles Liver attenuation PubMed articles Liver attenuation PubMed Central articles Liver attenuation 2023 articles Liver attenuation 2024 articles Liver attenuation Scopus articles Liver attenuation impact factor journals Liver attenuation Scopus journals Liver attenuation PubMed journals Liver attenuation medical journals Liver attenuation free journals Liver attenuation best journals Liver attenuation top journals Liver attenuation free medical journals Liver attenuation famous journals Liver attenuation Google Scholar indexed journals MR elastography articles MR elastography Research articles MR elastography review articles MR elastography PubMed articles MR elastography PubMed Central articles MR elastography 2023 articles MR elastography 2024 articles MR elastography Scopus articles MR elastography impact factor journals MR elastography Scopus journals MR elastography PubMed journals MR elastography medical journals MR elastography free journals MR elastography best journals MR elastography top journals MR elastography free medical journals MR elastography famous journals MR elastography Google Scholar indexed journals MRI articles MRI Research articles MRI review articles MRI PubMed articles MRI PubMed Central articles MRI 2023 articles MRI 2024 articles MRI Scopus articles MRI impact factor journals MRI Scopus journals MRI PubMed journals MRI medical journals MRI free journals MRI best journals MRI top journals MRI free medical journals MRI famous journals MRI Google Scholar indexed journals Computer Tomography articles Computer Tomography Research articles Computer Tomography review articles Computer Tomography PubMed articles Computer Tomography PubMed Central articles Computer Tomography 2023 articles Computer Tomography 2024 articles Computer Tomography Scopus articles Computer Tomography impact factor journals Computer Tomography Scopus journals Computer Tomography PubMed journals Computer Tomography medical journals Computer Tomography free journals Computer Tomography best journals Computer Tomography top journals Computer Tomography free medical journals Computer Tomography famous journals Computer Tomography Google Scholar indexed journals
Article Details
1. Introduction
Fatty Liver Disease (FLD) also known as Hepatic Steatosis (HS) is identified by the abnormal build-up of lipids particularly triglyceride in the cytoplasm of hepatocytes [1]. In Asia, the prevalence of FLD ranges from 12–24% with most estimates within the range of 6–14% in the general population [2]. The prevalence of FLD has been increasing worldwide most likely due to eating habits, lifestyle changes and improvements in diagnostic techniques [3]. When energy intake exceeds the required amount, the excess energy is stored in the adipose tissues in the form of fat leading to obesity. Insulin resistance associated with obesity is considered as the key factor to develop metabolic syndrome and FLD [4]. FLD is the most common reason for elevated liver enzymes throughout the world [5]. Although up to 70% of FLD patients are normal on laboratory findings [6]. Most of the patients of FLD are asymptomatic or have nonspecific findings that do not correlate with the severity of disease. The most common clinical symptoms of FLD are right upper quadrant pain, feeling of fullness and lethargy or malaise. In addition hepatomegaly can also be found on physical examination [7]. Other findings are related to metabolic syndrome, obesity or overweight [8].
From pathogenic interpretation FLD can be viewed as a single disease with multiple etiologies. Clinically FLD can be divided into Non-Alcoholic Fatty Liver Disease (NAFLD) and Alcoholic Fatty Liver Disease (AFLD) [9]. NAFLD is defined as FLD in the absence of hepatic damaging factors including alcohol use, hepatitis viruses and metabolic disorders [10]. In Pakistan the prevalence of NAFLD in general population is 18% [11, 12]. In western countries the prevalence of NAFLD in adults ranges from 20 to 33% [13]. AFLD is induced by consumption of excessive alcohol. It has been reported that 30 gram of alcohol intake per day can induce liver damage [14]. AFLD and NAFLD passes through similar pattern of changes consisting of fatty infiltration to Steatohepatitis that leads to cirrhosis and hepatocellular carcinoma. Despite different etiologies AFLD is difficult to distinguish from NAFLD because of similar pathological features of alcoholic steatohepatitis (ASH) and non-alcoholic steatohepatitis (NASH) [15].
Several imaging techniques can detect FLD with their own advantages and disadvantages. Ultrasound is still in the first line for determining FLD because of its safety, easy availability, cost effective and radiation-free nature. However, the grading of fatty liver by ultrasound is subjective and there is inter observer variability [16]. The reported sensitivity and specificity of ultrasound for diagnosing mild FLD ranges from 55.3% to 66.6% and 77.6% to 93.1% respectively while for moderate-severe FLD is about 90% and 95% respectively [17].
Computed Tomography (CT) can represent Liver fat content quantitatively by measuring Liver attenuation/Computed Tomographic Hounsfield numbers (CTHFN) expressed in Hounsfiled Units (HU). Liver attenuation of <40 HU represents >30% liver fat content reliably [18]. FLD can also be estimated by comparing attenuation of liver with spleen19]. It is 100% specific for diagnosis of moderate to severe FLD when liver-to-spleen attenuation ratio is <0.8. From evaluation of transplant donors, it has been concluded that unenhanced CT is excellent for detecting hepatic fat of ≥ 30% with specificity and sensitivity of 100% and 82% respectively. Radiation exposure can be reduced by using low dose protocols [20]. MR spectroscopy is the most accurate and fast method of detecting fat but it is expensive and software is not available on all MR units. MR elastography a new technique to detect liver stiffness has not been demonstrated to detect NAFLD and is still undergoing research for patients of hepatitis and cirrhosis [21]. At present percutaneous biopsy of liver is considered as the gold standard for diagnosis of FLD. However, it is not indicated in healthy individuals because it is an invasive procedure and more importantly it has many serious complications [22].
Current imaging methods including USG, CT, and MRI have shown their values to serve as noninvasive imaging methods to evaluate FLD progression, but they are still relatively limited in the detection of inflammation (NASH), which is more important than FLD in terms of its high risk for fibrosis, cirrhosis, and HCC. Detection of NASH by imaging remains the future direction in FLD [23].
FLD is subjectively categorized into mild, moderate or severe grade depending upon sonographic appearance. But there is no arithmetically defined demarcation for this grading. On the other hand, CT scan has the facility to numerically categorize different tissues on the basis of density. In this study the CT Hounsfield numbers will be compared with the sonographic grading of the fatty liver disease to define it more precisely. A good association will avoid unwanted radiation to the patient.
2. Aim
Determination of the range of CTHFN in different categories of FLD by USG.
3. Objective
To compare CT Hounsfield Numbers with Ultrasonographic categorization of the FLD.
4. Material and Methods
The rules and regulations set by the ethical committee of the University of Lahore was followed while conducting the research and the rights of the research participants were respected. It was a Cross sectional analytical study. By Purposive sampling 227 Patients of FLD were sampled from Radiology Department AL Razi Healthcare MM Alam Road Lahore and Radiology Department Shalamar Hospital Shalamar Road Lahore. The data was collected for 9 months.
Patients of both gender of age between 20-80 years, who underwent both CT and USG scans of abdomen and with Ultrasonographic diagnosis of diffuse FLD was included. Patients with Liver abnormalities including acute hepatitis and cirrhosis, right renal malformations including agenesis, right nephrectomy, right pelvic kidney and right kidney with cortical abnormalities and with congenital or acquired abnormalities of spleen were excluded.
5. Equipment
5.1 Ultrasound
Toshiba Xario with 3.5MHZ probe at both centers was used to scan patients in supine and left lateral decubitus position. Images of sagittal view of liver and right kidney were obtained; also scans were performed in multiple planes for better comparison of echogenicity. The severity of FLD was diagnosed in the presence of one of the following standards laid down by the American Gastroenterology Association: Grade 0- normal echogenicity. Liver appears equal to or slightly echogenic than right renal parenchyma. Grade I – Mild diffuse increase in echogenicity. Liver appears bright compared to the cortex of the kidney and normal picturing of diaphragm and intrahepatic vessel borders as shown in Figure 1A. Grade II - Moderate diffuse increase in echogenicity. Slightly diminished visualization of the intrahepatic vessels and diaphragm as shown in Figure 1B. Grade III - Noticeable increase in echogenicity. Poor or no visualization of intrahepatic vessels and diaphragm and poor penetration of the posterior segment of the right lobe of the liver as shown in Figure 1C [24].
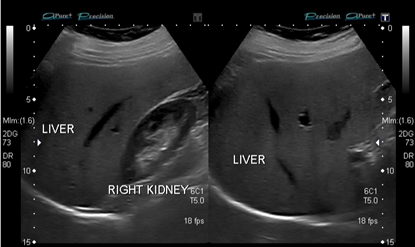
Figure 1A: Grade I FLD.
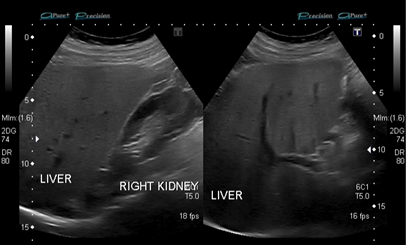
Figure 1B: Grade II FLD.
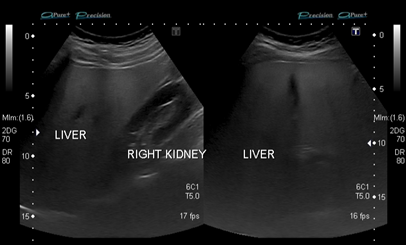
Figure 1C: Grade III FLD.
5.2 Computed tomography
Siemens 64 slice dual source at both centers was used to scan patients. Patients were scanned in supine position. Unenhanced CT (80-140 kV, 100-300 mAs, 5mm section thickness) was be performed. To calculate CTHFN of liver attenuation values were measured using random selection of regions of interest (ROIs) ranging from 50 to 100 mm2. ROIs of greater than 100mm2 were measured where possible while taking care to exclude regions of non-uniform parenchymal attenuation, including hepatic vessels and biliary structures. The ROIs circles were placed when maximum part of both lobes of liver were visible in a slice. There were two ROIs placed in the right liver lobe anterioposteriorly, one ROI in the left lobe of liver as shown in Figure 2. The ROIs values were averaged to get mean liver attenuation in Hounsfield Unit (HU) [25].
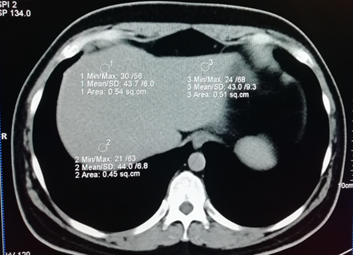
Figure 2: CTHFN of liver and Spleen measured by 2 ROI in right lobe of liver 1 ROI in left lobe of liver and 1 ROI in Spleen
6. Results
In this study 227 patients of FLD was taken. The mean age of population was 49.88 ± 14.52 years and range was 20-80 years as shown in Table 1 and Figure 3. The mean Values of CTHFN of liver was 36.16 ± 12.84 HU and range was -11.83-53.20 HU with significant p value as shown in Table 2 and Figure 4A. The frequency of male population was 141(62.11%) and female was 86 (37.89%) as shown in Figure 4B. The mild, moderate and severe FLD was found in 159 (70.04%), 50(22.03%) and 18(7.93%) patients respectively as shown in Figure 4C. The mean values of Liver CTHFN in mild, moderate and sever FLD categories by USG were 42.08 ± 5.07 HU, 24.41 ± 4.19 HU and 3.09 ± 6.64 HU respectively. These values along with P values and 95% Confidence Interval (CI) are as presented in Table 3 and Figure 5.
|
Mean |
Std. Deviation |
Minimum |
Maximum |
Range |
|
49.88 |
14.58 |
20.00 |
80.00 |
60.00 |
Table 1: Mean Age of Population.
|
Mean |
Std. Deviation |
Minimum |
Maximum |
P Value |
|
35.16 |
12.84 |
-11.83 |
53.20 |
0.000 |
Table 2: Liver Mean CTHFN.
|
FLD Category on USG |
N |
Liver CTHFN Mean HU |
Std. Deviation |
95% Confidence Interval for Mean |
P Values |
|
|
Lower Bound |
Upper Bound |
|||||
|
Mild |
159 |
42.0822 |
5.07276 |
41.2876 |
42.8768 |
0.000 |
|
Moderate |
50 |
24.7167 |
4.19824 |
23.5235 |
25.9098 |
|
|
Severe |
18 |
3.0926 |
6.64668 |
-.2127 |
6.3979 |
|
|
Total |
227 |
35.1655 |
12.84042 |
33.4861 |
36.8449 |
|
Table 3: Mean values of Liver CTHFM in USG categories of FLD.
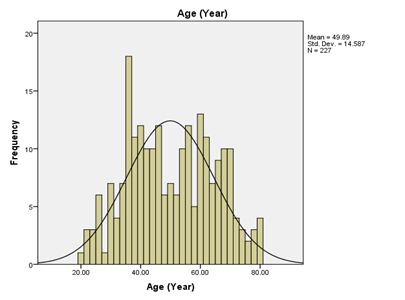
Figure 3: Mean Age of Population.
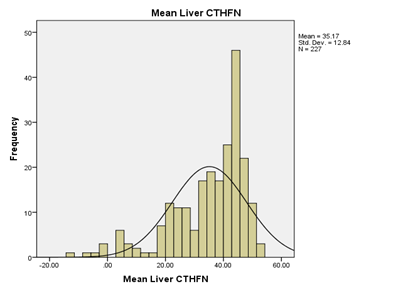
Figure 4A: Mean Liver CTHFN.
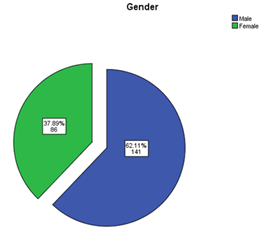
Figure 4B: Gender Frequency and Percentage.
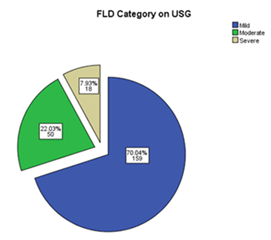
Figure 4C: Percentage of FLD Grades.
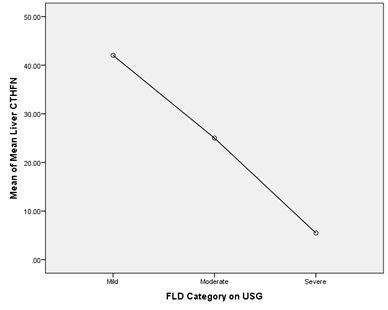
Figure 5: Mean values of Liver CTHFM in USG categories of FLD.
In multiple comparison the Least Significant Difference (LSD) of USG categories of FLD with mean Liver CTHFN, p value was significant when mild FLD was compared with moderate and severe FLD, Moderate FLD was compared with mild and severe FLD and severe FLD was compared with mild and moderate FLD as shown in Table 4.
|
Mean Liver CTHFN |
|||
|
Mild |
Moderate |
17.36551* |
0.000 |
|
Severe |
38.98959* |
0.000 |
|
|
Moderate |
Mild |
-17.36551* |
0.000 |
|
Severe |
21.62407* |
0.000 |
|
|
Severe |
Mild |
-38.98959* |
0.000 |
|
Moderate |
-21.62407* |
0.000 |
|
Table 4: Least Significant Difference (LSD) of USG categories of FLD with mean Liver CTHFN.
7. Discussion
The incidence of FLD is gradually increasing in our country and especially in developed world. The definitive diagnosis of FLD is histological examination but unfortunately this is an invasive technique. Most of the patients are not willing to perform this invasive procedure therefore majority of reversible FLD becomes complicated due to non-availability of definitive diagnostic technique. Ultrasound is the first line modality used for characterization of FLD but sonographic grading of the FLD is more subjective. There is no universal consensus on the USG classification of FLD. But CT Hounsfield numbers are a quantitative measurement of fat. This research was therefore intended to compare the sonographic grading of FLD with CT Hounsfield numbers.
FLD occurs worldwide in obese and excessive alcohol consumers [26]. FLD also occurs in metabolic disorder and several conditions that effect fatty acid metabolism [27]. The diagnosis of FLD is made when lipid content in the liver exceeds 5–10% by weight [15]. . If the cause persist, FLD invariably progresses to steatohepatitis, cirrhosis and liver cancer [28]. In 2016 Wolff L et.al. reported severe FLD is associated with excessive pericardial fat and suggested it as a marker for vascular disease [29]. FLD is a precursor or it may signal the development of hypertension, cardiovascular diseases and type II diabetes mellitus which is associated with high rates of mortality [30].
Ultrasonography is suggested as a first choice for the diagnosis of FLD, considering its wide availability, low cost and absence of side effects or risks to the patient, furthermore liver enzymes are not a good parameter for detection of FLD [31]. The prevalence of FLD in routine Sonography is much higher as compared to laboratory findings [32]. Utilizing USG the prevalence of FLD ranges from 20-40% in industrialized countries [33]. The most common criteria for grading of FLD by USG takes into account the echogenicity of liver and its comparison with echogenicity of right kidney. The grading is defined as: G 0- normal echogenicity, Liver appears slightly echogenic or isoechoic to right kidney cortex). G I- mild increase in echogenicity, Liver appears bright than right renal cortex with normal appearance of intrahepatic vessels and diaphragm; G II-Moderate increase in echogenicity with slightly blurred visualization of intrahepatic vessels and diaphragm; G III- Severe increase in echogenicity with poor or no visualization of intrahepatic vessels and diaphragm [34].
In 2011 Hernaez R et.al. [35] conducted a met-analysis on 49 studies and reported sensitivity and specificity of USG for detection of moderate-severe FLD as compared to histology (gold standard) 84.8% and 93.6% respectively. Latest studies comparing USG with histopathology have confirmed that it is a pertinent non-invasive tool for evaluation of FLD and intends Grade 0 or 1 do not require biopsy [36].
Cruz JF et.al found high prevalence of FLD in males as compared to females. They found prevalence of FLD in grade I, II and III in 51.5%, 40.4% and 8.6% patients respectively. In current study we also found high frequency of FLD in males as compared to females. We found frequency of FLD in grade I, II and III in 70.0%, 22.0 and 7.9% patients respectively.
CT can measure degree of FLD quantitatively. It employs attenuation values to estimate liver fat content. There is a reduction in Liver attenuation with an increase in intrahepatic fat content [23]. There are many studies which have shown a decrease in CTHFN with increase in severity of FLD [37]. Unenhanced normal Liver parenchyma has CTHFN (attenuation) values in the range of 50 to 65HU, typically 8-10HU greater than liver [38]. Unenhanced CT has sensitivity of 43-95% and specificity of 90-100% for detection of Liver Steatosis [39]. CT has been proved to be a sensitive modality for quantitative measurement of moderate to severe FLD but its performance for mild FLD is limited [40]. The most common diagnostic criteria for diagnosis of FLD on CT is liver CTHFN less than 40 HU or liver CTHFN less than 10HU as compared to Spleen CTHFN which correlates with pathologic fat content of 30% or more [41]. However this diagnostic criteria excludes mild FLD decreasing overall prevalence as much as 40% as compared to other CT criteria [42].
CT provides fast, objective and reproducible assessment of liver fat having a good correlation with pathologic findings obviating the need of biopsy in most of the cases [43]. But to date there has been no standard criteria for grading of FLD on CT. The first study correlating USG grading of FLD with CT was published in 1985 by John CS et al. [44] to evaluate accuracy of USG for diagnosis of FLD. They reported the overall accuracy of USG for detection of FLD 85%, with 100% sensitivity and 56% specificity. The USG/CT correlation was found particularly well for the diagnosis of grade I and II FLD.
The second study correlating USG grading of FLD with CT was done in 2015 by Jumana R37 and associates for the estimation of CT HU for different grades of FLD by USG. They reported the significant HU p values between different grades of FLD. The mean age of the patients in their study was 45years whereas in current study mean age of patients was 47 years. In their study percentage of male patients was 55% and female was 47%, in our study percentage of male patients was 62% and 37% females. They found mean values of CTHFN in grade I, II and III of FLD 37.74, 24.16 and 0.75 HU respectively. In present study we found mean values of CTHFN in grade I, II and III of FLD 42.08, 24.71 and 3.09 HU respectively.
8. Conclusion
In best of our knowledge to date this is third study comparing USG grades of FLD with CTHFN to determine CTHFN for each Ultrasonographic category of FLD. We found significant p values of CTHFN for all grades of FLD by USG. CTHFN decreased with severity of FLD. Hence we can conclude that USG is a reliable and sensitive modality for the grading of FLD.
References
- Gaba RC, Knuttinen MG, Brodsky TR, et al. Hepatic steatosis: correlations of body mass index, CT fat measurements, and liver density with biopsy results. Diagnostic and interventional radiology18 (2012): 282-287.
- Javed M. Fatty Liver: Yet another Silent Killer. Journal of Ayub Medical College Abbottabad 26 (2014): 1-2.
- Vernon G, Baranova A, Younossi Z. Systematic review: the epidemiology and natural history of non?alcoholic fatty liver disease and non?alcoholic steatohepatitis in adults. Alimentary pharmacology & therapeutics 34 (2011): 274-285.
- Evans RM, Barish GD, Wang Y-X. PPARs and the complex journey to obesity. Nature medicine. 2004;10(4):355.
- Lankarani KB, Mahmoodi M, Lotfi M, Zamiri N, Heydari ST, Ghaffarpasand F, et al. Common Carotid Intima-media Thickness in Patients with Non-alcoholic Fatty Liver Disease: A Population-based Case-control Study. Korean J Gastroenterol 62 (2013): 344-351.
- Browning JD, Szczepaniak LS, Dobbins R, et al. Prevalence of hepatic steatosis in an urban population in the United States: impact of ethnicity. Hepatology 40 (2004): 1387-1395.
- Wieckowska A, McCullough AJ, Feldstein AE. Noninvasive diagnosis and monitoring of nonalcoholic steatohepatitis: present and future. Hepatology 46 (2007): 582-589.
- Stefan N, Kantartzis K, Ha?ring H-U. Causes and metabolic consequences of fatty liver. Endocrine reviews 29 (2008): 939-960.
- Sambasiva Rao M, Reddy JK. PPARα in the pathogenesis of fatty liver disease. Hepatology 40 (2004): 783-786.
- Lankarani KB, Ghaffarpasand F, Mahmoodi M, et al. Non alcoholic fatty liver disease in southern Iran: a population based study. Hepatitis monthly 13 (2013): e9248.
- LaBrecque DR, Abbas Z, Anania F, et al. World Gastroenterology Organisation global guidelines: Nonalcoholic fatty liver disease and nonalcoholic steatohepatitis. Journal of clinical gastroenterology 48 (2014): 467-473.
- Alam S, Hossain MM, Azam G, et al. Nonalcoholic Fatty Liver Disease: A New Frontier for Hepatology in Bangladesh and a Call for Action to Combat. Journal of Bangladesh College of Physicians and Surgeons 35 (2017): 184-191.
- Qiao Q-H, Zhu W-H, Yu Y-X, et al. Nonalcoholic fatty liver was associated with asymptomatic gallstones in a Chinese population. Medicine 96 (2017).
- Fatima M. Prevalence and identification of fatty liver (FL) risk markers in local Pakistani population. Journal of Chemical and Pharmaceutical Research 7 (2015): 23.
- Reddy JK, Sambasiva Rao M. Lipid metabolism and liver inflammation. II. Fatty liver disease and fatty acid oxidation. American Journal of Physiology-Gastrointestinal and Liver Physiology 290 (2006): G852-G858.
- Valls C, Iannacconne R, Alba E, Murakami T, et al. Fat in the liver: diagnosis and characterization. European radiology 16 (2006): 2292-2308.
- Lee DH. Imaging evaluation of non-alcoholic fatty liver disease: focused on quantification. Clinical and molecular hepatology 23 (2017): 290.
- Kodama Y, Ng CS, Wu TT, et al. Comparison of CT methods for determining the fat content of the liver. American Journal of Roentgenology 188 (2007): 1307-1312.
- Zeb I, Li D, Nasir K, Katz R, et al. Computed tomography scans in the evaluation of fatty liver disease in a population based study: the multi-ethnic study of atherosclerosis. Academic radiology 19 (2012): 811-818.
- Singh D, Das CJ, Baruah MP. Imaging of non alcoholic fatty liver disease: A road less travelled. Indian journal of endocrinology and metabolism 17 (2013): 990.
- Roldan-Valadez E, Favila R, Martínez-López M, et al. Imaging techniques for assessing hepatic fat content in nonalcoholic fatty liver disease. Annals of hepatology 7 (2008): 212-220.
- Speliotes EK, Massaro JM, Hoffmann U, et al. Liver fat is reproducibly measured using computed tomography in the Framingham Heart Study. Journal of gastroenterology and hepatology 23 (2008): 894-899.
- .
- Saadeh S, Younossi ZM, Remer EM, et al. The utility of radiological imaging in nonalcoholic fatty liver disease. Gastroenterology 123 (2002): 745-750.
- Singh D, Das CJ, Baruah MP. Imaging of non alcoholic fatty liver disease: A road less travelled. Indian journal of endocrinology and metabolism 17 (2013): 990-995.
- Crabb DW, Galli A, Fischer M, You M. Molecular mechanisms of alcoholic fatty liver: role of peroxisome proliferator-activated receptor alpha. Alcohol 34 (2004): 35-38.
- Browning JD, Horton JD. Molecular mediators of hepatic steatosis and liver injury. The Journal of clinical investigation 114 (2004): 147-152.
- Schwimmer JB, Behling C, Newbury R, et al. Histopathology of pediatric nonalcoholic fatty liver disease. Hepatology 42 (2005): 641-649.
- Wolff L, Bos D, Murad SD, Franco OH, et al. Liver fat is related to cardiovascular risk factors and subclinical vascular disease: the Rotterdam Study. European Journal of Echocardiography 17 (2016): 1361-1367.
- Rector RS, Thyfault JP, Wei Y, et al. Non-alcoholic fatty liver disease and the metabolic syndrome: an update. World journal of gastroenterology: WJG 14 (2008): 185.
- AlShaalan R, Aljiffry M, Al-Busafi S, et al. Nonalcoholic fatty liver disease: Noninvasive methods of diagnosing hepatic steatosis. Saudi journal of gastroenterology: official journal of the Saudi Gastroenterology Association 21 (2015): 64.
- Lazo M, Clark JM, The epidemiology of nonalcoholic fatty liver disease: a global perspective. Seminars in liver disease; 2008: © Thieme Medical Publishers (2008).
- Williams CD, Stengel J, Asike MI, et al. Prevalence of nonalcoholic fatty liver disease and nonalcoholic steatohepatitis among a largely middle-aged population utilizing ultrasound and liver biopsy: a prospective study. Gastroenterology 140 (2011): 124-131.
- Saadeh S, Younossi ZM, Remer EM, et al. The utility of radiological imaging in nonalcoholic fatty liver disease. Gastroenterology 123 (2002): 745-750.
- Hernaez R, Lazo M, Bonekamp S, et al. Diagnostic accuracy and reliability of ultrasonography for the detection of fatty liver: a meta? Hepatology 54 (2011): 1082-1090.
- Eifler RV. The role of ultrasonography in the measurement of subcutaneous and visceral fat and its correlation with hepatic steatosis. Radiologia Brasileira 46 (2013): 273-278.
- Rahman J, Yadav S, Prakashini K, et al. Estimation of range of hounsfield unit on CT for different grades of fatty infiltration of liver categorized using ultrasound. GJRA-Global Journala for Research Analysis 4 (2015): 337-340.
- Park SH, Kim PN, Kim KW, et al. Macrovesicular hepatic steatosis in living liver donors: use of CT for quantitative and qualitative assessment. Radiology 239 (2006): 105-112.
- Lawrence DA, Oliva IB, Israel GM. Detection of hepatic steatosis on contrast-enhanced CT images: diagnostic accuracy of identification of areas of presumed focal fatty sparing. American Journal of Roentgenology 199 (2012): 44-47.
- Huber A, Ebner L, Heverhagen JT, et al. State-of-the-art imaging of liver fibrosis and cirrhosis: A comprehensive review of current applications and future perspectives. European journal of radiology open 2 (2015): 90-100.
- Wells MM, Li Z, Addeman B, et al. Computed Tomography Measurement of Hepatic Steatosis: Prevalence of Hepatic Steatosis in a Canadian Population. Can J Gastroenterol Hepatol (2016): 4930987.
- Boyce CJ, Pickhardt PJ, Kim DH, et al. Hepatic steatosis (fatty liver disease) in asymptomatic adults identified by unenhanced low-dose CT. AJR Am J Roentgenol 194 (2010): 623-628.
- Boyce CJ, Pickhardt PJ, Kim DH, et al. Hepatic steatosis (fatty liver disease) in asymptomatic adults identified by unenhanced low-dose CT. American Journal of Roentgenology 194 (2010): 623-628.
- Scatarige J, Scott W, Donovan P, et al. Fatty infiltration of the liver: ultrasonographic and computed tomographic correlation. Journal of Ultrasound in Medicine 3 (1984): 9-14.
