Combination of Entropy and Electroencephalograpy for Deep of Hypnosis Monitoring Improvement during General Anesthesia
Article Information
Alberto Martinez Ruiz1, Blanca Escontrela2*, Itxaso Merino Julian2
1Chief of Department of Anesthesia and Critical Care Cruces University Hospital, Barakaldo, Basque Country, Spain
2Consultant Department of Anesthesia and Critical Care Cruces University Hospital, Barakaldo, Basque Country, Spain
*Corresponding Author: Blanca Escontrela. Consultant Department of Anesthesia and Critical Care Cruces University Hospital, Barakaldo, Basque Country, Spain
Received: 18 May 2023; Accepted: 26 May 2023; Published: 03 November 2023
Citation: Alberto Martinez Ruiz, Blanca Escontrela, Itxaso Merino Julian. Combination of Entropy and Electroencephalograpy for Deep of Hypnosis Monitoring Improvement during General Anesthesia. Anesthesia and Critical Care 5 (2023): 53-68.
View / Download Pdf Share at FacebookAbstract
Background: Deep of hypnosis monitoring based on electroencephalogram (EEG) and end tidal anesthetic concentration (ETAC) of volatile agents are a standard of care in patients under general anesthesia. Entropy and ETAC could reflected the effects of volatile agents as evidence had been showed, but its accuracy for hypnosis monitoring during nociceptive stimulation in patients under neuromuscular block and emergence is controversial.
Methods: Prospective, single-group, double-blinded and observational study was conducted in young female patients scheduled for minor gynecological surgery under general anesthesia. A standard protocol was administered to all patients and deep of hypnosis monitoring using entropy and quantitative EEG (qEEG) was blind to anesthesiologist in charge. Primary outcomes were described changes and discrimination capacity of hypnosis depth of entropy, qEEG and ETAC from induction to emergence. Secondary outcome was described an equation of hypnosis state prediction using entropy, qEEG and ETAC based on its discrimination capacity of hypnosis depth.
Results: 42 patients scheduled for minor gynecological surgery under general anesthesia were included. Combination of frontal electromyogram (fEMG), Response Entropy (RE), delta and theta activities showed an excellent prediction capacity of hypnosis state. Entropy and fEMG showed an excellent discrimination capacity of hypnosis depth from induction to emergence. Delta activity showed a good discrimination capacity of hypnosis state during emergence. Electroencephalogram amplitude during maintenance and median Frequency (MF) during emergence showed an acceptable discrimination capacity of hypnosis depth. Beta/Delta ratio (B/D) during induction and emergence showed an acceptable discrimination capacity of hypnosis depth. During maintenance Burst Suppression corrected for Spectral Edge Frequency ratio (BcSEF) and Beta/Theta ratio (B/T) showed an acceptable discrimination capacity of hypnosis depth. ETAC showed a good discrimination capacity from laryngoscopy to emergence. ETAC variability was poorly explained for entropy. Entropy variability was poorly explained for ETAC and EEG variables.
Conclusions: Our study described an equation for hypnosis state prediction combining fast, intermediate and slow activity. An interesting finding of the present study was that delta activity, MF, amplitude and corrected variables probably reflecting the balance between slow and fast activity could improve deep of hypnosis monitoring, but limitations related to little size and design of this study warrants further validation.
Keywords
Deep of hypnosis; Electroencephalogram; Entropy; General anesthesia.
Deep of hypnosis articles; Electroencephalogram articles; Entropy articles; General anesthesia articles
Deep of hypnosis articles Deep of hypnosis Research articles Deep of hypnosis review articles Deep of hypnosis PubMed articles Deep of hypnosis PubMed Central articles Deep of hypnosis 2023 articles Deep of hypnosis 2024 articles Deep of hypnosis Scopus articles Deep of hypnosis impact factor journals Deep of hypnosis Scopus journals Deep of hypnosis PubMed journals Deep of hypnosis medical journals Deep of hypnosis free journals Deep of hypnosis best journals Deep of hypnosis top journals Deep of hypnosis free medical journals Deep of hypnosis famous journals Deep of hypnosis Google Scholar indexed journals Electroencephalogram articles Electroencephalogram Research articles Electroencephalogram review articles Electroencephalogram PubMed articles Electroencephalogram PubMed Central articles Electroencephalogram 2023 articles Electroencephalogram 2024 articles Electroencephalogram Scopus articles Electroencephalogram impact factor journals Electroencephalogram Scopus journals Electroencephalogram PubMed journals Electroencephalogram medical journals Electroencephalogram free journals Electroencephalogram best journals Electroencephalogram top journals Electroencephalogram free medical journals Electroencephalogram famous journals Electroencephalogram Google Scholar indexed journals Entropy articles Entropy Research articles Entropy review articles Entropy PubMed articles Entropy PubMed Central articles Entropy 2023 articles Entropy 2024 articles Entropy Scopus articles Entropy impact factor journals Entropy Scopus journals Entropy PubMed journals Entropy medical journals Entropy free journals Entropy best journals Entropy top journals Entropy free medical journals Entropy famous journals Entropy Google Scholar indexed journals General anesthesia articles General anesthesia Research articles General anesthesia review articles General anesthesia PubMed articles General anesthesia PubMed Central articles General anesthesia 2023 articles General anesthesia 2024 articles General anesthesia Scopus articles General anesthesia impact factor journals General anesthesia Scopus journals General anesthesia PubMed journals General anesthesia medical journals General anesthesia free journals General anesthesia best journals General anesthesia top journals General anesthesia free medical journals General anesthesia famous journals General anesthesia Google Scholar indexed journals Beta/Theta ratio articles Beta/Theta ratio Research articles Beta/Theta ratio review articles Beta/Theta ratio PubMed articles Beta/Theta ratio PubMed Central articles Beta/Theta ratio 2023 articles Beta/Theta ratio 2024 articles Beta/Theta ratio Scopus articles Beta/Theta ratio impact factor journals Beta/Theta ratio Scopus journals Beta/Theta ratio PubMed journals Beta/Theta ratio medical journals Beta/Theta ratio free journals Beta/Theta ratio best journals Beta/Theta ratio top journals Beta/Theta ratio free medical journals Beta/Theta ratio famous journals Beta/Theta ratio Google Scholar indexed journals Spectral Edge Frequency ratio articles Spectral Edge Frequency ratio Research articles Spectral Edge Frequency ratio review articles Spectral Edge Frequency ratio PubMed articles Spectral Edge Frequency ratio PubMed Central articles Spectral Edge Frequency ratio 2023 articles Spectral Edge Frequency ratio 2024 articles Spectral Edge Frequency ratio Scopus articles Spectral Edge Frequency ratio impact factor journals Spectral Edge Frequency ratio Scopus journals Spectral Edge Frequency ratio PubMed journals Spectral Edge Frequency ratio medical journals Spectral Edge Frequency ratio free journals Spectral Edge Frequency ratio best journals Spectral Edge Frequency ratio top journals Spectral Edge Frequency ratio free medical journals Spectral Edge Frequency ratio famous journals Spectral Edge Frequency ratio Google Scholar indexed journals frontal electromyogram articles frontal electromyogram Research articles frontal electromyogram review articles frontal electromyogram PubMed articles frontal electromyogram PubMed Central articles frontal electromyogram 2023 articles frontal electromyogram 2024 articles frontal electromyogram Scopus articles frontal electromyogram impact factor journals frontal electromyogram Scopus journals frontal electromyogram PubMed journals frontal electromyogram medical journals frontal electromyogram free journals frontal electromyogram best journals frontal electromyogram top journals frontal electromyogram free medical journals frontal electromyogram famous journals frontal electromyogram Google Scholar indexed journals electroencephalogram articles electroencephalogram Research articles electroencephalogram review articles electroencephalogram PubMed articles electroencephalogram PubMed Central articles electroencephalogram 2023 articles electroencephalogram 2024 articles electroencephalogram Scopus articles electroencephalogram impact factor journals electroencephalogram Scopus journals electroencephalogram PubMed journals electroencephalogram medical journals electroencephalogram free journals electroencephalogram best journals electroencephalogram top journals electroencephalogram free medical journals electroencephalogram famous journals electroencephalogram Google Scholar indexed journals end tidal anesthetic concentration articles end tidal anesthetic concentration Research articles end tidal anesthetic concentration review articles end tidal anesthetic concentration PubMed articles end tidal anesthetic concentration PubMed Central articles end tidal anesthetic concentration 2023 articles end tidal anesthetic concentration 2024 articles end tidal anesthetic concentration Scopus articles end tidal anesthetic concentration impact factor journals end tidal anesthetic concentration Scopus journals end tidal anesthetic concentration PubMed journals end tidal anesthetic concentration medical journals end tidal anesthetic concentration free journals end tidal anesthetic concentration best journals end tidal anesthetic concentration top journals end tidal anesthetic concentration free medical journals end tidal anesthetic concentration famous journals end tidal anesthetic concentration Google Scholar indexed journals Response Entropy articles Response Entropy Research articles Response Entropy review articles Response Entropy PubMed articles Response Entropy PubMed Central articles Response Entropy 2023 articles Response Entropy 2024 articles Response Entropy Scopus articles Response Entropy impact factor journals Response Entropy Scopus journals Response Entropy PubMed journals Response Entropy medical journals Response Entropy free journals Response Entropy best journals Response Entropy top journals Response Entropy free medical journals Response Entropy famous journals Response Entropy Google Scholar indexed journals
Article Details
1. Introduction
Deep of hypnosis monitoring is a currently recommended standard of care during general anesthesia according to guidelines [1] as an indication of anesthetic drugs effects on brain electrical activity registered for processed electroencephalographic monitors like Bispectral Index (BIS) and entropy. Although end tidal anesthetic concentration (ETAC) could indicate drug concentration in blood and brain [1], previous studies showed that entropy monitoring also reflected effects of sevoflurane (2) and reduces its uptake [3]. Nevertheless, alert state after emergence of general anesthesia is a main challenge for deep of hypnosis monitors because this brain reactivation probably come from subcortical structures [4] not registered for electroencephalographic monitors. Entropy monitor (GE Healthcare®, Helsinki, Finland) analyses space and temporal integration of brain neuronal activity registered for frontal electroencephalogram (EEG) [2,4]. State entropy (SE) and Response Entropy (RE) gives complementary information for deep of hypnosis monitoring [2,4-9]. SE showed dominant band of EEG spectrum, reflecting mainly cortical brain electrical activity [4,5,7,8,10-15] using a time window between 60 to 16 seconds obtaining values from 0 (deep hypnosis state) to 91 (awake state) [8,11,13,14,16,17]. RE showed higher frequency bands including those of frontal electromyogram (fEMG) [4,5,7,8,9,10-13], with a time window between 15 to 1.92 seconds, obtaining values from 0 to 100 [8,11,13,14,16,17]. Entropy correctly reflected all general anesthesia phases according to evidence [4]. RE has advantages for monitoring induction and emergence [11,18], with benefits for potentially reducing time to alert state [2,19,20]. Classic intraoperative awareness associated with increase of higher amplitude bands of fEMG could be faster monitored for RE compared to SE and BIS [18]. A lack of strong evidence related to entropy performance for time to awakening and recall of intraoperative awareness make necessary more powerful studies [21].
Important changes of hypnosis depth during general anesthesia mainly related to imbalance between surgical stimulation and hypnosis drugs concentration probably required a combined approach for accurately monitoring and reducing complications associated to slight or deep anesthesia probably related with higher mortality and costs. Quantitative electroencephalogram (qEEG) and entropy classically showed changes associated to general anesthesia [18, 22]. Corrected electroencephalographic variables reflecting balance between fast and slow activity could have advantages for deep of hypnosis monitoring. This study aims to describe a prediction equation of hypnosis state combining entropy and qEEG variables for deep of hypnosis monitoring improvement during general volatile anesthesia with sevoflurane.
2. Methods
2.1 Study design and population:
This prospective, single group, double blind and observational study was conducted in Anesthesia and Critical Care Department of Cruces University Hospital between 2019 and 2020. Female patients between 18 to 60 years, ASA I and II scheduled for minor gynecology surgery after informed consent sign were included (Table 1). Patients with neurological disease, substance abuse history, obesity, negative decision to participate in study or simultaneously participating in another study were excluded. (Table 1). Ethical Committee of Clinical Investigation acceptance was obtained before inclusion of patients.
Table 1: Inclusion and Exclusion criteria
|
Inclusion criteria |
Female patients Age between 18 and 60 years ASA I and II. Scheduled minor gynecological surgery Signed informed consent |
|
Exclusion criteria |
Neurological disease History of substance abuse Obesity (BMI greater than 28) Patient refusal to participate in study Simultaneous participation in another study |
BMI: Body Mass Index
2.2 Anesthesia protocol:
A standard monitoring with Non-Invasive Blood Pressure, electrocardiogram and peripheral pulse oximeter (Sp02) was placed when patient arrived at operating room. Pre-oxygenation with 100% of oxygen until reaching an exhaled fraction of oxygen close to 90% and standard intravenous induction with 1 mg of midazolam, 3 ug/Kg of fentanyl, 2 mg/Kg of propofol and 0.15 mg/Kg of cisatracurium was performed in all patients. Then, ventilation with face mask for 180 seconds and orotracheal intubation was made. If difficulties, ventilation with face mask was restarted and a new attempt of intubation was made in 60 seconds. Mechanical ventilation with mixture of air and oxygen for a fraction of inspired oxygen (Fi02) of 50%, tidal volume of 6 ml/Kg, positive end-expiratory pressure (PEEP) between 4 to 6 cm of H20 and respiratory rate between 10 to 12 breaths per minute was made with adjustments based on anesthesiologist decision. Sevoflurane at 2% was used for anesthesia maintenance with a constant Minimum Alveolar Concentration (MAC) between 0.7 to 1.2 and ETAC was monitored. Additional doses of fentanyl were administered based on anesthesiologist decision. Intravenous analgesia with 50 mg of dexketoprofen or 2 g of metamizole and 1 g of paracetamol prior to emergence and prophylaxis of postoperative nausea and vomiting (PONV) with ondansetron 4 mg intravenous was administered.
2.3 Deep of hypnosis monitoring:
Deep of hypnosis monitoring using entropy and qEEG was placed for study team and anesthesiologist in charge of operating room was blinded to it. Entropy, qEEG and ETAC were observed before induction throughout surgery and after emergence. Entropy sensor (GE Healthcare®, Datex-Ohmeda Division, Instrumentarium Corp, Helsinki, Finland) was placed over skin of frontal area cleaned with 70% alcohol according to manufacturer recommendations with the first, second and third electrodes on frontal, orbicular and temporal muscles, respectively. Impedance of electrodes with skin was found to be less than 7.5 kΩ. Values of SE and RE were calculated for M-ENTROPY® module of Datex-Ohmeda S/5 anesthesia monitor (GE Healthcare®, Datex-Ohmeda Division, Instrumentarium Corp, Helsinki, Finland) using a scale from 0 to 91 for SE and 0 to 100 for RE. qEEG surface electrodes (Zipprep, Aspect Medical Systems Inc, Norwood, Massachusetts) were placed over skin of frontal area cleaned with 70% alcohol in position Fp1, Fp2, F7, F8 and Fz according to international system 10/20. Impedance of electrodes with skin was less than 10 kΩ. Spectral analysis of qEEG including Spectral Edge Frequency (SEF), Medium frequency (MF), amplitude, Burst Suppression Rate (BSR), relative powers α, β ,δ, θ and fEMG was performed for M-EEG® module of Datex-Ohmeda S/5 anesthesia monitor (GE Healthcare®, Datex Ohmeda Division, Instrumentarium Corp,Helsinki, Finland). A frequency range between 0.5 to 30 Hz was used for qEEG and 60 to 300 Hz for fEMG.
Variables:
Baseline variables were age, Heart Rate (HR), Systolic Blood Pressure (SBP), Sp02 and temperature. Intraoperative variables were HR, SBP, ETAC, SE, RE, SEF, MF, BSR, amplitude, fEMG and α, β, δ, θ activity.
SEF corrected for BSR (BcSEF), Beta/Theta (B/T) and Beta/Delta (B/D) ratios were corrected EEG variables calculated using follow equations:
Spectral Edge Frequency corrected for Burst Suppression Rate (BcSEF)
BcSEF= SEF95 x (1- BSR /100)
Beta/Theta ratio (B/T)
B/T= % beta band / % theta band
Beta/Delta ratio (B/D)
B/D= % beta band / % delta band
In time 0 (T0) patient was awake, time 1 (T1) was induction of anesthesia, time 2 (T2) was nociceptive stimulation of laryngoscopy, time 3 to 6 (T3-6) was maintenance and time 7 to 8 (T7-8) was emergence.
Clinical variables were awake defined as patient responds to verbal command or sleep when patient does not respond to verbal commands or nociceptive stimulus (jaw pull) in each anesthesia times of induction, laryngoscopy, maintenance and emergence.
Outcomes:
Primary outcomes were described changes and discrimination capacity of hypnosis depth of entropy, qEEG and ETAC in each study times. Correlation between entropy, qEEG, ETAC and hemodynamic variables (HR and SBP) and regression analysis to explained variability of ETAC and entropy were another primary endpoints.
Secondary outcome was described an equation of hypnosis state prediction using entropy and qEEG based on its discrimination capacity of hypnosis depth.
Statistical analysis:
All baseline and intraoperative variables were stored using Datex-Ohmeda S/5 Collect software (Datex-Ohmeda Division, Instrumentarium Corp,Helsinki, Finland) for offline analysis. Statistical analysis was performed using SPSS 19 software (IBM® SPSS Chicago IL). Sample size was calculated based on previously published data of likelihood of entropy, qEEG variables and ETAC to correctly discriminate hypnosis depth [23,24]. Kolmogorov Smirnov test was used to determine normality of distributions. Mean, median, standard deviation (SD) and interquartile ranges (IQR) of variables were calculated in each study times.
Comparisons of means was performed using t test for normal distributed variables and Wilcoxon test for non-normal distributed variables to determine differences between study times with p value of 5%. Receiver Operating Characteristics (ROC) curves showed discrimination capacity of entropy, qEEG variables and ETAC to monitoring deep of hypnosis in each study times using Wilcoxon or Mann Whitney tests; values higher than 0.7 were considered acceptable and rounding 1 a perfect discrimination capacity. A linear correlation was performed to determine the strength of association between entropy, qEEG, ETAC and hemodynamic variables (HR and SBP) using Rho Spearman test and considering a strong correlation if values rounding + 1 and -1. Linear regression analysis determined capacity of entropy to explained ETAC variability or ETAC and qEEG variables to explained entropy variability.
A logistic regression analysis was performed for described an equation of depth of hypnosis prediction using entropy and qEEG variables. Validity of the model was tested with -2log plausibility, R square of Cox and Snell and R square of Nagelkerke. The overall fit of the model was checked with the Hosmer Lemeshow test.
3. Results and Discussion
3.1 Baseline variables:
42 patients were included in this study. Baseline variables were mean SBP of 140 mmHg, HR of 95 bpm and temperature of 36 ºC (Table 2)
Table 2: Baseline variables
|
AGE (years) Mean (SD) |
39 (8) |
|
SYSTOLIC BLOOD PRESSURE (mmHg) Mean (SD) |
139.7 (13.2) |
|
HEART RATE (bpm) Mean (SD) |
94.76 (1.6) |
|
Sp02 (%) Mean (SD) |
99 (0.47) |
|
TEMPERATURE (ºC) Mean (SD) |
36 (0.19) |
3.2 Comparison of Means:
Comparison of means of SBP, HR, ETAC, entropy, qEEG and corrected variables from induction to emergence of general anesthesia were made (Table 3, figures 1 to 16 supplemental content)
Table 3: Comparison of means of Systolic Blood Pressure, Heart Rate, End Tidal Anesthetic Concentration, Entropy, Quantitative Electroencephalographic and Corrected Variables from induction to emergence of anesthesia
|
Variable |
Induction |
Laryngoscopy |
Maintenance |
Emergence |
|
SYSTOLIC BLOOD PRESSURE (SBP) (95% CI) |
↓10,082 (3,953 - 16,210 p 0.002 |
↑-20,975 (-27,618 - -14,332) p 0.000 |
↓22,620 (18,563 - 26,678) p 0.000 |
↑-8,201 (-12,508 - -3,895) p 0.000 |
|
HEART RATE (HR) (95% CI) |
≈ -7,143 (-11,662 - -2,623) p 0.002 |
↑-6,725 (-11,152 - -2,299) |
↓7,855 (4,632 - 11,078) p 0.000 |
↑-5,288 (-8,532 - -2,044) p 0.000 |
|
END TIDAL ANESTHETIC CONCENTRATION (ETAC) (95% CI) |
↑-0,055 (-0,095 - -0,015) p 0.008 |
↑-0,938 (-1,013 - -0,862) p 0.000 |
↓0,109 (-0,023 - 0,240) p 0.104 |
↓0,439 (0,342 - 0,536) p 0.000 |
|
STATE ENTROPY (SE) (95% CI) |
↓61,976 (59,150 - 64,802) p 0.000 |
↑-26,961 (-30,572 - -23,349) p 0.000 |
↑ -5,565(-7,927 - -3,204) p 0.000 |
↑-21,511 (-23,876 - -19,146) p 0.000 |
|
RESPONSE ENTROPY (RE) (95% CI) |
↓69,968 (67,131 - 72,806) |
↑-27,748(-31,638 - -23,858) p 0.000 |
↑-7,203 (-10,019 - -4,386) p 0.000 |
↑-27,204 (-30,113 - -24,296) p 0.000 |
|
FRONTAL ELECTROMYOGRAM (fEMG) (95% CI) |
↓3,609 (2,883 - 4,334) p 0.000 |
↑-0,125 (-0,651 - 0,401) p 0.639 |
↓ -0,048 (-0,154 - 0,058) p 0.368 |
↑-1,840(-2,452 - -1,228) p0.000 |
|
AMPLITUDE (95% CI) |
↑ -11,930 (-15,636 - -8,223) p 0.000 |
↓7,115(3,944 - 10,286) p 0.000 |
↓ 4,261 (2,747 - 5,774) p 0.000 |
↓5,045 (2,628 - 7,463) p0.000 |
|
ALPHA POWER (95% CI) |
↓4,139 (1,455 - 6,823) p 0.003 |
↑-6,591 (-8,464 - -4,718) p 0.000 |
↑-8,976 (-11,345 - -6,607) p 0.000 |
↓8,672 (5,434 - 11,910) p0.000 |
|
BETA POWER (95% CI) |
↓4,806 (2,852 - 6,759) p 0.000 |
↑-3,035 (-4,402 - -1,667) p 0.000 |
↓-0,371 (-1,160 - 0,418) p 0.354 |
↑-2,824 (-5,466 - -0,183) p 0.036 |
|
DELTA POWER (95% CI) |
↑-12,287 (-17,174 - -7,400) p 0.000 |
↓15,957 (12,050 - 19,863) p 0.000 |
↓12,702 (9,300 - 16,103) p 0.000 |
↑-9,916 (-14,876 - 4,956) p 0.000 |
|
THETA POWER (95% CI) |
↓3,361 (1,716 - 5,006) p 0.000 |
↑-6,357 (-8,082 - -4,631) p 0.000 |
↑-3,298 (-4,579 - -2,017) p 0.000 |
↓4,053 (2,336 - 5,771) p 0.000 |
|
SPECTRAL EDGE FREQUENCY (SEF) (95% CI) |
↓4,806 (3,234 - 6,377) p 0.000 |
↑-5,052 (-6,122 - -3,983) p 0.000 |
↑-0,895 (-1,460 - -0,330) p 0.002 |
↑-1,382 (-2,301 - -0,462) p0.004 |
|
MEDIAN FREQUENCY (MF) (95% CI) |
↓0,389 (-0,168 - 0,946) p 0.169 |
↑-0,626 (-1,089 - -0,163) p 0.008 |
↑-1,226 (-1,650 - -0,802) p 0.000 |
↓1,214 (0,383 - 2,044) p 0.005 |
|
SPECTRAL EDGE FREQUENCY CORRECTED FOR SUPPRESSION RATE (BcSEF) (95% CI) |
↓1,808 (0,813 - 2,803) p 0.000 |
↑-3,341 (-4,139 - -2,542) p 0.000 |
↓1,516 (0,519 - 2,514) p 0.003 |
↓3,665 (2,712 - 4,618) p 0.000 |
|
BETA /THETA RATIO (B/T) (95% CI) |
↓0,717 (0,093 - 1,342) p 0.025 |
↑-0,145 (-0,362 -0,072) p 0.187 |
↑-0,145 (-0,314 - 0,024) p 0.092 |
↑-1,885 (-3,267 --0,502) p 0.008 |
|
BETA/DELTA RATIO (B/D) (95% CI) |
≈ 0,019 (-0,040 - 0,077) p 0.530 |
↑0,000 (-0,049 - 0,049) p 1.000 |
≈-0,016 (-0,055 - 0,023) p 0.416 |
↓0,183 (-0,071 - 0,438) p 0,157 |
3.3 Discrimination Capacity:
Discrimination capacity of SBP, HR, ETAC, entropy, qEEG and corrected variables from induction to emergence of general anesthesia was observed (Table 4, Figures 1 to 12).
Table 4: Discrimination capacity of Systolic Blood Pressure, Heart Rate, End tidal of Anesthetic Concentration, Entropy, Quantitative Electroencephalographic and Corrected Variables from induction to emergence of anesthesia
|
INDUCTION |
LARYNGOSCOPY |
MAINTENANCE |
EMERGENCE |
|
|
SYSTOLIC BLOOD PRESSURE (SBP) |
0,757±0.06 |
0,58±0.07 |
0,457±0.07 |
0,635±0.07 |
|
HEART RATE (HR) |
0,515±0,062 |
0,554±0,066 |
0,540±0,062 |
0,603±0,058 |
|
END TIDAL ANESTHESIC CONCENTRATION (ETAC) |
0,52±0,07 |
0,982±0,02 |
1 |
0,884±0,04 |
|
STATE ENTROPY (SE) |
0,997±0,002 |
0,959±0,022 |
0,998±0,022 |
0,844±0,046 |
|
RESPONSE ENTROPY (RE) |
0,999±0,002 |
0,985±0,01 |
1 |
0,862±0,044 |
|
FRONTAL ELECTROMYOGRAM (fEMG) |
0,933±0,04 |
0,941±0.032 |
0,977±0,02 |
0,756±0,06 |
|
AMPLITUDE |
0,829±0,052 |
0,739±0,068 |
0,781±0,06 |
0,644±0,072 |
|
BETA POWER |
0,694±0,062 |
0,527±0,066 |
0,557±0,064 |
0,696±0,062 |
|
THETA POWER |
0,630±0,066 |
0,654±0,062 |
0,709±0,056 |
0,616±0,064 |
|
DELTA POWER |
0,630±0,064 |
0,667±0,058 |
0,696±0,056 |
0,808±0,048 |
|
SPECTRAL EDGE FREQUENCY (SEF) |
0,695±0,062 |
0,528±0,066 |
0,544±0,066 |
0,635±0,064 |
|
MEDIAN FREQUENCY (MF) |
0,514±0,068 |
0,645±0,062 |
0,7±0,056 |
0,759±0,048 |
|
SPECTRAL EDGE FREQUENCY CORRECTED FOR SUPPRESSION RATE (BcSEF) |
0,563±0,066 |
0,563±0,033 |
0,766±0,027 |
0,509±0,07 |
|
BETA/THETA RATIO (B/T) |
0,648±0,068 |
0,589±0,068 |
0,711±0,062 |
0,579±0,06 |
|
BETA/DELTA RATIO (B/D) |
0,711±0,062 |
0,537±0,066 |
0,524±0,058 |
0,713±0,064 |
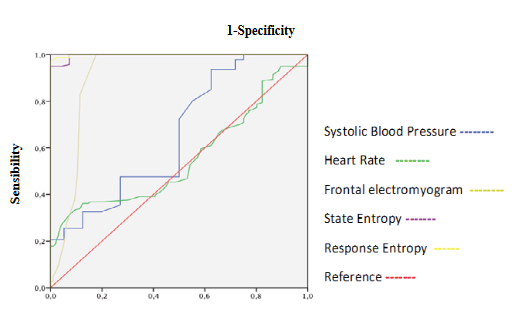
Figure 1: ROC curves of Systolic Blood Pressure, Heart Rate, Frontal Electromyogram and Entropy during induction.
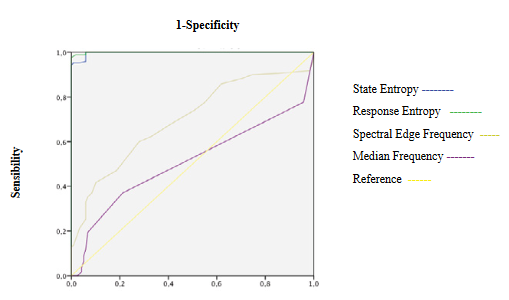
Figure 2: ROC curves of Entropy and Electroencephalogram variables during induction
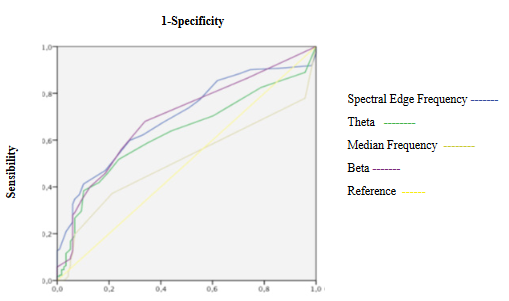
Figure 3: ROC curves of Electroencephalogram variables during induction
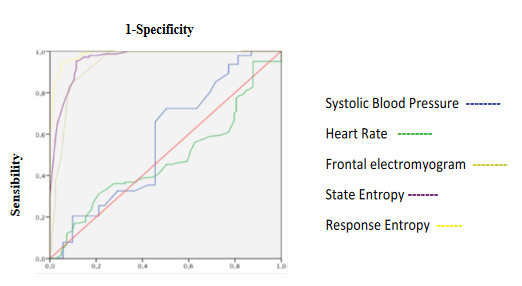
Figure 4: ROC curves of Systolic Blood Pressure, Heart Rate, Frontal Electromyogram and Entropy during laryngoscopy.
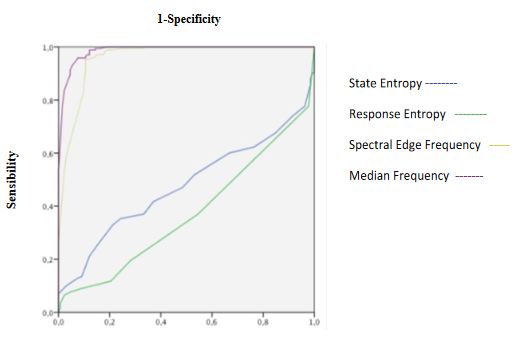
Figure 5: ROC curves of Entropy and Electroencephalographic variables during laryngoscopy.
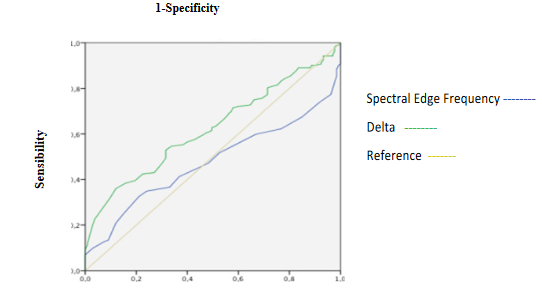
Figure 6: ROC curves of Electroencephalographic variables during laryngoscopy.
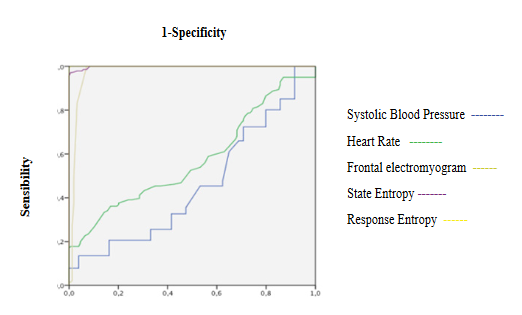
Figure 7: ROC curves of Systolic Blood Pressure, Heart Rate, Frontal Electromyogram and Entropy during maintenance
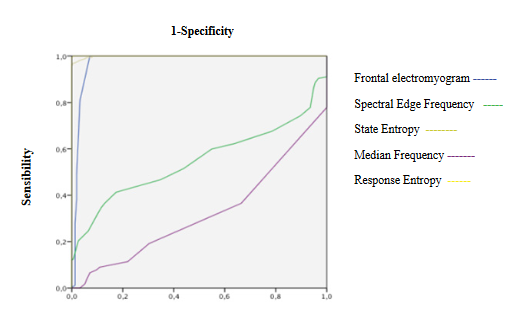
Figure 8: ROC curves of Entropy and Electroencephalographic variables during maintenance
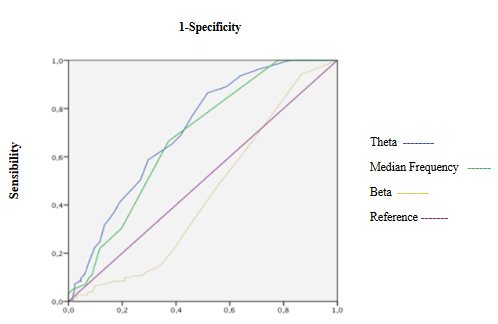
Figure 9: ROC curves of Electroencephalographic variables during maintenance.
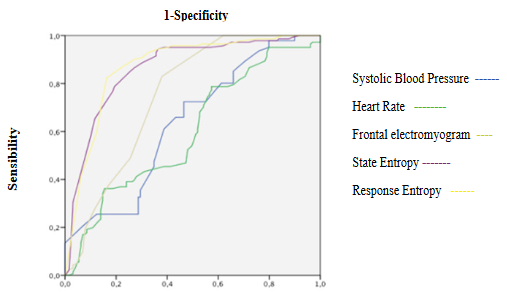
Figure 10: ROC curves of Systolic Blood Pressure, Heart Rate, Frontal Electromyogram and Entropy variables during emergence.
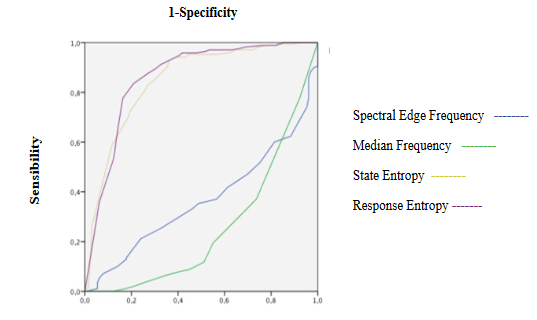
Figure 11: ROC curves of Entropy and Electroencephalographic variables during emergence
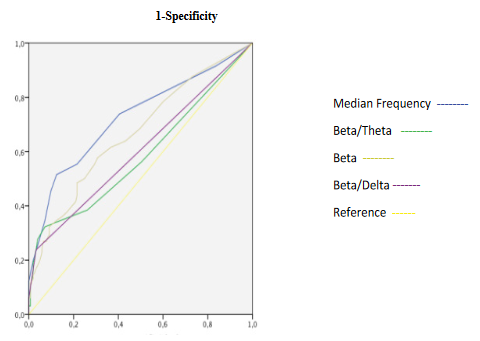
Figure 12: ROC curves of Electroencephalographic variables during emergence.
3.4 Correlation:
Correlations of entropy, SBP, HR, ETAC, qEEG and corrected variables from induction to emergence of general anesthesia were observed (Table 5, figures 13 to 17)
Table 5: Correlations of Entropy, Systolic Blood Pressure, Heart Rate, End-Tidal Anesthetic Concentration, Quantitative electroencephalogram and Corrected Variables from induction to emergence of anesthesia
|
INDUCTION |
LARYNGOSCOPY |
MAINTENANCE |
EMERGENCE |
|
|
Entropy, Quantitative Electroencephalogram and Corrected Variables |
SE-Beta r 0.714 p0.000 |
SE-Beta r 0.828 p0.000 |
SE-Beta r 0.784 p0.000 |
SE-Beta r0.305 p0.000 |
|
SE-Delta r-0.628 p 0.000 |
SE-Delta r -0.674 p0.000 |
SE-Delta r -0.671 p0.000 |
SE-Delta r0.015 p0.867 |
|
|
SE-Theta r0.489 p0.000 |
SE-Theta r 0.593 p0.000 |
SE-Theta r 0.193 p0.016 |
SE-Theta r-0.362 p0.000 |
|
|
SE-Alpha r0.542 p0.000 |
SE-Alpha r 0.458 p0.000 |
SE-Alpha r 0.619 p0.000 |
SE-Alpha r-0.183 p0.038 |
|
|
RE-Beta r 0.716 p 0.0000 |
RE-Beta r 0.818 p0.000 |
RE-Beta r0.774 p0.000 |
RE-Beta r0.033 p0.713 |
|
|
RE-Delta r -0.642 p 0.000 |
RE-Delta r -0.656 p0.000 |
RE-Delta r-0.649 p0.000 |
RE-Delta r0.247 p0.005 |
|
|
RE-Theta r 0.491 p0.0000 |
RE-Theta r 0.575 p0.000 |
RE-Theta r 0.171 p0.033 |
RE-Theta r-0.326 p0.000 |
|
|
RE-Alpha r 0.574 p0.0000 |
RE-Alpha r 0.442 p0.000 |
RE-Alpha r0.591 p0.000 |
RE-Alpha r-0.293 p0.001 |
|
|
SE-SEF r 0.636 p0.000 |
SE-SEF r 0.824 p0.000 |
SE-SEF r0.767 p0.000 |
SE-SEF r0.421 p0.000 |
|
|
SE-MF r 0.354 p0.000 |
SE-MF r 0.574 p0.000 |
SE-MF r0.540 p0.000 |
SE-MF r0.034 p0.706 |
|
|
SE-BcSEF r 0.548 p0.000 |
SE-BcSEF r 0.346 p0.000 |
SE-BcSEF r0.604 p0.000 |
SE-BcSEF R-0.228 p0.007 |
|
|
SE-B/T r 0.499 p0.000 |
SE-B/T r 0.439 p0.000 |
SE-B/T r0.462 p0.000 |
SE-B/T r0.383 p0.000 |
|
|
SE-B/D r 0.302 p0.000 |
SE-B/D r 0.245 p0.005 |
SE-B/D r.0.317 p0.000 |
SE-B/D r0.133 p0.133 |
|
|
RE-SEF r 0.659 p0.000 |
RE-SEF r 0.820 p0.000 |
RE-SEF r0.753 p0.000 |
RE-SEF r0.185 p0.036 |
|
|
RE-MF r 0.336 p0.000 |
RE-MF r 0.549 p0.000 |
RE-MF r0.526 p0.000 |
RE-MF r-0.180 p0.041 |
|
|
RE-BcSEF r 0.553 p0.000 |
RE-BcSEF r 0.326 p0.000 |
RE-BcSEF r0.589 p0.000 |
RE-BcSEF r-0.015 p0.865 |
|
|
RE-B/T r 0.482 p0.000 |
RE-B/T r 0.437 p0.000 |
RE-B/T r0.459 p0.000 |
RE-B/T r0.174 p0.050 |
|
|
RE-B/D r 0.305 p0.000 |
RE-B/D r 0.235 p0.000 |
RE-B/D r 0.314 p0.000 |
RE-B/D r-0.035 p0.694 |
|
|
Frontal Electromyogram, Entropy, Quantitative Electroencephalogram and Corrected Variables |
SE r -0.129 p0.157 |
SE r 0.129 p0.138 |
SE r0.305 p0.000 |
SE r0.264 p0.003 |
|
RE r -0.106 p0.244 |
RE r 0.138 p0.113 |
RE r0.299 p0.000 |
RE r0.576 p0.000 |
|
|
Beta r 0.021 p 0.825 |
Beta r 0.042 p 0.627 |
Beta r 0.230 p 0.004 |
Beta r -0.190 p 0.030 |
|
|
Alpha r 0.191 p 0.038 |
Alpha r 0.011 p 0.899 |
Alpha r 0.097 p 0.228 |
Alpha r -0.312 p 0.000 |
|
|
Theta r 0.061 p 0.514 |
Theta r 0.107 p 0.221 |
Theta r 0.122 p 0.132 |
Theta r -0.108 p 0.219 |
|
|
Delta r -0.109 p 0.240 |
Delta r -0.045 p 0.606 |
Delta r -0.163 p 0.042 |
Delta r 0.339 p 0.000 |
|
|
BcSEF r 0.074 p 0.416 |
BcSEF r 0.021 p 0.807 |
BcSEF r 0.223 p 0.005 |
BcSEF 0.368 p 0.000 |
|
|
B/T r -0.014 p 0.884 |
B/T r -0.130 p 0.135 |
B/T r 0.131 p 0.105 |
B/T r -0.067 p 0.449 |
|
|
B/D r 0.074 p 0.426 |
B/D r -0.115 p 0.189 |
B/D r -0.055 p 0.493 |
B/D r -0.221 p 0.011 |
|
|
Quantitative Electroencephalogram and Corrected Variables |
Beta-Delta r -0.814 p0.000 |
Beta-Delta r-0.845 p 0.000 |
Beta-Delta r-0.833 p0.000 |
Beta-Delta r-0.647 p0.000 |
|
Beta-Alpha r 0.711 p0.000 |
Beta-Alpha r 0.695 p0.000 |
Beta-Alpha r 0.758 p0.000 |
Beta-Alpha r0.276 p0.001 |
|
|
Beta-Theta r 0.611 p0.000 |
Beta-Theta r 0.651 p0.000 |
Beta-Theta r 0.329 p0.000 |
Beta-Theta r-0.220 p0.012 |
|
|
Alpha-Delta r -0.933 p0.000 |
Alpha-Delta r-0.886 p0.000 |
Alpha-Delta r-0.931 p0.000 |
Alpha-Delta r-0.824 p0.000 |
|
|
Alpha-Theta r -0.701 p0.000 |
Alpha-Theta r0.613 p0.000 |
Alpha-Theta r 0.389 p0.000 |
Alpha-Theta r0.463 p0.000 |
|
|
Delta-Theta r -0.869 p0.000 |
Delta-Theta r-0.840 p0.000 |
Delta-Theta r-0.588 p0.000 |
Delta-Theta r-0.374 p0.000 |
|
|
Beta-SEF r 0.862 p0.000 |
Beta-SEF r 0.953 p0.000 |
Beta-SEF r0.951 p0.000 |
Beta-SEF r0.918 p0.000 |
|
|
Beta-MF r 0.461 p0.000 |
Beta-MF r 0.725 p0.000 |
Beta-MF r0.707 p0.000 |
Beta-MF r0.649 p0.000 |
|
|
Alpha-SEF r 0.943 p0.000 |
Alpha-SEF r 0.710 p0.000 |
Alpha-SEF r0.847 p0.000 |
Alpha-SEF r0.244 p0.005 |
|
|
Alpha-MF r 0.460 p0.000 |
Alpha-MF r 0.703 p0.000 |
Alpha-MF r 0.744 p0.000 |
Alpha-MF r0.754 p0.000 |
|
|
Delta-SEF r -0.952 p0.000 |
Delta-SEF r-0.856 p0.000 |
Delta-SEF r-0.888 p0.000 |
Delta-SEF r-0.577 p0.000 |
|
|
Delta-MF r -0.542 p0.000 |
Delta-MF r-0.863 p0.000 |
Delta-MF r-0.855 p0.000 |
Delta-MF r-0.941 p0.000 |
|
|
Theta-SEF r 0.763 p0.000 |
Theta-SEF r0.661 p0.000 |
Theta-SEF r0.379 p0.000 |
Theta-SEF r-0.151 p0.084 |
|
|
Theta-MF r 0.539 p0.000 |
Theta-MF r0.770 p0.000 |
Theta-MF r0.531 p0.000 |
Theta-MF r0.266 p0.002 |
|
|
Beta-BcSEF r 0.851 p0.000 |
Beta-BcSEF r0.562 p0.000 |
Beta-BcSEF r0.950 p0.000 |
Beta-BcSEF r0.052 p0.558 |
|
|
Beta-B/T r 0.655 p0.000 |
Beta-B/T r0.542 p0.000 |
Beta-B/T r0.534 p0.000 |
Beta-B/T r0.851 p0.000 |
|
|
Beta-B/D r 0.324 p0.000 |
Beta-B/D r0.329 p0.000 |
Beta-B/D r0.340 p0.000 |
Beta-B/D r0.712 p0.000 |
|
|
Alpha-BcSEF r0.941 p0.000 |
Alpha-BcSEF r0.702 p0.000 |
Alpha-BcSEF r0.848 p0.000 |
Alpha-BcSEF r0.027 p0.758 |
|
|
Alpha-B/D r 0.316 p0.000 |
Alpha-B/D r0.217 p0.012 |
Alpha-B/D r0.312 p0.000 |
Alpha-B/D r0.174 p0.047 |
|
|
Alpha-B/T r 0.447 p0.000 |
Alpha-B/T r0.230 p0.008 |
Alpha-B/T 0.441 p0.000 |
Alpha-B/T r0.017 p0.844 |
|
|
Delta-BcSEF r-0.938 p0.000 |
Delta-BcSEF r0.561 p0.000 |
Delta-BcSEF r-0.890 p0.000 |
Delta-BcSEF r-0.040 p0.651 |
|
|
Delta-B/T r-0.418 p0.000 |
Delta-B/T r-0.243 p0.000 |
Delta-B/T r-0.400 p0.000 |
Delta-B/T r-0.306 p0.000 |
|
|
Delta-B/D r -0.314 p0.001 |
Delta-B/D r-0.332 p0.000 |
Delta-B/D r-0.334 p0.000 |
Delta-B/D r-0.557 p0.000 |
|
|
Theta-BcSEF r 0.737 p0.000 |
Theta-BcSEF r0.342 p0.000 |
Theta-BcSEF r0.381 p0.000 |
Theta-BcSEF r0.190 p0.030 |
|
|
Theta-B/T r 0.082 p 0.388 |
Theta-B/T r-0.075 p0.394 |
Theta-B/T r-0.329 p0.000 |
Theta-B/T r-0.603 p0.000 |
|
|
Theta-B/D r 0.278 p0.000 |
Theta-B/D r0.104 p0.235 |
Theta-B/D r-0.116 p0.149 |
Theta-B/D r-0.149 p0.090 |
|
|
Hemodynamic variables (SBP and HR), Entropy, Quantitative Electroencephalogram, Frontal Electromyogram, Corrected Variables and End-Tidal Anesthetic Concentration |
SBP-HR r 0.021 p0.831 |
SBP-HR: r 0.106 p 0.226 |
SBP-HR: r 0.376 p 0.000 |
SBP-HR: r 0.469 p 0.000 |
|
SBP-SE: r 0.197 p0.031 |
SBP-SE: r 0.149 p 0.079 |
SBP-SE: r 0.067 p 0.399 |
SBP-SE: r 0.009 p 0.913 |
|
|
SBP-RE: r 0.122 p0.186 |
SBP-RE: r 0.159 p 0.061 |
SBP-RE: r 0.072 p 0.363 |
SBP-RE: r 0.031 p 0.715 |
|
|
SBP-Beta: r 0.096 p0.320 |
SBP-Beta: r 0.018 p 0.835 |
SBP-Beta: r -0.123 p 0.130 |
SBP-Beta: r -0.256 p 0.003 |
|
|
SBP-Alpha: r -0.157 p0.101 |
SBP-Alpha: r -0.131 p 0.133 |
SBP-Alpha: r -0.338 p 0.000 |
SBP-Alpha: r -0.256 p 0.003 |
|
|
SBP-Theta: r -0.173 p0.071 |
SBP-Theta: r 0.059 p 0.500 |
SBP-Theta: r 0.228 p 0.005 |
SBP-Theta: r 0.048 p 0.583 |
|
|
SBP-Delta: r 0.084 p0.381 |
SBP-Delta: r 0.021 p 0.814 |
SBP-Delta: r 0.193 p 0.016 |
SBP-Delta: r 0.232 p 0.008 |
|
|
SBP-SEF: r -0.037 p0.701 |
SBP-SEF: r -0.025 p 0.771 |
SBP-SEF: r -0.216 p 0.007 |
SBP-SEF: r -0.224 p 0.010 |
|
|
SBP-MF: r 0.047 p0.624 |
SBP-MF: r 0.026 p 0.765 |
SBP-MF: r -0.025 p 0.755 |
SBP-MF: r -0.208 p 0.017 |
|
|
SBP-fEMG: r -0.381 p0.000 |
SBP-fEMG: r 0.010 p 0.909 |
SBP-fEMG: r 0.012 p 0.880 |
SBP-fEMG: r -0.166 p 0.059 |
|
|
SBP-BcSEF: r -0.075 p0.413 |
SBP-BcSEF: r-0.187 p 0.026 |
SBP-BcSEF: r -0.210 p 0.008 |
SBP-BcSEF: r -0.223 p 0.008 |
|
|
SBP-B/T: r 0.312 p0.001 |
SBP-B/T: r 0.108 p 0.214 |
SBP-B/T: r -0.438 p 0.000 |
SBP-B/T: r -0.225 p 0.010 |
|
|
SBP-B/D: r -0.064 p0.504 |
SBP-B/D: r 0.015 p 0.864 |
SBP-B/D: r -0.208 p 0.010 |
SBP-B/D: r 0.017 p 0.843 |
|
|
SBP-ETAC: r -0.345 p 0.000 |
SBP-ETAC: r 0.055 p 0.514 |
SBP-ETAC: r -0.089 p 0.263 |
SBP-ETAC: r -0.078 p 0.361 |
|
|
HR-SBP: r 0.021 p0.831 |
HR-SBP: r 0.106 p 0.226 |
HR-SBP: r 0.376 p 0.000 |
HR-SBP: r 0.469 p 0.000 |
|
|
HR-SE: r -0.157 p0.114 |
HR-SE: r 0.304 p 0.000 |
HR-SE: r -0.46 p 0.557 |
HR-SE: r 0.041 p 0.638 |
|
|
HR-RE: r -0.202 p0.041 |
HR-RE: r 0.288 p 0.001 |
HR-RE: r -0.036 p 0.651 |
HR-RE: r 0.145 p 0.091 |
|
|
HR-Beta: r -0.342 p0.001 |
HR-Beta: r 0.206 p 0.022 |
HR-Beta: r -0.104 p 0.200 |
HR-Beta: r -0.404 p 0.000 |
|
|
HR-Alpha: r -0.351 p0.001 |
HR-Alpha: r 0.014 p 0.877 |
HR-Alpha: r 0.035 p 0.661 |
HR-Alpha: r -0.373 p 0.000 |
|
|
HR-Theta: r 0.063 p0.548 |
HR-Theta: r 0.296 p 0.001 |
HR-Theta: r 0.283 p 0.000 |
HR-Theta: r 0.091 p 0.304 |
|
|
HR-Delta: r 0.228 p0.029 |
HR-Delta: r -0.159 p 0.080 |
HR-Delta: r -0.110 p 0.173 |
HR-Delta: r 0.418 p 0.000 |
|
|
HR-SEF: r 0.266 p0.010 |
HR-SEF: r 0.171 p 0.058 |
HR-SEF: r -0.140 p 0.082 |
HR-SEF: r -0.342 p 0.000 |
|
|
HR-MF: r 0.097 p0.358 |
HR-MF: r 0.200 p 0.027 |
HR-MF: r 0.221 p 0.006 |
HR-MF: r -0.405 p 0.000 |
|
|
HR-fEMG: r -0.149 p0.149 |
HR-fEMG: r 0.039 p 0.667 |
HR-fEMG: r -0.243 p 0.002 |
HR-fEMG: r 0.151 p 0.085 |
|
|
HR-BcSEF: r -0.137 p0.170 |
HR-BcSEF: r -0.030 p 0.731 |
HR-BcSEF: r -0.131 p 0.096 |
HR-BcSEF: r 0.122 p 0.154 |
|
|
HR-B/T: r -0.433 p0.000 |
HR-B/T: r -0.013 p 0.890 |
HR-B/T: r -0.242 p 0.002 |
HR-B/T: r -0.310 p 0.000 |
|
|
HR-B/D: r -0.149 p0.157 |
HR-B/D: r -0.088 p 0.334 |
HR-B/D: r -0.049 p 0.543 |
HR-B/D: r -0.174 p 0.047 |
|
|
HR-ETAC: r 0.253 p0.010 |
HR-ETAC: r 0.126 p 0.150 |
HR-ETAC: r 0.108 p 0.172 |
HR-ETAC: r 0.136 p 0.109 |
|
|
End-Tidal Anesthetic Concentration, Hemodynamic variables (SBP and HR), Entropy, Quantitative Electroencephalogram, Frontal Electromyogram and Corrected Variables. |
ETAC-SBP: r -0.345 p0.000 |
ETAC-SBP: r 0.055 p 0.514 |
ETAC-SBP: r -0.089 p 0.263 |
ETAC-SBP: r -0.078 p 0.361 |
|
ETAC-HR: r 0.253 p0.010 |
ETAC-HR: r 0.126 p 0.150 |
ETAC-HR: r 0.108 p 0.172 |
ETAC-HR: r 0.136 p 0.109 |
|
|
ETAC-SE: r -0.220 p0.013 |
ETAC-SE: r -0.346 p 0.000 |
ETAC-SE: r -0.210 p 0.007 |
ETAC-SE: r -0.372 p 0.000 |
|
|
ETAC-RE: r -0.220 p0.013 |
ETAC-RE: r -0.358 p 0.000 |
ETAC-RE: r -0.197 p 0.012 |
ETAC-RE: r -0.309 p 0.000 |
|
|
ETAC-Beta: r -0.163 p0.077 |
ETAC-Beta: r -0.354 p 0.000 |
ETAC-Beta: r -0.237 p 0.003 |
ETAC-Beta: r -0.229 p 0.009 |
|
|
ETAC-Alpha: r 0.148 p0.109 |
ETAC-Alpha: r -0.178 p 0.040 |
ETAC-Alpha: r -0.316 p 0.000 |
ETAC-Alpha: r -0.009 p 0.921 |
|
|
ETAC-Theta: r 0.041 p0.656 |
ETAC-Theta: r -0.057 p 0.512 |
ETAC-Theta: r -0.187 p 0.020 |
ETAC-Theta: r 0.272 p 0.002 |
|
|
ETAC-Delta: r -0.065 p0.481 |
ETAC-Delta: r 0.208 p 0.010 |
ETAC-Delta: r 0.280 p 0.000 |
ETAC-Delta: r 0.085 p 0.336 |
|
|
ETAC-SEF: r 0.030 p0.746 |
ETAC-SEF: r -0.410 p 0.000 |
ETAC-SEF: r -0.327 p 0.000 |
ETAC-SEF: r -0.243 p 0.005 |
|
|
ETAC-MF: r -0.097 p0.298 |
ETAC-MF: r -0.260 p 0.003 |
ETAC-MF: r -0.030 p 0.714 |
ETAC-MF: r -0.077 p 0.383 |
|
|
ETAC-fEMG: r 0.403 p0.000 |
ETAC-fEMG: r -0.108 p 0.215 |
ETAC-fEMG: r -0.060 p 0.460 |
ETAC-fEMG: r -0.015 p 0.869 |
|
|
ETAC-BcSEF: r 0.090 p0.315 |
ETAC-BcSEF: r -0.170 p 0.044 |
ETAC-BcSEF: r -0.378 p 0.000 |
ETAC-BcSEF: r 0.144 p 0.091 |
|
|
ETAC-B/T: r -0.156 p0.099 |
ETAC-B/T: r -0.295 p 0.001 |
ETAC-B/T: r-0.043 p 0.591 |
ETAC-B/T: r -0.283 p 0.001 |
|
|
ETAC-B/D: r -0.047 p0.613 |
ETAC-B/D: r -0.096 p 0.273 |
ETAC-B/D: r 0.080 p 0.325 |
ETAC-B/D: r -0.147 p 0.093 |
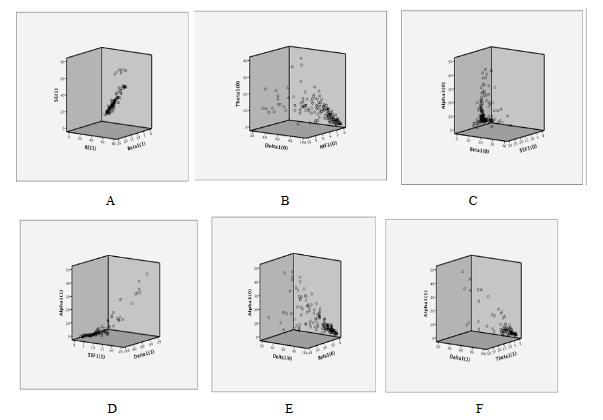
Figure 13: Correlations during induction A.-Entropy and beta activity. B.-Median Frequency, delta and theta activity. C.-Spectral Edge Frequency, alpha and beta activity. D.-Spectral Edge Frequency, alpha and delta activity. E.-Alpha, beta and delta activity. F.-Alpha, theta and delta activity
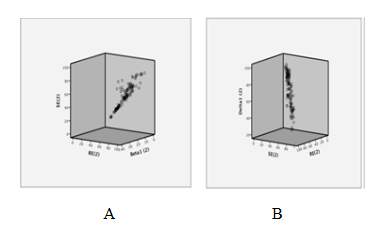
Figure 14: Correlations during laringoscopy A.-Entropy and beta activity B.-Entropy and delta activity.
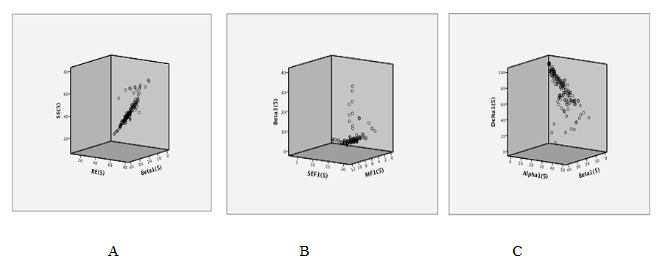
Figure 15: Correlations during maintenance A.-Entropy and beta activity B.-Spectral Edge Frequency, Median Frequency and beta activity C.-Alpha, beta and delta activity
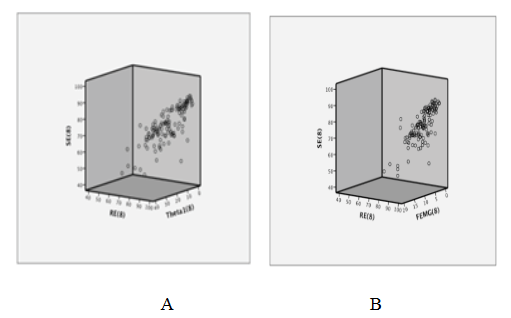
Figure 16: Correlations during emergence A.-Entropy and theta activity. B.-Entropy and frontal electromyogram
3.4 Combined analysis of entropy, qEEG, corrected variables, ETAC and hemodynamic variables
Induction:
SE and RE decreasing showed an excellent discrimination capacity of hypnosis state and acceptable correlation with beta waves (Table 3, 4 and 5, Figure 1, 2 and 13A). fEMG decreasing showed an excellent discrimination capacity of hypnosis state without significant correlation with qEEG (Table 3, 4 and 5, Figure 1). qEEG showed a decrease of rapid and medium activity along with a slow waves increased leading to a higher amplitude and decrease of SEF (Table 3), but discrimination capacity was excellent only for amplitude (Table 4, Figure 2 and 3). Fast, medium and slow waves showed a good correlation between them and with SEF (Table 5, Figure 13 C,D,E and F), but correlations with MF was weak (Figure 13 B). BcSEF and B/T significantly decreased but only B/D showed an acceptable capacity for hypnosis depth discrimination (Table 3 and 4). BcSEF showed a good correlation with fast, medium and slow waves (Table 5). ETAC significantly increases but not showed an adequate capacity to hypnosis state prediction nor correlated with qEEG or corrected variables (Table 3,4 and 5). SBP significantly decrease and showing an acceptable discrimination of hypnosis depth but not correlating with entropy, qEEG, corrected variables and ETAC (Table 3, 4 and 5, Figure 1). HR not changed and showing a poor discrimination capacity not correlating with entropy, qEEG, corrected variables and ETAC (Table 3, 4 and 5, Figure 1).
Laryngoscopy:
SE and RE increasing showed excellent discrimination capacity of hypnosis depth and a higher correlation with beta activity and SEF (Table 3, 4 and 5. Figure 4, 5, 14A and B). fEMG not significantly changed but showed excellent capacity for deep of hypnosis monitoring without significant correlation with entropy and qEEG (Table 3, 4 and 5, Figure 4). Alpha, beta, theta, SEF and MF increasing with a decrease of delta and less amplitude of qEEG was seen during this phase (Table 3), but discrimination capacity of hypnosis state was only acceptable for amplitude (Table 4, Figure 5 and 6). A good correlation between delta with beta, alpha and theta was seen (Table 5). Beta, alpha and delta had a good correlation with SEF and MF, but theta only showed acceptable correlation with MF (Table 5). BcSEF significantly increases only presenting acceptable correlation with alpha activity (Table 3 and 5) with a poor discrimination capacity of hypnosis depth (Table 4). ETAC significantly increases showing an excellent capacity for hypnosis state discrimination without correlating with entropy, qEEG and corrected variables (Table 3, 4 and 5). SBP and HR significantly increases but showed a poor discrimination of hypnosis depth not correlating with entropy, qEEG, corrected variables and ETAC (Table 3, 4 and 5, Figure 4).
Maintenance:
SE and RE increases significantly but showing values reflecting an adequate hypnosis level (40 to 60) presenting an excellent discrimination capacity of hypnosis depth and a good correlation with beta activity and SEF (Table 3, 4 and 5, Figure 7, 8 and 15A). fEMG not significantly changed and showed an excellent discrimination capacity for hypnosis monitoring without significant correlation with entropy and qEEG (Table 3, 4 and 5, Figure 7 and 8). qEEG showed a significant decrease of delta waves and increase of alpha and theta activity without significant changes of beta waves, causing a decrease of EEG amplitude and increasing SEF and MF (Table 3). A good correlation between beta with alpha and delta waves, alpha with delta and beta activity, alpha, beta and delta waves with SEF and MF were seen (Table 5, Figure 15 B and C). Only qEEG amplitude and theta activity showed an acceptable discrimination capacity of hypnosis level (Table 4, Figure 8 and 9). BcSEF significantly decreased showing a good discrimination capacity of hypnosis depth and excellent correlation with beta, alpha and delta waves (Table 3, 4 and 5). B/T not significantly changed and showed an acceptable discrimination capacity for hypnosis monitoring (Table 3 and 4). ETAC not significantly changed and showed an excellent discrimination capacity without correlations with entropy, qEEG and corrected variables (Table 3, 4 and 5). SBP and HR significantly decreases but showed a poor discrimination capacity of hypnosis level without correlating with entropy, qEEG, corrected variables and ETAC (Table 3, 4 and 5, Figure 7).
Emergence:
SE and RE significantly increases showing an excellent discrimination capacity of hypnosis state without correlating with fEMG and qEEG (Table 3, 4 and 5, Figure 10, 11, 16A and B). fEMG significantly increasing showed an acceptable discrimination capacity of hypnosis depth without correlating with entropy and qEEG (Table 3, 4 and 5, Figure 10 and 16B). qEEG showed an increase of delta and beta waves and decrease of alpha and theta activity, causing a decrease of amplitude and MF and increase of SEF (Table 3). A good correlation between alpha and delta activity, SEF with beta and MF with alpha and delta waves were seen (Table 5). Delta activity and MF showed a good discrimination capacity of hypnosis state (Table 4, Figure 12). BcSEF significantly decreased and showed a poor discrimination capacity of hypnosis depth (Table 3 and 4). B/D showed no significant changes but an acceptable discrimination of hypnosis state (Table 3 and 4, Figure 12). Good correlations between beta activity with B/D and B/T was seen (Table 5). ETAC significantly decreases showing an excellent capacity for hypnosis monitoring without correlations with entropy, qEEG and corrected variables (Table 3, 4 and 5). SBP and HR significantly increases showing a poor discrimination capacity without correlating with entropy, qEEG, corrected variables and ETAC (Table 3, 4 and 5, Figure 10).
3.5 Linear Regression Analysis:
ETAC variability:
A linear regression analysis was performed to determine if entropy could explain ETAC variability.
ETAC=1.555 - (0.13) SE R2: 0.183 (p‹ 0.001)
ETAC=1.569 -(0.13) RE R2: 0.213 (p‹ 0.001)
Entropy variability:
A linear regression analysis was performed to determine entropy variability explained for ETAC and qEEG.
SE=72.315 - 3.63 (ETAC) + 3.501 (fEMG) + 0.36 BSR - 0.34 Delta - 0.44 Theta R2: 0.532 p‹0.001
RE=73.586 -5.127 (ETAC)+4.524 (fEMG)+0.398 BSR - 0.319 Delta - 0.386 Theta R2: 0.540 p‹0.001
Linear regression showed that ETAC variability was poorly explained for entropy. Entropy variability was explained in half of cases for ETAC, BSR, delta and theta activity.
3.6 Prediction of Hypnosis Depth Equation
A logistic regression analysis was used for hypnosis depth (awake versus sleep) prediction equation using entropy and qEEG.

This model explains 81.8% of the variability of the clinical variable awake or sleep.
ROC of this model showed an Area Under Curve (AUC) of 0.999 (p‹0.001) which means that this equation could correctly predicts 99% of the time clinical status as awake or sleep (Figure 18).
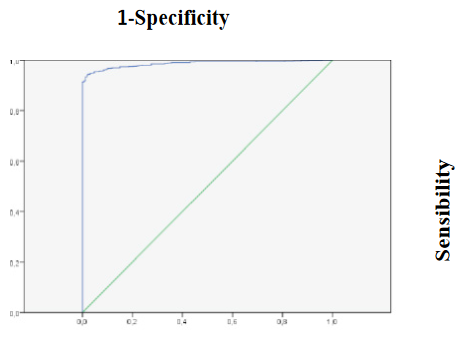
Figure 17: ROC curve of hypnosis depth prediction equation
Logistic regression showed that delta and theta activity, fEMG and RE could predict 81% of hypnosis state variability and 99% of the time could correctly predict hypnosis state.
4. Conclusion
This study aims to describe a prediction equation for deep of hypnosis monitoring during general volatile anesthesia with sevoflurane. Our patients were a typical population without significant neurologic diseases, medium age with a situation of normotension and normotermia to avoid possible confounder factors interfering with deep of hypnosis monitoring accuracy using entropy and qEEG.
Several factors related to design must be highlighted. Prospective, single group and observational design in young patients under general anesthesia of short duration probably make possible to describe in a real theater the changes of hypnosis depth resulting of induction, laryngoscopy, maintenance and emergence. Nociceptive stimulation influence for deep of hypnosis monitoring is controversial and was observed in this study during laryngoscopy, classically described as one of the highest pain stimuli during general anesthesia. Effects of neuromuscular paralysis resulting of administration of NMBA during induction to make oro-traqueal intubation easier in accordance to universal recommendations probably resulted in a lack of frontal muscles contraction and fEMG reduction likely influencing deep of hypnosis monitoring.
Entropy, qEEG and ETAC showed expected changes during induction, laringoscopy, maintenance and emergence of general anesthesia. Entropy and qEEG reflected significant changes, increasing hypnosis depth during induction followed for classical awareness probably because of intense nociceptive stimulation of laryngoscopy, increasing of intermediate activity resulted of moderate surgical stimulation during maintenance and fast activity in emergence when anesthesia agents were withdrawal. Entropy showed an excellent discrimination capacity during all anesthesia phases. An acceptable discrimination capacity of qEEG intermediate theta activity during maintenance and slow delta activity in emergence were interesting findings of this study not previously published as far as we know. Significant correlations between entropy with qEEG fast activity from induction to maintenance is another interesting finding of our study, probably indicating that fast activity decreasing as hypnosis deepens according to gold standard qEEG could be reflected for a faster monitoring with entropy, as evidence has been previously showed (18). ETAC showed significant changes during induction, laryngoscopy and emergence as a result of our study protocol including volatile anesthetic administration immediately after oro-traqueal intubation. ETAC had a higher discrimination capacity from laryngoscopy to maintenance, and linear regression analysis showed that entropy does not influence variability of ETAC, probably indicating that entropy and ETAC should be complementary deep of hypnosis monitoring during balanced general anesthesia with volatile hypnotic agent.
Corrected variables could have advantages for deep of hypnosis monitoring reflecting balance between fast and slow activity. In this study, BcSEF showed significant changes from induction to emergence of general anesthesia indicating hypnosis deepens during induction followed for a light anesthesia in laryngoscopy probably because of classic awake and a deep hypnosis level during maintenance probably because of effects of volatile anesthesia increasing BSR and decreasing SEF and paradoxically during emergence when anesthesia agent was withdrawal, but discrimination capacity was acceptable only in maintenance time. B/T reflected a higher hypnosis depth during induction probably resulting of beta activity decreased and theta waves increased because effects of intravenous propofol, followed for a lower hypnosis level only significant during emergence because increasing of beta waves and decreasing of theta activity secondary to hypnotic agent withdrawal, but discrimination capacity was only acceptable during maintenance probably reflecting a lower hypnosis level because of surgical stimulation during this time. B/D not significantly changed from induction to emergence probably resulting of a balance between beta and delta activity during these phases, but discrimination capacity was acceptable in induction and emergence probably indicating the importance of beta and delta activity for deep of hypnosis monitoring especially during induction and emergence. Acceptable discrimination capacity of BcSEF and B/T during maintenance and B/D during induction and emergence were interesting findings of our study not published as far as we know, probably useful for deep of hypnosis monitoring improvement.
fEMG is a source of interference for deep of hypnosis monitoring as evidence had showed [10]. In this study, fEMG significantly decrease during induction because of a lack of frontal neuromuscular activity resulting of action of NMBA administered in this phase for endotraqueal intubation facilitation in laryngoscopy time. fEMG increases during emergence because a frontal neuromuscular activity recovery at the end of surgical procedure to achieve awake and a safe extubation. A very interesting findings of our study were an excellent discrimination capacity of deep of hypnosis state of fEMG from induction to maintenance, decreasing but being good during emergence time and a contribution of fEMG for clinical status of awake vs sleep prediction according to our equation. A lack of correlation with SE and RE along with a lower capacity of fEMG to explained variability of SE and RE according to linear regression in this study was very interesting also, not expected because entropy algorithm includes fEMG band in RE value.
Hemodynamic variables influence for deep of hypnosis monitoring are controversial. In this study, SBP significantly decrease during induction probably because of propofol administration and maintenance resulting of moderate surgical stimulation balanced for effects of volatile anesthetics along with opioids according to anesthesiologist in charge decision without influence of deep of hypnosis monitoring using EEG variables. SBP and HR significantly increased in laryngoscopy and emergence probably because of higher nociceptive stimulation of sympathetic system during these phases. SBP showed only an acceptable discrimination capacity during induction without showed significant correlations with entropy and EEG variables. HR not significantly changed during induction probably resulting of a lack of reflex tachycardia after regular doses of propofol given according to study protocol reflecting our current hospital practice. HR significantly decreased during maintenance probably because of moderate surgical stimulation under effects of volatile and opioid drugs. HR showed a poor discrimination capacity in all phases without correlating with entropy and EEG variables. These results taken together seems to indicate that SBP and HR showed effects of nociceptive stimulation during laryngoscopy and emergence, but its poor discrimination capacity of hypnosis level make these variables not useful for deep of hypnosis monitoring improvement.
Variables influencing changes of entropy and ETAC during general anesthesia in this study should reflect potentially tools for deep of hypnosis monitoring improvement. fEMG and ETAC influence for entropy monitoring has been described earlier [2,4-17], but in this study interestingly nor fEMG or ETAC could explained variability of entropy values. EGG slow and intermediate activity could indicate transition to a deeper hypnosis level but are less important for entropy monitoring algorithm according to our results and previously published papers [2,4-17]. In present study ETAC variability was not explained for entropy unlike evidence had showed earlier [2]. We analyzed prediction capacity of hypnosis state of entropy and variables that showed a poor prediction capacity of entropy variability also with a limited value for deep of hypnosis monitoring in our days. Combination of RE, fEMG, delta and theta activity showed an excellent discrimination capacity of hypnosis state in present study. This was a very interesting finding of our study not published as far as we know that reflects the importance of include fast, intermediate and slow activity for deep of hypnosis monitoring improving.
This study has limitations because its little size and single group of female young patients under short anesthesia for scheduled gynecology procedures. For this reason, our results needs to further confirmation for larger studies.
In conclusion, this study showed that entropy had an excellent discrimination capacity of hypnosis state from induction to emergence of general anesthesia. Corrected EEG variables B/D during induction and emergence or BcSEF and B/T during maintenance reflecting balance between slow and fast activity showed a good discrimination capacity with potential for deep of hypnosis monitoring improvement. Combination of fEMG, RE, delta and theta activities showed an excellent discrimination capacity of hypnosis state highlighting the importance of include fast, intermediate and slow activity for a more accurate deep of hypnosis monitoring during general anesthesia. Our interesting findings needs further investigation in larger studies to assess performance of EEG corrected variables, entropy and EEG fast, slow and intermediate activity for deep of hypnosis monitoring improvement.
References:
- Klein AA, Meek T, Allcock E, et al. Recommendations for standards of monitoring during anaesthesia and recovery 2021. Guideline from the Association of Anaesthetists. Anaesthesia 76 (2021): 1212-1223.
- Ellerkmann RK, Liermann VM, Alves TM, et al. Spectral Entropy and Bispectral Index as Measures of the Electroencephalographic Effects of Sevoflurane. Anesthesiology 101 (2004): 1275-1282.
- El Hor T, Van Der Linden P, De Hert S, et al. Impact of Entropy Monitoring on Volatile Anesthetic Uptake. Anesthesiology 118 (2013): 68-73.
- Schmidt GN, Bischoff P, Standl T, et al. Comparative evaluation of the Datex-Ohmeda S/5 entropy module and the bispectral index monitor during propofol-remifentanil anesthesia. Anesthesiology 101 (2004): 1283-90.
- Aho AJ, Lyytikainen LP, Yli-Hankala A, et al. Explaining Entropy responses after a noxious stimulus, with or without neuromuscular blocking agents, by means of the raw electroencephalographic and electromyographic characteristics. British Journal of Anaesthesia 106 (2011): 69-76.
- Takamatsu I, Ozaki M, Kazama T. Entropy indices vs the bispectral index TM for estimating nociception during sevoflurane anaesthesia. British Journal of Anaesthesia 96 (2006): 620-6.
- Aho A.J, Yli-Hankala A, Lyytikäinen L-P, et al. Can electromyographic arousal be detected visually on the Datex-Ohmeda S/5TM Anesthesia Monitor? Acta Anaesthesiol Scand 57 (2013): 364-72.
- Baulig W, Seifert B, Schmid E, et al. Comparison of Spectral Entropy and Bispectral Index Electroencephalography in Coronary Artery Bypass Graft Surgery. Journal of Cardiothoracic and Vascular Anesthesia 24 (2010): 544-49.
- Musialowicz T, Lahtinen P, Pitkanen O, et al. Comparison of spectral entropy and BIS Vista monitor during general anesthesia for cardiac surgery. Journal of Clinical Monitoring and Computing 25 (2011): 95-103.
- Viertio-Oja H, Maja V, Sarkela M, et al. Description of the Entropy algorithm as applied in the Datex-Ohmeda S ⁄ 5 Entropy Module. Acta Anaesthesiologica Scandinavica 48 (2004): 154-61.
- -Gruenewald M, Zhou J, Schloemerkemper N, et al. M-Entropy guidance vs standard practice during propofol-remifentanil anaesthesia: a randomised controlled trial. Anaesthesia 2007; 62:1224-9. DOI: 10.1111/j.1365-2044.2007.05252.x
- Ellerkmann RK, Soehle M, Alves TM, et al. Spectral Entropy and Bispectral Index as Measures of the Electroencephalographic Effects of Propofol. Anesthesia and Analgesia 102 (2006): 1456-62.
- Meybohm P M, Gruenewald M, Hocker J, et al. Correlation and agreement between the bispectral index vs. state entropy during hypothermic cardio-pulmonary bypass. Acta Anaesthesiol Scand 54 (2010): 169-75.
- Iannuzzi M, Iannuzzi E, Rossi F, et al. Relationship between bispectral index, electro -encephalographic state entropy and effect-site EC50 for propofol at different clinical endpoints. Br J Anaesth 95 (2005): 117-24.
- Anderson RE, Barr G, Owall A, et al. Entropy during propofol hypnosis, including an episode of wakefulness. Anaesthesia 59 (2004): 721-2
- Gruenewald M, Ilies C. Monitoring the nociception-anti-nociception balance. Best Practice & Research Clinical Anaesthesiology 27 (2013): 235-47.
- Lysakowski C, Elia N, Czarnetzki C, et al. Bispectral and spectral entropy indices at propofol-induced loss of consciousness in young and elderly patients. British Journal of Anaesthesia 103 (2009): 387-393.
- Vakkuri A, Yli-Hankala A, Talja P, et al. Time-frequency balanced spectral entropy as a measure of anesthetic drug effect in central nervous system during sevoflurane, propofol, and thiopental anesthesia. Acta Anaesthesiol Scand 48 (2004): 145-53.
- Wu S-C, Wang P-C, Liao W-T, et al. Use of Spectral Entropy Monitoring in Reducing the Quantity of Sevoflurane as Sole Inhalational Anesthetic and in Decreasing the Need for Antihypertensive Drugs in Total Knee Replacement Surgery. Acta Anaesthesiol Taiwan 46 (2008): 106−11.
- Riad W, Schreiber M, Saeed AB. Monitoring with EEG entropy decreases propofol requirement and maintains cardiovascular stability during induction of anaesthesia in elderly patients. Eur J Anaesthesiol 24 (2007):684−8.
- Chhabra A, Subramaniam R, Srivastava A, et al. Spectral entropy monitoring for adults and children undergoing general anaesthesia. Cochrane Database of Systematic Reviews 3 (2016).
- Gibbs FA, Gibbs EL, LennoxWG. Effect on the electroencephalogram of certain drugs which influence nervous activity. Arch Intl Med 60 (1937): 154-156.
- Bartel PR, Smith FJ, Becker PJ. A comparison of EEG spectral entropy with conventional quantitative EEG at varying depths of sevoflurane anesthesia. Southern African Journal of Anesthesia and Analgesia (2005): 89-93.
- McKay IDH, Voss LJ, Sleigh JW, et al. Pharmacokinetic-Pharmacodynamic Modeling the Hypnotic Effect of Sevoflurane Using the Spectral Entropy of the Electroencephalogram. Anesthesia and Analgesia 102 (2006): 91-7.
