Binary Mixture of Pharmaceutical Residual Solvents and Their Thermodynamic Investigation
Article Information
Md Sydur Rahman1,*, Muhammad Habibullah2
1Graduate Student, Department of Chemistry, Mississippi State University, USA
2Professor, Department of Chemistry, University of Chittagong, Bangladesh
*Corresponding author: Md Sydur Rahman, Graduate Student, Department of Chemistry, Mississippi State University, USA
Received: 12 June 2022; Accepted: 16 June 2022; Published: 22 June 2022
Citation: Md Sydur Rahman, Muhammad Habibullah. Binary Mixture of Pharmaceutical Residual Solvents and Their Thermodynamic Investigation. Journal of Pharmacy and Pharmacology Research 6 (2022): 62-79
View / Download Pdf Share at FacebookAbstract
Molecular interaction of pharmaceutical residual solvents mixture (2-Butanol with m-Xylene) were studied through deep investigation on thermodynamic properties (Enthalpy, Entropy, Free energy) over the entire range of composition at temperature of 298.15 K to 323.15 K and at atmospheric pressure. Results are interpreted and reported in the light of solvation process which is referred to as the transition of molecules from their own environment. Next, the excess thermodynamic properties were calculated, and these excess properties were fitted by the Redlich–Kister polynomial equation. The calculated excess properties are discussed in terms of molecular interactions between 2-Butanol and m-Xylene.
Keywords
Residual solvent; Thermodynamic property; Binary mixture; 2-Butanol; m-Xylene
Residual solvent articles; Thermodynamic property articles; Binary mixture articles; 2-Butanol articles; m-Xylene articles
Article Details
1. Introduction
The pharmaceutical industry is one of the largest users of organic solvents per amount of the final product [1-3]. Organic solvents are constantly present in the pharmaceutical production processes and the properties of binary liquid mixtures are of interest to pharmacist, medicinal scientists, condensed-matter theorists, experimental chemists, and physicists etc. An understanding of the intermolecular forces which give rise to the diverse phenomena observed experimentally is important for both practical and applications-oriented reasons. In chemical process industries, materials are normally handled in fluid form and therefore, the physical, chemical, and transport properties of fluids draw attention. Thermodynamic investigation of liquid mixtures consisting of polar and nonpolar components is of considerable importance in understanding the intermolecular interaction between the component molecules and in processing product formulation in several industrial and technological purposes. Residual solvents testing become one of the important parts of quality control in pharmaceuticals [4, 5].
Residual solvents in pharmaceutical products are defined as organic volatile compounds that are used or produced in the manufacturing of drug substances or excipients, or in the preparation of drug products. Among the residual solvents 2-Butanol (or 2-Bu-OH) and xylene are very significant in the view of pharmaceutical importance [6, 7]. 2-Bu-OH is an organic polar compound normally found as an equal mixture of the two stereoisomers, a racemic mixture of (R)-(−)-2-Bu-OH and (S)-(+)-2-Bu-OH. This secondary alcohol is a flammable, colorless liquid that is soluble in water and completely miscible with polar organic solvents such as ethers and other alcohols [8, 9]. Xylene is used in medical technology, dentistry and in industry as a solvent and in the manufacture of pesticides, chemical and pharmaceutical products [10, 11]. m-Xylene (or m-Xln), the most important type of xylene, is an aromatic hydrocarbon, based on benzene with two methyl substituents where “m” stands for meta, meaning the two methyl substituents are at location 1 and 3 on the aromatic ring.
The practical importance of liquid mixtures rather than single component liquid systems, has gained much importance in assessing the nature of molecular interactions and in investigating the physico-chemical behaviors of such systems [12, 13, 14]. The systematic survey of literature shows that there is no systematic study specially on thermodynamic properties present in the binary mixture containing 2-Bu-OH and m-Xln with highly intensive observation of every specific proportion. In view of this importance, it is of interest to study the thermodynamic properties in order to understand the interaction behavior in their binary mixtures of various proportions with the variation of temperature. From the experimental values of density and viscosity, thermodynamic properties and their excess thermodynamic properties have been estimated at 298.15 K to 323.15 K. The result of excess properties viz: excess enthalpy of activation (DH#E), excess entropy of activation (DS#E) and excess free energy of activation (DG#E) were fitted to the Redlich-Kister equation [15] and plotted by graphical presentation.
2. Experimental details
2-Bu-OH and m-Xln used in this research study were purchased from Sigma Aldrich Chemicals Company. According to the manufacturer, the purities of these compounds were >99%. The water used in all experimental work was double distilled in quality. The binary mixtures of 2-Bu-OH and m-Xln were prepared by using an analytical electrical balance with a precision of ± o.1 µg and later were converted to different composition of the mixture using dilution method. Special care was taken to prevent evaporation and the introduction of moisture into the experimental samples.
Density of all binary mixtures including pure solvents was measured using an oscillation densimeter (Anton Paar DSA 5000). To measure the viscosity Stabinger viscometer (svm-3000-stabinger-viscometer) was used. The temperature was previously set up by 298.15-323.15 K. The measurement was accomplished by the descending of the temperature in the viscometer. In both machinery processes the temperature was automatically controlled with an uncertainty of ±0.01 K.
3. Theoretical aspects
3.1 Calculation of different thermodynamic parameters for viscous flow:
Fluidity of liquid follows some mechanisms as liquid is considered as a combination of layers and so it flows as a rate process. To treat the viscosity as a rate process it is assumed that the motion of liquid layers involves the passage of a molecule from one equilibrium position to another in the same layer. To do so, it is necessary that a suitable ‘hole’ or site should be available, and the production of such a ‘hole’ requires the expenditure of energy, since work must be done in pushing back other molecules. The jump of the moving molecules from one equilibrium position to the next may thus be regarded as equivalent to the passage of the system over a potential barrier. Eyring and his co-workers using absolute reaction rate theory and partition functions, correlated viscosity [16] as follows:

Where, DG# is the free energy of activation per mole for viscous flow, h the Planck’s constant (=6.6262 x 10⁻³⁴ J.sec), N the Avogadro number (= 6.023 x 10²³ mol-1), R the molar gas constant (= 8.3145 JK-1mol-1) T the absolute temperature in Kelvin scale and h is the observed viscosity in mPa.s. According to the definition of DG# eq. (1) reduces to

Where, DH# is the enthalpy of activation per mole and DS# the entropy of activation per mole for viscous flow.
The plot of  gives a straight line with slope, DH#/ R and intercept, -DS#/R assuming that DH# and DS# be almost independent of temperature. Therefore, DH# and DS# can easily be calculated from the slope and intercept of eq. (3) as,

The free energy of activation, DG#, for viscous flow has been calculated by using the simple thermodynamic relation,

3.2 Calculation of different excess thermodynamic parameters for viscous flow
The excess free energy of activation (DG#E), excess enthalpy of activation (DH#E) and excess entropy of activation (DS#E) for viscous flow were calculated by using the following relations,
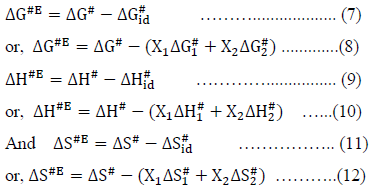
Where, the subscripts 1 and 2 represent the pure components of the mixture.
The experimentally obtained values of excess properties for a system were fitted by the least square method using Redlich-Kister Eq. (13) of the form:

4. Results and discussion
4.1 Density and Viscosity of the binary mixture
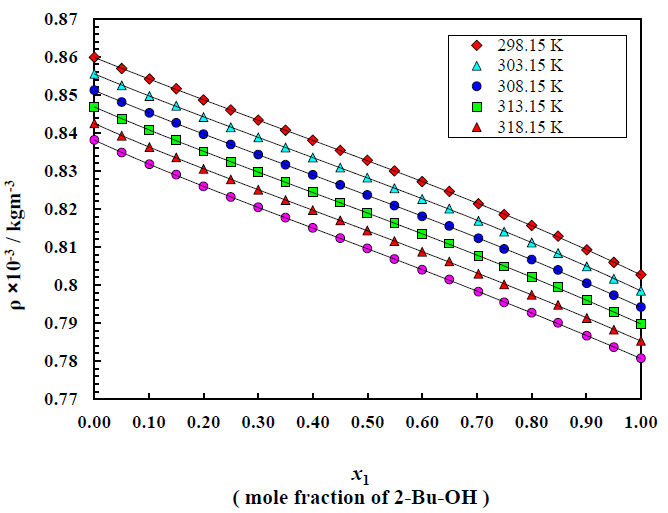
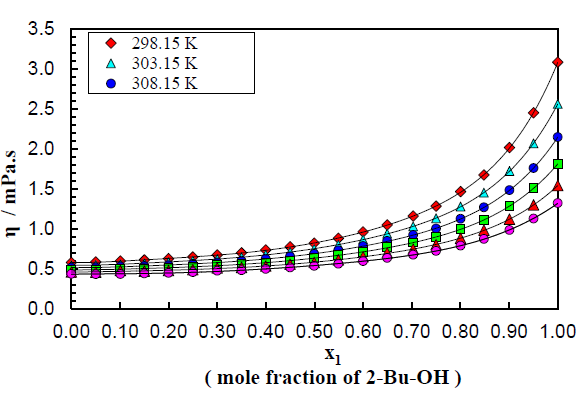
The density and viscosity values of binary mixture as a function of the mole fraction of 2-Bu-OH(x1) respectively at temperatures (298.15 to 323.15) K can be known by Figure (1-2). The plotting displays the trend of changing these properties. The changes of the properties are evaluated for the changes of each proportion of the mixture component along with the variation of temperatures.
From Figure 2 it can be observed that viscosity of the binary mixture of 2-Bu-OH + m-Xln increases in very disciplined way with the increasing proportion of 2-Bu-OH but decreases almost linearly with temperature rises. Here the nonpolar m-Xln is low viscous liquid and when it interacts with the polar one it breaks the intermolecular network of the 2-Bu-OH which was built due to a lot of H-bond as well as polar-polar interaction. Thus, there was an induction of polarity occurred in m-Xln and become induced dipole and attached to the polar 2-Bu-OH. Thus, the liquid mixture becomes more viscous. From Figure 2 it can be seen that the rising of viscosity first increases slowly but when the polar proportion is higher it rises sharply upward.
4.2 Thermodynamic properties measurement
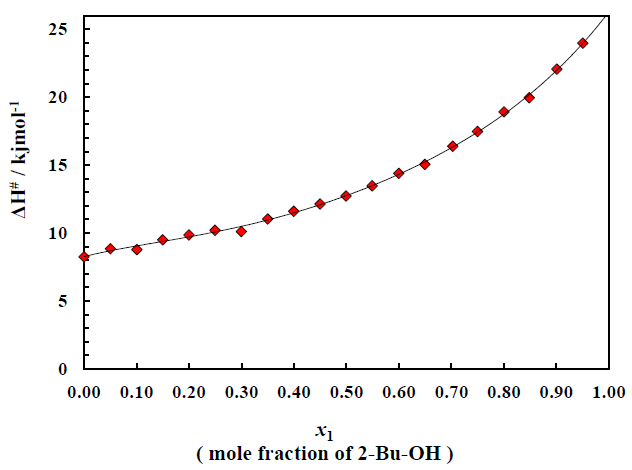
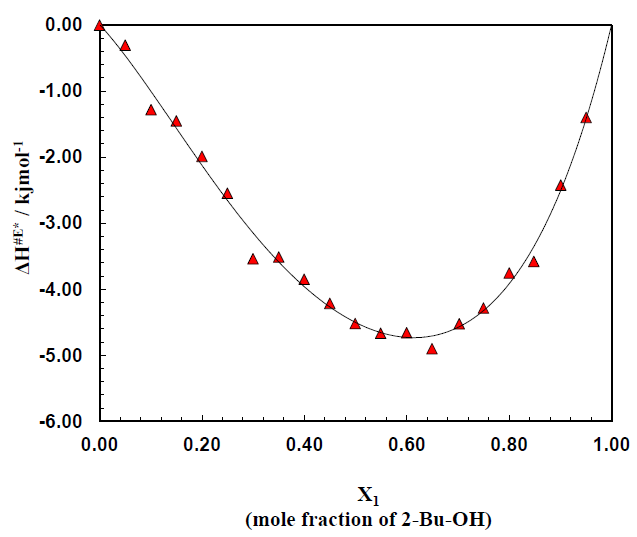
The three types of very important thermodynamic properties viz. entropy, enthalpy and free energy were very intensively studied for the binary mixture of polar + nonpolar compound. There excess values were also calculated and fitted in Redlich-kister fitting equation. Figure 3 shows the plot of enthalpy of activation ΔH# for the transport process vs. mole fraction of alcohol for the system over the whole range of composition (0 to 1). It is noticed that for the binary system ΔH# value (Table 1) continues to increase on addition of alcohol and eventually reach the value of pure 2-Bu-OH because H-bonded liquids, like 2-Bu-OH always require higher enthalpy for activation than that of the other low polar or nonpolar liquids. The excess enthalpies of the binary mixtures of aromatic hydrocarbons with 2-Bu-OH are graphically represented by the Figure 4. The excess enthalpy of activation for viscous flow (ΔH#E) show the negative values extended over a considerable region of concentrations.
Table 1: Experimental data for Enthalpy of activation of the binary mixture
|
Mole fraction of |
Enthalpy (Expt.) DH# kJmol-1 |
Enthalpy (Theor.) DH¹id kJmol-1 |
Excess Enthalpy DH#E kJmol-1 |
Fitting Value DH#E* kJmol-1 |
|
|
2-Bu-OH (x1) |
m-Xln (x2) |
||||
|
0.0000 |
1.0000 |
8.2473 |
8.2473 |
0.0000 |
0.0000 |
|
0.0500 |
0.9500 |
8.8447 |
9.1483 |
-0.3036 |
-0.4519 |
|
0.1007 |
0.8994 |
8.7808 |
10.0609 |
-1.2802 |
-0.9986 |
|
0.1499 |
0.8501 |
9.4970 |
10.9482 |
-1.4512 |
-1.5620 |
|
0.1998 |
0.8002 |
9.8594 |
11.8470 |
-1.9876 |
-2.1274 |
|
0.2496 |
0.7504 |
10.1993 |
12.7449 |
-2.5456 |
-2.6618 |
|
0.2998 |
0.7002 |
10.1118 |
13.6486 |
-3.5367 |
-3.1529 |
|
0.3498 |
0.6502 |
11.0383 |
14.5502 |
-3.5119 |
-3.5863 |
|
0.3996 |
0.6004 |
11.5978 |
15.4470 |
-3.8493 |
-3.9553 |
|
0.4498 |
0.5502 |
12.1391 |
16.3519 |
-4.2128 |
-4.2609 |
|
0.4993 |
0.5007 |
12.7254 |
17.2432 |
-4.5178 |
-4.4925 |
|
0.5490 |
0.4510 |
13.4728 |
18.1394 |
-4.6666 |
-4.6509 |
|
0.5997 |
0.4003 |
14.3952 |
19.0534 |
-4.6582 |
-4.7280 |
|
0.6493 |
0.3507 |
15.0475 |
19.9470 |
-4.8995 |
-4.7104 |
|
0.7026 |
0.2974 |
16.3868 |
20.9079 |
-4.5211 |
-4.5723 |
|
0.7497 |
0.2503 |
17.4724 |
21.7567 |
-4.2843 |
-4.3289 |
|
0.8001 |
0.1999 |
18.9108 |
22.6649 |
-3.7542 |
-3.9175 |
|
0.8483 |
0.1518 |
19.9537 |
23.5317 |
-3.5780 |
-3.3499 |
|
0.9009 |
0.0991 |
22.0578 |
24.4800 |
-2.4222 |
-2.4915 |
|
0.9503 |
0.0497 |
23.9739 |
25.3712 |
-1.3973 |
-1.4104 |
|
1.0000 |
0.0000 |
26.2660 |
26.2660 |
0.0000 |
0.0000 |
Enthalpy, Excess Enthalpy and Fitting value of Excess enthalpy of activation for different molar ratios are listed in the table.
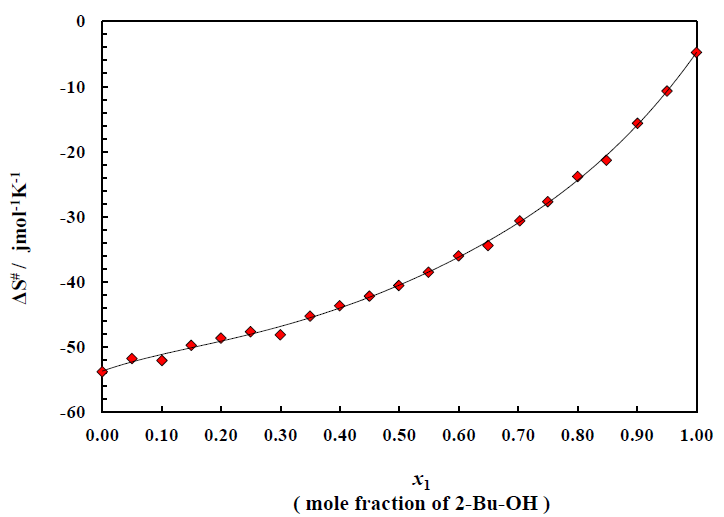
Figure 5 is for the plots of entropy of activation ΔS# for the viscous flow vs. mole fraction of alcohol for this binary system. The corresponding data are listed in Table 2. The typical nature of the small and negative (ΔS#) value of alcohol indicates that during the viscous flow of initial H-bonded order breaks down to form the activated complex of little ordered structure. On the other hand, negative (ΔS#) value for the aromatic hydrocarbons revealed that during the flow process the activated complex formed, are much more ordered.
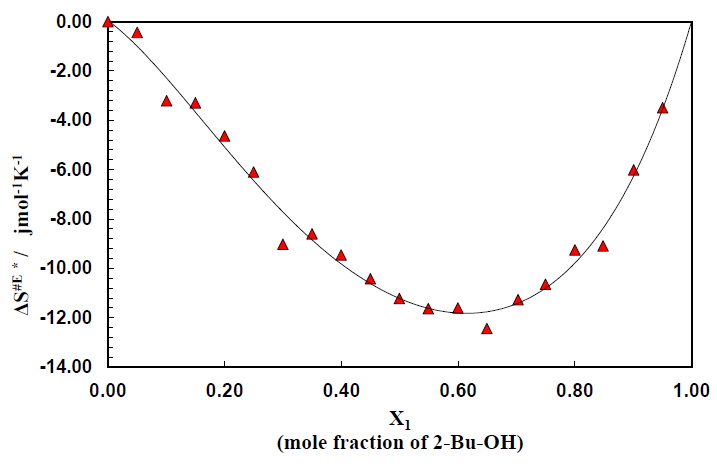
Figure 5 also reveals that with increase of concentration of alcohol, the negative value decreases for the binary system of 2-Bu-OH + m-Xln respectively. It indicates that during the flow process at the certain composition of mixtures, the molecular order of the activated and inactivated state for each of the mixtures is same. The excess entropy ΔS#E of activation for the system are shown (Figure 6) as a function of mole fraction of 2-Bu-OH. The plots of ΔS#E vs. mole fraction of 2-Bu-OH Figure 6 for the binary mixture show an almost similar trend at those of the excess enthalpy (ΔH#E). The curve has been found to be concave in nature. The negative excess entropy signifies that the species formed in the activated state are more ordered than what is to be expected to the additive law.
Table 2: Experimental data for Entropy of activation of the binary mixture
|
Mole fraction of |
Entropy (Expt.) DS# Jmol-1 K-1 |
Entropy (Theor.) DS#id Jmol-1 K-1 |
Excess Entropy DS#E Jmol-1 K-1 |
Fitting Value DS#E* Jmol-1 K-1 |
|
|
2-Bu-OH (x1) |
m-Xln (x2) |
||||
|
0.0000 |
1.0000 |
-53.7654 |
-53.7654 |
0.0000 |
0.0000 |
|
0.0500 |
0.9500 |
-51.7552 |
-51.3158 |
-0.4394 |
-0.9349 |
|
0.1007 |
0.8994 |
-71.7320 |
-48.8346 |
-3.2086 |
-2.2531 |
|
0.1499 |
0.8501 |
-49.7181 |
-46.4224 |
-3.2957 |
-3.6748 |
|
0.1998 |
0.8002 |
-48.6127 |
-43.9789 |
-4.6339 |
-5.1185 |
|
0.2496 |
0.7504 |
-47.6356 |
-41.5379 |
-6.0977 |
-6.4842 |
|
0.2998 |
0.7002 |
-48.1038 |
-39.0810 |
-9.0228 |
-7.7373 |
|
0.3498 |
0.6502 |
-45.2342 |
-36.6297 |
-8.6046 |
-8.8437 |
|
0.3996 |
0.6004 |
-43.6499 |
-34.1915 |
-9.4584 |
-9.7901 |
|
0.4498 |
0.5502 |
-42.1572 |
-31.7316 |
-10.4256 |
-10.5802 |
|
0.4993 |
0.5008 |
-40.5356 |
-29.3084 |
-11.2272 |
-11.1861 |
|
0.5490 |
0.4510 |
-38.5053 |
-26.8720 |
-11.6333 |
-11.6068 |
|
0.5997 |
0.4003 |
-35.9968 |
-24.3870 |
-11.6098 |
-11.8182 |
|
0.6493 |
0.3507 |
-34.4003 |
-21.9576 |
-12.4427 |
-11.7829 |
|
0.7026 |
0.2974 |
-30.6157 |
-19.3452 |
-11.2704 |
-11.4360 |
|
0.7497 |
0.2503 |
-27.6821 |
-17.0375 |
-10.6446 |
-10.8196 |
|
0.8001 |
0.1999 |
-23.8235 |
-14.5684 |
-9.2550 |
-9.7820 |
|
0.8483 |
0.1518 |
-21.3038 |
-12.2120 |
-9.0918 |
-8.3609 |
|
0.9009 |
0.0991 |
-15.6459 |
-9.6339 |
-6.0120 |
-6.2240 |
|
0.9503 |
0.0497 |
-10.7034 |
-7.2109 |
-3.4924 |
-3.5347 |
|
1.0000 |
0.0000 |
-4.7782 |
-4.7782 |
0.0000 |
0.0000 |
Entropy, Excess entropy and Fitting value of excess entropy of activation for different molar ratios are listed in the table.
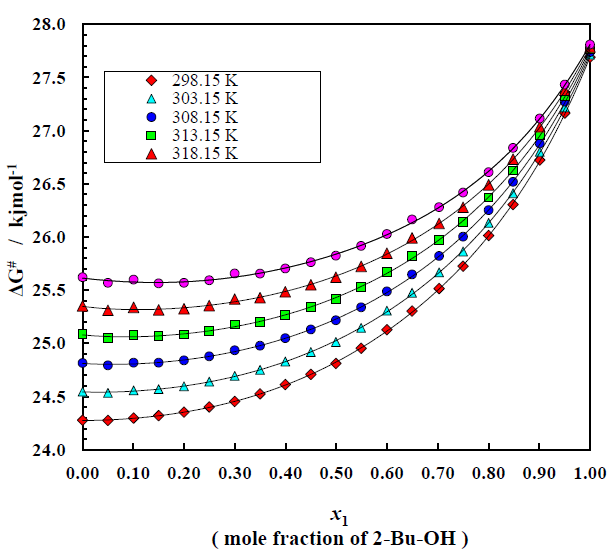
Table (3-8) shows the variation of free energy of activation ΔG# for the viscous flow of the system as a function of 2-Bu-OH under the whole range of composition at temperature 298.15 K to 323.15 K and trend of changing this thermodynamic property are given by the Figure 7. The ΔG# values increase very slowly in the initial stage which is followed by a relatively greater rise with increasing concentration of 2-Bu-OH. The curves for ΔG# for the system are found to be smooth and similar. But a crossover of curves between temperature 298.15 K and 323.15 K is noticed in the system at higher mole fraction of 2-Bu-OH. It is also revealed from the Figure 7 that the nonpolar (m-Xln) rich region the ΔG# values increase slightly with the rise of temperature but at the alcohol rich region it is vice versa.
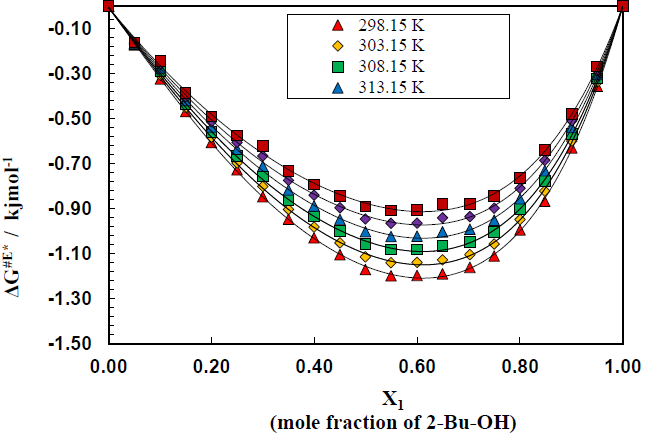
Figure 8 shows the variation of excess free energy ΔG#E of activation at 298.15 to 323.15 K over the whole composition range for this binary system (Table 3-8). In each case, the ΔG#E values are negative, but with the rise of temperature, the values are less negative, i.e., (δΔG#E/ΔT)p is positive. The general nature of the curves does not virtually change with the variation of temperature. The negative excess free energies indicate according to the Eyring
 that the viscous flow of the solutions of the aromatic hydrocarbons in 2-Bu-OH is enhanced, causing the viscosity to decrease from the values expected ideally.
The free energy of activation is often regarded to be an energy barrier that a molecule must surmount in order to make a hole which is a necessary requirement for a molecule to flow through. The excess values throughout the whole concentration range are negative with minima falling around 0.6 mole fraction of 2-Bu-OH. The negative excess free energy indicates the reduction of energy barrier height and hence increases of viscous flow.
Table 3: Experimental data for Free energy of activation of the binary mixture at 298.15 K
|
Mole fraction of |
Free Energy (Expt.) DG# kJmol-1 |
Free Energy (Theor.) DG#id kJmol-1 |
Excess Free Energy DG# E kJmol-1 |
Fitting Value DG# E* kJmol-1 |
|
|
2-Bu-OH (x1) |
m-Xln (x2) |
||||
|
0.0000 |
1.0000 |
24.2774 |
24.2774 |
0.0000 |
0.0000 |
|
0.0500 |
0.9500 |
24.2755 |
24.4481 |
-0.1726 |
-0.1732 |
|
0.1007 |
0.8994 |
24.2974 |
24.6210 |
-0.3235 |
-0.3268 |
|
0.1499 |
0.8501 |
24.3205 |
24.7890 |
-0.4686 |
-0.4664 |
|
0.1998 |
0.8002 |
24.3533 |
24.9593 |
-0.6060 |
-0.6013 |
|
0.2496 |
0.7504 |
24.4018 |
25.1294 |
-0.7276 |
-0.7286 |
|
0.2998 |
0.7002 |
24.4540 |
25.3006 |
-0.8466 |
-0.8460 |
|
0.3498 |
0.6502 |
24.5249 |
25.4714 |
-0.9465 |
-0.9495 |
|
0.3996 |
0.6004 |
24.6120 |
25.6412 |
-1.0293 |
-1.0364 |
|
0.4498 |
0.5502 |
24.7083 |
25.8127 |
-1.1044 |
-1.1064 |
|
0.4993 |
0.5008 |
24.8111 |
25.9815 |
-1.1704 |
-1.1573 |
|
0.5490 |
0.4510 |
24.9531 |
26.1512 |
-1.1981 |
-1.1903 |
|
0.5997 |
0.4003 |
25.1277 |
26.3244 |
-1.1967 |
-1.2044 |
|
0.6493 |
0.3507 |
25.3040 |
26.4937 |
-1.1897 |
-1.1974 |
|
0.7026 |
0.2974 |
25.5149 |
26.6757 |
-1.1608 |
-1.1627 |
|
0.7497 |
0.2503 |
25.7259 |
26.8365 |
-1.1106 |
-1.1031 |
|
0.8001 |
0.1999 |
26.0137 |
27.0085 |
-0.9948 |
-1.0010 |
|
0.8483 |
0.1518 |
26.3054 |
27.1727 |
-0.8673 |
-0.8571 |
|
0.9009 |
0.0991 |
26.7226 |
27.3523 |
-0.6297 |
-0.6358 |
|
0.9503 |
0.0497 |
27.1651 |
27.5212 |
-0.3560 |
-0.3565 |
|
1.0000 |
0.0000 |
27.6907 |
27.6907 |
0.0000 |
0.0000 |
Free energy, Excess free energy, and Fitting value of excess free energy for different molar ratios at 298.15 K are listed in the table.
Table 4: Experimental data for Free energy of activation of the binary mixture at 303.15 K
|
Mole fraction of |
Free Energy (Expt.) DG# kJmol-1 |
Free Energy (Theor.) DG#id kJmol-1 |
Excess Free Energy DG# E kJmol-1 |
Fitting Value DG# E* kJmol-1 |
|
|
2-Bu-OH (x1) |
m-Xln (x2) |
||||
|
0.0000 |
1.0000 |
24.5462 |
24.5462 |
0.0000 |
0.0000 |
|
0.0500 |
0.9500 |
24.5343 |
24.7047 |
-0.1704 |
-0.1685 |
|
0.1007 |
0.8994 |
24.5577 |
24.8651 |
-0.3075 |
-0.3156 |
|
0.1499 |
0.8501 |
24.5691 |
25.0212 |
-0.4521 |
-0.4480 |
|
0.1998 |
0.8002 |
24.5963 |
25.1792 |
-0.5829 |
-0.5757 |
|
0.2496 |
0.7504 |
24.6400 |
25.3371 |
-0.6971 |
-0.6961 |
|
0.2998 |
0.7002 |
24.6945 |
25.4960 |
-0.8015 |
-0.8074 |
|
0.3498 |
0.6502 |
24.7511 |
25.6545 |
-0.9035 |
-0.9053 |
|
0.3996 |
0.6004 |
24.8302 |
25.8122 |
-0.9820 |
-0.9874 |
|
0.4498 |
0.5502 |
24.9191 |
25.9713 |
-1.0523 |
-1.0535 |
|
0.4993 |
0.5008 |
25.0138 |
26.1280 |
-1.1142 |
-1.1014 |
|
0.5490 |
0.4510 |
25.1457 |
26.2856 |
-1.1399 |
-1.1323 |
|
0.5997 |
0.4003 |
25.3077 |
26.4463 |
-1.1387 |
-1.1453 |
|
0.6493 |
0.3507 |
25.4760 |
26.6035 |
-1.1275 |
-1.1385 |
|
0.7026 |
0.2974 |
25.6679 |
26.7724 |
-1.1045 |
-1.1055 |
|
0.7497 |
0.2503 |
25.8643 |
26.9217 |
-1.0574 |
-1.0490 |
|
0.8001 |
0.1999 |
26.1328 |
27.0814 |
-0.9485 |
-0.9520 |
|
0.8483 |
0.1518 |
26.4119 |
27.2338 |
-0.8218 |
-0.8153 |
|
0.9009 |
0.0991 |
26.8009 |
27.4005 |
-0.5997 |
-0.6046 |
|
0.9503 |
0.0497 |
27.2187 |
27.5572 |
-0.3385 |
-0.3388 |
|
1.0000 |
0.0000 |
27.7145 |
27.7145 |
0.0000 |
0.0000 |
Free energy, Excess free energy, and Fitting value of excess free energy for different molar ratios at 303.15 K are listed in the table.
Table 5: Experimental data of Free energy of activation of the binary mixture at 308.15 K
|
Mole fraction of |
Free Energy (Expt.) DG# kJmol-1 |
Free Energy (Theor.) DG#id kJmol-1 |
Excess Free Energy DG# E kJmol-1 |
Fitting Value DG# E* kJmol-1 |
|
|
2-Bu-OH (x1) |
m-Xln (x2) |
||||
|
0.0000 |
1.0000 |
24.8151 |
24.8151 |
0.0000 |
0.0000 |
|
0.0500 |
0.9500 |
24.7931 |
24.9613 |
-0.1682 |
-0.1639 |
|
0.1007 |
0.8994 |
24.8179 |
25.1093 |
-0.2914 |
-0.3043 |
|
0.1499 |
0.8501 |
24.8177 |
25.2533 |
-0.4356 |
-0.4297 |
|
0.1998 |
0.8002 |
24.8394 |
25.3991 |
-0.5597 |
-0.5502 |
|
0.2496 |
0.7504 |
24.8782 |
25.5448 |
-0.6666 |
-0.6637 |
|
0.2998 |
0.7002 |
24.9350 |
25.6914 |
-0.7564 |
-0.7687 |
|
0.3498 |
0.6502 |
24.9772 |
25.8377 |
-0.8604 |
-0.8611 |
|
0.3996 |
0.6004 |
25.0485 |
25.9832 |
-0.9347 |
-0.9385 |
|
0.4498 |
0.5502 |
25.1298 |
26.1300 |
-1.0001 |
-1.0006 |
|
0.4993 |
0.5008 |
25.2165 |
26.2746 |
-1.0581 |
-1.0455 |
|
0.5490 |
0.4510 |
25.3382 |
26.4200 |
-1.0818 |
-1.0743 |
|
0.5997 |
0.4003 |
25.4877 |
26.5683 |
-1.0806 |
-1.0863 |
|
0.6493 |
0.3507 |
25.6480 |
26.7132 |
-1.0653 |
-1.0796 |
|
0.7026 |
0.2974 |
25.8210 |
26.8691 |
-1.0481 |
-1.0483 |
|
0.7497 |
0.2503 |
26.0027 |
27.0069 |
-1.0042 |
-0.9949 |
|
0.8001 |
0.1999 |
26.2520 |
27.1542 |
-0.9022 |
-0.9031 |
|
0.8483 |
0.1518 |
26.5184 |
27.2948 |
-0.7764 |
-0.7735 |
|
0.9009 |
0.0991 |
26.8791 |
27.4487 |
-0.5696 |
-0.5735 |
|
0.9503 |
0.0497 |
27.2722 |
27.5933 |
-0.3211 |
-0.3212 |
|
1.0000 |
0.0000 |
27.7384 |
27.7384 |
0.0000 |
0.0000 |
Free energy, Excess free energy, and Fitting value of excess free energy for different molar ratios at 308.15 K are listed in the table.
Table 6: Experimental data of Free energy of activation of the binary mixture at 313.15 K
|
Mole fraction of |
Free Energy (Expt.) DG# kJmol-1 |
Free Energy (Theor.) DG#id kJmol-1 |
Excess Free Energy DG# E kJmol-1 |
Fitting Value DG# E* kJmol-1 |
|
|
2-Bu-OH (x1) |
m-Xln (x2) |
||||
|
0.0000 |
1.0000 |
25.0839 |
25.0839 |
0.0000 |
0.0000 |
|
0.0500 |
0.9500 |
25.0518 |
25.2178 |
-0.1660 |
-0.1592 |
|
0.1007 |
0.8994 |
25.0781 |
25.3535 |
-0.2754 |
-0.2930 |
|
0.1499 |
0.8501 |
25.0663 |
25.4854 |
-0.4191 |
-0.4113 |
|
0.1998 |
0.8002 |
25.0825 |
25.6190 |
-0.5365 |
-0.5246 |
|
0.2496 |
0.7504 |
25.1164 |
25.7525 |
-0.6361 |
-0.6313 |
|
0.2998 |
0.7002 |
25.1755 |
25.8868 |
-0.7113 |
-0.7300 |
|
0.3498 |
0.6502 |
25.2034 |
26.0208 |
-0.8174 |
-0.8169 |
|
0.3996 |
0.6004 |
25.2667 |
26.1541 |
-0.8874 |
-0.8896 |
|
0.4498 |
0.5502 |
25.3406 |
26.2886 |
-0.9480 |
-0.9477 |
|
0.4993 |
0.5008 |
25.4191 |
26.4211 |
-1.0020 |
-0.9896 |
|
0.5490 |
0.4510 |
25.5307 |
26.5543 |
-1.0236 |
-1.0162 |
|
0.5997 |
0.4003 |
25.6676 |
26.6902 |
-1.0226 |
-1.0272 |
|
0.6493 |
0.3507 |
25.8200 |
26.8230 |
-1.0030 |
-1.0206 |
|
0.7026 |
0.2974 |
25.9741 |
26.9659 |
-0.9918 |
-0.9912 |
|
0.7497 |
0.2503 |
26.1411 |
27.0920 |
-0.9510 |
-0.9408 |
|
0.8001 |
0.1999 |
26.3711 |
27.2270 |
-0.8560 |
-0.8542 |
|
0.8483 |
0.1518 |
26.6250 |
27.3559 |
-0.7309 |
-0.7317 |
|
0.9009 |
0.0991 |
26.9573 |
27.4968 |
-0.5395 |
-0.5424 |
|
0.9503 |
0.0497 |
27.3257 |
27.6293 |
-0.3036 |
-0.3035 |
|
1.0000 |
0.0000 |
27.7623 |
27.7623 |
0.0000 |
0.0000 |
Free energy, Excess free energy, and Fitting value of excess free energy for different molar ratios at 313.15 K are listed in the table.
Table 7: Experimental data for Free energy of activation of the binary mixture at 318.15 K
|
Mole fraction of |
Free Energy (Expt.) DG# kJmol-1 |
Free Energy (Theor.) DG#id kJmol-1 |
Excess Free Energy DG# E kJmol-1 |
Fitting Value DG# E* kJmol-1 |
|
|
2-Bu-OH (x1) |
m-Xln (x2) |
||||
|
0.0000 |
1.0000 |
25.3527 |
25.3527 |
0.0000 |
0.0000 |
|
0.0500 |
0.9500 |
25.3106 |
25.4744 |
-0.1638 |
-0.1545 |
|
0.1007 |
0.8994 |
25.3383 |
25.5977 |
-0.2594 |
-0.2818 |
|
0.1499 |
0.8501 |
25.3149 |
25.7175 |
-0.4026 |
-0.3929 |
|
0.1998 |
0.8002 |
25.3255 |
25.8389 |
-0.5134 |
-0.4990 |
|
0.2496 |
0.7504 |
25.3546 |
25.9601 |
-0.6056 |
-0.5989 |
|
0.2998 |
0.7002 |
25.4160 |
26.0822 |
-0.6661 |
-0.6913 |
|
0.3498 |
0.6502 |
25.4296 |
26.2040 |
-0.7744 |
-0.7727 |
|
0.3996 |
0.6004 |
25.4850 |
26.3251 |
-0.8401 |
-0.8406 |
|
0.4498 |
0.5502 |
25.5514 |
26.4473 |
-0.8959 |
-0.8948 |
|
0.4993 |
0.5008 |
25.6218 |
26.5676 |
-0.9458 |
-0.9336 |
|
0.5490 |
0.4510 |
25.7232 |
26.6887 |
-0.9654 |
-0.9582 |
|
0.5997 |
0.4003 |
25.8476 |
26.8121 |
-0.9645 |
-0.9681 |
|
0.6493 |
0.3507 |
25.9920 |
26.9328 |
-0.9408 |
-0.9617 |
|
0.7026 |
0.2974 |
26.1272 |
27.0626 |
-0.9354 |
-0.9340 |
|
0.7497 |
0.2503 |
26.2795 |
27.1772 |
-0.8977 |
-0.8867 |
|
0.8001 |
0.1999 |
26.4902 |
27.2999 |
-0.8097 |
-0.8053 |
|
0.8483 |
0.1518 |
26.7315 |
27.4169 |
-0.6855 |
-0.6899 |
|
0.9009 |
0.0991 |
27.0355 |
27.5450 |
-0.5095 |
-0.5113 |
|
0.9503 |
0.0497 |
27.3792 |
27.6654 |
-0.2862 |
-0.2858 |
|
1.0000 |
0.0000 |
27.7862 |
27.7862 |
0.0000 |
0.0000 |
Free energy, Excess free energy, and Fitting value of excess free energy for different molar ratios at 318.15 K are listed in the table.
Table 8: Experimental data for Free energy of activation of the binary mixture at 323.15 K
|
Mole fraction of |
Free Energy (Expt.) DG# kJmol-1 |
Free Energy (Theor.) DG#id kJmol-1 |
Excess Free Energy DG# E kJmol-1 |
Fitting Value DG# E* kJmol-1 |
|
|
2-Bu-OH (x1) |
m-Xln (x2) |
||||
|
0.0000 |
1.0000 |
25.6216 |
25.6216 |
0.0000 |
0.0000 |
|
0.0500 |
0.9500 |
25.5694 |
25.7310 |
-0.1616 |
-0.1498 |
|
0.1007 |
0.8994 |
25.5985 |
25.8418 |
-0.2433 |
-0.2705 |
|
0.1499 |
0.8501 |
25.5634 |
25.9496 |
-0.3862 |
-0.3745 |
|
0.1998 |
0.8002 |
25.5686 |
26.0588 |
-0.4902 |
-0.4734 |
|
0.2496 |
0.7504 |
25.5927 |
26.1678 |
-0.5751 |
-0.5665 |
|
0.2998 |
0.7002 |
25.6566 |
26.2776 |
-0.6210 |
-0.6526 |
|
0.3498 |
0.6502 |
25.6557 |
26.3871 |
-0.7314 |
-0.7284 |
|
0.3996 |
0.6004 |
25.7032 |
26.4960 |
-0.7928 |
-0.7917 |
|
0.4498 |
0.5502 |
25.7622 |
26.6059 |
-0.8438 |
-0.8419 |
|
0.4993 |
0.5008 |
25.8245 |
26.7142 |
-0.8897 |
-0.8777 |
|
0.5490 |
0.4510 |
25.9158 |
26.8230 |
-0.9073 |
-0.9002 |
|
0.5997 |
0.4003 |
26.0276 |
26.9341 |
-0.9065 |
-0.9090 |
|
0.6493 |
0.3507 |
26.1640 |
27.0426 |
-0.8786 |
-0.9028 |
|
0.7026 |
0.2974 |
26.2803 |
27.1593 |
-0.8791 |
-0.8768 |
|
0.7497 |
0.2503 |
26.4179 |
27.2624 |
-0.8445 |
-0.8326 |
|
0.8001 |
0.1999 |
26.6093 |
27.3727 |
-0.7634 |
-0.7564 |
|
0.8483 |
0.1518 |
26.8380 |
27.4780 |
-0.6400 |
-0.6480 |
|
0.9009 |
0.0991 |
27.1138 |
27.5932 |
-0.4794 |
-0.4802 |
|
0.9503 |
0.0497 |
27.4327 |
27.7014 |
-0.2687 |
-0.2681 |
|
1.0000 |
0.0000 |
27.8101 |
27.8101 |
0.0000 |
0.0000 |
Free energy, Excess free energy, and Fitting value of excess free energy for different molar ratios at 323.15 K are listed in the table.
5. Conclusion
Studies on thermodynamic properties along with their respective excess values in liquids and liquid mixtures is essential to understand the molecular interactions between unlike molecules, to develop new theoretical models [17] as well as engineering applications in pharmaceutical process industries. An understanding of the thermodynamic properties of 2-Bu-OH and m-Xln and their binary system have been measured at temperatures (298.15 to 323.15) K and in atmospheric pressure. Excess thermodynamic properties of binary mixture solvents were calculated and fitted with the Redlich–Kister equation. Thermodynamic properties derived from viscosity and its related parameters are also important in designing industrial equipments with better precision [18]. In these mixtures, the predominance of physical effect may arise due to dipole-induced dipole interaction resulting in disruption in the favorable orientation due to breaking of self-network built by H-bond among the polar molecules and rising dispersion force of nonpolar liquid. The observed excess thermodynamic values in all the mixture indicate the significant interaction between the unlike molecules.
Acknowledgement
This work was the partial fulfillment of academic degree of Master of Science in Chemistry supported by department of Chemistry of University of Chittagong. Teachers and students of this department supported in many ways during this research work to make it successful.
Abbreviations
2-Bu-OH = 2-Butanol
m-Xln = m-Xylene (or meta-Xylene)
References
- Grodowska K, Parczewski A. Organic solvents in the pharmaceutical industry. Acta Poloniae Pharm ñ Drug Res 67 (2010): 3-12.
- Mottu F, Laurent A, Rufenacht DA, Doelker E. Organic solvents for pharmaceutical parenterals and embolic liquids: a review of toxicity data. PDA J Pharm Sci Technol 54 (2000): 456-69.
- Solvents for pharmaceutical manufacturing, American chemistry council (2016).
- Intertec, Residual Solvents (OVI or VOC) analysis (2016).
- Yadav R, Yadav N, Kharya MD. A review: Quality control of residual solvents in pharmaceuticals. W J Pharmacy Pharma Sci 3 (2014): 526-538.
- Residual solvents, USP 37, Chemical test 467:1-37.
- Guidance for industry Q3C tables and list, S. Department of Health and Human Services (2016).
- Frank, Howard, Thomas WM, Fookson A, Pomerantz P, Brooks DB. Preparation and physical properties of several aliphatic hydrocarbons and intermediates. J Res Nation Bur Stand 38 (1947): 1779.
- 2-Butanol, The national institute for occupational safety and health (2016).
- Xylene, Department of health, Pennsylvania (2016).
- Rahman MS. The Systematic Synthesis of Carbon Nanotubes from Aliphatic-Aromatic Compound Mixture Resolves Growth Uniformity and Production Complexity. Journal of Nanotechnology Research 2 (2020): 001-009
- Nath G, Sahu S, Paikaray R. Study of acoustic parameters of binary mixtures of a nonpolar liquid with polar liquid at different frequencies. Indian J Phys 83 (2009): 429-436.
- VelusamyV, Palaniappan Ultrasonic study on biodiesel and diesel mixtures. Asian J App Sci 5 (2012): 514-521.
- Rahman MS, Habibullah M. Estimation of acoustic impedance, it’s excess value and molar sound velocity of the binary mixture of 2-Butanol and m-Xylene for different compositions at different temperatures. Ind. J. of Chem Anal 3 (2020): 1-8.
- Chen F, Yang Z, Chen Z, Hu J, Chen C, Cai J. Density, Viscosity, Speed of sound, excess property and bulk modulus of binary mixtures of -butyrolactone with acetonitrile, dimethyl carbonate, and tetrahydrofuran at temperatures (293.15 to 333.15)K. J of Mol Liq 209 (2015): 683-692.
- Eyring H. Viscosity, plasticity, and diffusion as examples of absolute reaction rates. J Chem Phys 4 (1936): 283-291.
- Sydur Rahman Md. The Systematic Synthesis of Carbon Nanotubes from Aliphatic-Aromatic Compound Mixture Resolves Growth Uniformity and Production Complexity. Journal of Nanotechnology Research 2 (2020): 001-009.
- Ezekiel DD. Derived thermodynamic properties of binary mixtures of m-Xylene, o-Xylene, and p-Xylene, with N, N-Dimethylformamide at T = (293.15, 303.15, 313.15 and 323.15) K. Orient J Chem 30 (2014): 3.

