Mathematical Modelling Projections Versus the Actual Course of the COVID-19 Epidemic following the Nationwide Lockdown in Kyrgyzstan
Article Information
Ainura Moldokmatova1*, Aizhan Dooronbekova2, Chynarkul Zhumalieva2, Aida Estebesova3, Aibek Mukambetov4, Shamil Ibragimov4, Ainura Kutmanova5, Aisuluu Kubatova2, Talant Abdyldaev6, Nurbolot Usenbaev5, Lisa J White1
1Nuffield Department of Medicine, University of Oxford, Oxford, United Kingdom
2Public Fund “Institution of Social Development” in the Kyrgyz Republic, Bishkek, Kyrgyz Republic
3USAID Mission in the Kyrgyz Republic, Bishkek, Kyrgyzstan
4Soros Foundation in the Kyrgyz Republic, Bishkek, Kyrgyzstan
5Ministry of Health of the Kyrgyz Republic, Bishkek, Kyrgyzstan
6Kyrgyz Medical Association, Bishkek, Kyrgyzstan
*Corresponding author: Ainura Moldokmatova, Nuffield Department of Medicine, University of Oxford, Oxford, United Kingdom.
Received: 28 February 2023; Accepted: 08 March 2023; Published: 04 May 2023
Citation:
Ainura Moldokmatova, Aizhan Dooronbekova, Chynar Jumalieva, Aida Estebesova, Aibek Mukambetov, Shamil Ibragimov, Ainura Kutmanova, Aisuluu Kubatova, Talant Abdyldaev, Nurbolot Usenbaev, Lisa J White. Mathematical Modelling Projections Versus the Actual Course of the COVID-19 Epidemic following the Nationwide Lockdown in Kyrgyzstan. Journal of Biotechnology and Biomedicine. 6 (2023): 163-188.
View / Download Pdf Share at FacebookAbstract
Kyrgyzstan was placed under a two-month, nationwide lockdown due to the COVID-19 epidemic, starting on March 25, 2020. Given the highly disruptive effects of the lockdown on the national economy and people’s lives, the government decided not to extend lockdown beyond the initially planned date of May 10, 2020. The strategy chosen by the government was close to the input parameters of our model’s baseline scenario, ‘full lockdown release’, which we presented to policymakers in April 2020, along with various other hypothetical scenarios with managed lockdown release options. To explore whether our model could accurately predict the actual course of the epidemic following the release of lockdown, we compared the outputs of the baseline scenario, such as new cases, deaths, and demand for and occupancy of hospital beds, with actual official reports. Our analysis revealed that the model could accurately predict the timing of the epidemic peak, with a difference of just two weeks, although the magnitude of the peak was overestimated compared with the official statistics. However, it is important to note that the accuracy of the official reports remains debatable, so outputs relating to the size of the epidemic and related pressures on the health system will need to be updated if new evidence becomes available.
COVID-19 articles COVID-19 Research articles COVID-19 review articles COVID-19 PubMed articles COVID-19 PubMed Central articles COVID-19 2023 articles COVID-19 2024 articles COVID-19 Scopus articles COVID-19 impact factor journals COVID-19 Scopus journals COVID-19 PubMed journals COVID-19 medical journals COVID-19 free journals COVID-19 best journals COVID-19 top journals COVID-19 free medical journals COVID-19 famous journals COVID-19 Google Scholar indexed journals hypothetical scenarios articles hypothetical scenarios Research articles hypothetical scenarios review articles hypothetical scenarios PubMed articles hypothetical scenarios PubMed Central articles hypothetical scenarios 2023 articles hypothetical scenarios 2024 articles hypothetical scenarios Scopus articles hypothetical scenarios impact factor journals hypothetical scenarios Scopus journals hypothetical scenarios PubMed journals hypothetical scenarios medical journals hypothetical scenarios free journals hypothetical scenarios best journals hypothetical scenarios top journals hypothetical scenarios free medical journals hypothetical scenarios famous journals hypothetical scenarios Google Scholar indexed journals epidemic peak articles epidemic peak Research articles epidemic peak review articles epidemic peak PubMed articles epidemic peak PubMed Central articles epidemic peak 2023 articles epidemic peak 2024 articles epidemic peak Scopus articles epidemic peak impact factor journals epidemic peak Scopus journals epidemic peak PubMed journals epidemic peak medical journals epidemic peak free journals epidemic peak best journals epidemic peak top journals epidemic peak free medical journals epidemic peak famous journals epidemic peak Google Scholar indexed journals outputs articles outputs Research articles outputs review articles outputs PubMed articles outputs PubMed Central articles outputs 2023 articles outputs 2024 articles outputs Scopus articles outputs impact factor journals outputs Scopus journals outputs PubMed journals outputs medical journals outputs free journals outputs best journals outputs top journals outputs free medical journals outputs famous journals outputs Google Scholar indexed journals isolation articles isolation Research articles isolation review articles isolation PubMed articles isolation PubMed Central articles isolation 2023 articles isolation 2024 articles isolation Scopus articles isolation impact factor journals isolation Scopus journals isolation PubMed journals isolation medical journals isolation free journals isolation best journals isolation top journals isolation free medical journals isolation famous journals isolation Google Scholar indexed journals population articles population Research articles population review articles population PubMed articles population PubMed Central articles population 2023 articles population 2024 articles population Scopus articles population impact factor journals population Scopus journals population PubMed journals population medical journals population free journals population best journals population top journals population free medical journals population famous journals population Google Scholar indexed journals positive cases articles positive cases Research articles positive cases review articles positive cases PubMed articles positive cases PubMed Central articles positive cases 2023 articles positive cases 2024 articles positive cases Scopus articles positive cases impact factor journals positive cases Scopus journals positive cases PubMed journals positive cases medical journals positive cases free journals positive cases best journals positive cases top journals positive cases free medical journals positive cases famous journals positive cases Google Scholar indexed journals asymptomatic articles asymptomatic Research articles asymptomatic review articles asymptomatic PubMed articles asymptomatic PubMed Central articles asymptomatic 2023 articles asymptomatic 2024 articles asymptomatic Scopus articles asymptomatic impact factor journals asymptomatic Scopus journals asymptomatic PubMed journals asymptomatic medical journals asymptomatic free journals asymptomatic best journals asymptomatic top journals asymptomatic free medical journals asymptomatic famous journals asymptomatic Google Scholar indexed journals pneumonia articles pneumonia Research articles pneumonia review articles pneumonia PubMed articles pneumonia PubMed Central articles pneumonia 2023 articles pneumonia 2024 articles pneumonia Scopus articles pneumonia impact factor journals pneumonia Scopus journals pneumonia PubMed journals pneumonia medical journals pneumonia free journals pneumonia best journals pneumonia top journals pneumonia free medical journals pneumonia famous journals pneumonia Google Scholar indexed journals ventilators articles ventilators Research articles ventilators review articles ventilators PubMed articles ventilators PubMed Central articles ventilators 2023 articles ventilators 2024 articles ventilators Scopus articles ventilators impact factor journals ventilators Scopus journals ventilators PubMed journals ventilators medical journals ventilators free journals ventilators best journals ventilators top journals ventilators free medical journals ventilators famous journals ventilators Google Scholar indexed journals
Article Details
Introduction
The first imported cases of COVID-19 in Kyrgyzstan were reported on March 16, 2020, followed by the declaration of a state of emergency and a nationwide, two-month, full ‘lockdown’, beginning on March 25, 2020. As part of the lockdown, the public health response in the country was focussed on non-pharmaceutical interventions, which included contact tracing, isolation of infected people and quarantining those who were exposed to infection, hand hygiene, physical distancing, a travel ban, and the closure of schools, offices, markets and other public spaces. The lockdown helped Kyrgyzstan to effectively control the epidemic, during which the cumulative number of confirmed cases reached 1038, with 13 reported deaths [1]. However, the lockdown was associated with substantial social and economic disruption and led to public criticism of the government for taking such strict measures for such a long period of time. Under increasing public pressure, the government made the decision not to prolong the lockdown after the initially planned two-month period and considered options for other measures, balancing their effectiveness at reducing the transmission of COVID-19 with their impact on the societal and economic aspects of people’s lives. Owing to the lack of knowledge and evidence around effective ways to prevent and treat COVID-19 in the local context and a rapidly developing pandemic globally, the examination of ‘what if’ scenarios through mathematical modelling became useful for providing important insights for public health decision-makers. To assist with this process, our team, an independent Kyrgyz modelling group, in collaboration with and receiving technical support from the international COVID-19 Modelling (CoMo) Consortium [2], reviewed several hypothetical lockdown-release scenarios. In April, 2020, we presented our findings to key decision-makers in Kyrgyzstan, including the Ministry of Health (MoH) and the National COVID-19 Response Unit (NCRU). We modelled the so-called baseline scenario, with full lockdown release, which was then compared with other hypothetical scenarios of managed lockdown release of various durations and intensities of post-lockdown measures. The details can be found in the Policy Notes, which we shared with decision-makers at the end of April 2020 (S1 Appendix). On May 10, 2020, the Kyrgyzstan government made the decision to release the lockdown but retain a partial travel ban, case tracing, and continued school closures until the end of May. A few weeks later, the number of symptomatic COVID-19 cases increased tremendously, causing a significant burden on the health system. As the epidemic developed, hospitals began to experience a scarcity of hospital surge and Intensive Care Unit (ICU) beds, oxygen ventilators, and human and other resources. As a result, many patients with severe COVID-19 symptoms were unable to access adequate hospital and ICU/oxygen treatment, and this contributed to the increasing number of deaths during the peak of the epidemic in July 2020.
In this paper, we analyse what our model was able to predict of the actual course of the epidemic and how close this prediction was to reality. In particular, our interest was focussed on the following two questions:
- How accurately did the model predict the actual course of the epidemic?
- How accurately did the model predict the actual hospital demand and occupancy and their effect on mortality?
Methods
We applied the web-based interface of a dynamic SEIRS (susceptible–exposed–infected–recovered–susceptible) age-structured model for the COVID-19 pandemic, developed by the CoMo Consortium in collaboration with the Oxford Modelling for Global Health (OMGH) Group, for examining the effect of various intervention packages on the epidemic curve in each of more than 150 countries [3]. At the request of the Kyrgyzstan MoH, we sought effective and feasible post-lockdown intervention strategies that would help the country to control the epidemic, keep the number of severe cases at a reasonable level and prevent the health system from becoming overwhelmed during the epidemic peak. We reviewed five hypothetical scenarios for lockdown release: 1) baseline, full release; 2) managed lower intensity release; 3) managed higher intensity release; 4) prolonged lockdown with full release; and 5) prolonged lockdown with managed release.
|
Intervention |
Hypothetical scenario |
||||
|
1 |
2 |
3 |
4 |
5 |
|
|
Initial full lockdown |
8 weeks |
8 weeks |
8 weeks |
||
|
Extended full lockdown |
12 weeks |
||||
|
Extended full lockdown |
16 weeks |
||||
|
Additional post-lockdown measures |
|||||
|
Mask wearing (coverage) |
20% until the end of the simulation period |
||||
|
Hand washing (coverage) |
60% until the end of the simulation period |
||||
|
Self-isolation if symptomatic (coverage) |
40% for 12 weeks |
60% for 16 weeks |
60% for 23 weeks |
||
|
Case tracing (num of contacts/index case) |
20 for 12 weeks |
20 for 16 weeks |
40 for 23 weeks |
||
|
Household isolation if symptomatic (coverage) |
30% for 12 weeks |
30% for 16 weeks |
40% for 23 weeks |
||
|
Social distancing (coverage) |
30% for 16 weeks |
40% for 23 weeks |
|||
|
Working from home (coverage) |
30% for 14 weeks |
||||
|
School closure (coverage) |
Summer break 12 weeks (100%) |
Summer break 12 weeks (100%) |
Summer break 12 weeks (100%) |
Summer break 12 weeks (100%) |
Summer break: 12 weeks (100%) + 80% for 6 weeks in new academic year |
|
International travel ban (coverage) |
50% for 10 weeks |
||||
Table 1: Intervention parameters for the hypothetical scenarios modelled.
As shown in Table 1, the ‘full lockdown release’ scenario implied there were no interventions other than hand hygiene and mask wearing once the 2-month lockdown was lifted. It should be noted that hand hygiene and mask wearing were included in this scenario with a comparatively low coverage, assuming that some of the population would continue following these two measures. In addition, a standard school closure period for summer holidays, from June to August, was taken into consideration, as in the other hypothetical scenarios. All other scenarios included either managed 2-month lockdown release options or extended lockdowns for an additional one or two months with full or managed release.
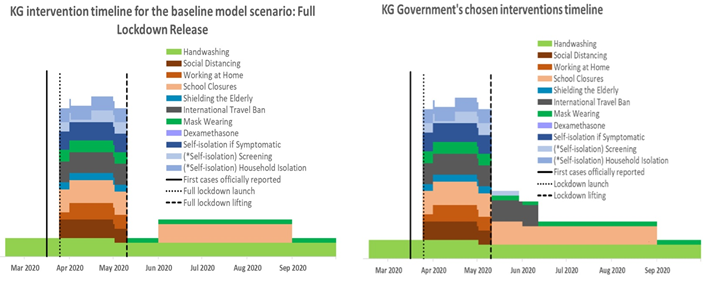
Figure 1: Timelines of interventions for the hypothetical ‘full lockdown release’ scenario and the government’s chosen strategy to release the lockdown on May 10, 2020.
Tool resource: CoMo Consortium, 2020.
Of the five options modelled, the strategy chosen by the government most closely resembled the input data of the full lockdown release scenario. As shown in Figure 1, the government made the decision to resume the normal mode of economic and social life of the country after May 10, 2020, continuing the school closure until the end of the academic year (May 30) and keeping a partial travel ban for an additional few weeks. In addition, the government continued case tracing; however, it was not feasible to adequately implement this strategy due to the increase in new cases with undefined contacts during the second part of June on the one hand and the shortage of human and other resources on the other hand. Accordingly, from July 3, 2020, the MoH stopped reporting the daily statistics of defined index contacts [4]. Evidence suggests that screening without isolation of positive cases and their contacts is less effective at controlling the epidemic than when such isolation is achieved [5,6]. However, in the Kyrgyz context it was not possible to take this measure due the local social and cultural norms, such as the extended intergenerational household structure of the majority of the population, as well as strong family and tribal networks and related large social gatherings. Based on the above, we compared the model output data for the full lockdown release scenario with the actual course of the epidemic in Kyrgyzstan, following the release of lockdown on May 10, 2020. It is important to note that the model was visually fitted against actual new cases and deaths up to April 24, 2020, as part of the simulation procedure in the web-based interface. The charts of the visual calibration outputs with key model parameters can be found in S2 Appendix, Parts I and II.
Results
How accurately did the model predict the epidemic for the full lockdown release scenario?
The majority of COVID-19 cases are asymptomatic or have mild symptoms, particularly among younger people [7–9]. Considering the population structure and limited testing capacity in Kyrgyzstan, our model predicted a significantly higher number of unreported asymptomatic cases or cases with mild symptoms compared with the officially reported number of cases. According to the model, a full lockdown release would be followed by an intense increase in new cases within the next few weeks. The peak was predicted to occur somewhere between the end of June and the first half of July, with approximately 14,000 reported cases and 180,000 unreported cases per day expected to be observed during the peak of the epidemic, if the lockdown was lifted as planned on May 10 (Figure 2A).
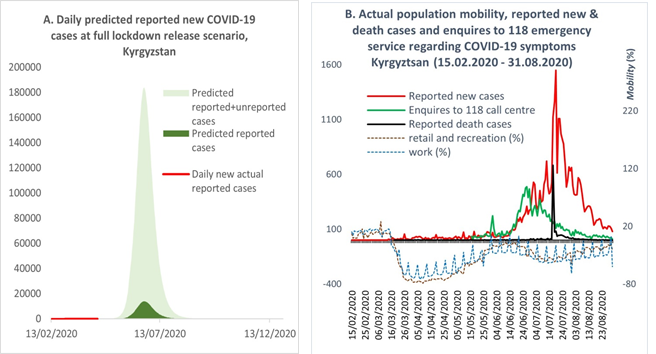
Figure 2: (A) Predicted and actual new cases after releasing the lockdown. (B) Actual new and death cases after releasing the lockdown and population mobility. Resources for Figure 2B: Kyrgyzstan MoH [1]; Google mobility report [10].
The actual course of the epidemic after the release of lockdown took a similar pattern to that predicted by the model. As shown in Figure 2B, with the lifting of lockdown, population mobility began returning to the normal mode, and by the beginning of June mobility had reached the pre-lockdown level. With the intensification of the population’s mobility, the number of reported new cases and deaths began to increase, reaching a peak in the middle of July. It should be noted that until July 17, 2020, the official statistics of new cases included PCR-positive tests only, although the number of cases diagnosed with pneumonia were exceeding the PCR confirmed cases. By the end of July, the proportion of cases with PCR-positive tests comprised just 12%; the remainder were diagnosed with pneumonia [11]. On July 17, 2020, the MoH officially recognised patients with pneumonia as COVID-19 cases and combined the two statistics [12]. A similar pattern to the reported cases was observed with enquires to the 118 ‘hotline’ about COVID-19 symptoms, although the peak of calls occurred in the middle of June (Figure 2B). It is important to note that the 118 hotline was one of many state and private emergency call centres, which were not included in our analysis due to difficulties accessing their data. Based on the above, we consider that the model accurately predicted the timing of the actual epidemic peak following the lifting of the lockdown in May. However, the magnitude of the epidemic peak predicted by the model was observed to be larger than the actual occurrence. As shown in Figure 2A, the model predicted that reported new cases would reach 14,000 per day during the peak, which was about ten-times higher than the actual officially reported statistics.
How accurately did the model predict hospital demand and occupancy and their effect on mortality for the full lockdown release scenario?
With the existing hospital capacity [13] and full lockdown release in May, the simulation predicted that the health system would become overwhelmed due to an extensive influx of patients during the first part of July. According to Figure 3 (A, B and C, respectively) the predicted demand for ICU beds, ventilators, and surge beds would far exceed their availability. For example, the daily demand for surge beds would reach 20,000, whereas the number of surge beds available was 2,200 [13]. At the same time, the occupancy of surge beds would be higher than the demand, as this included the available beds, occupied by those who required ICU and ventilation/oxygen treatment but could not access them, as well as the additional beds created in general wards (e.g. additional beds in corridors, or in additional temporary hospitals). In contrast to the surge bed situation, the occupancy of ICU beds and ventilators would barely exceed their availability thresholds due to the reduced flexibility for creating additional spaces in ICU wards and obtaining additional ventilators.
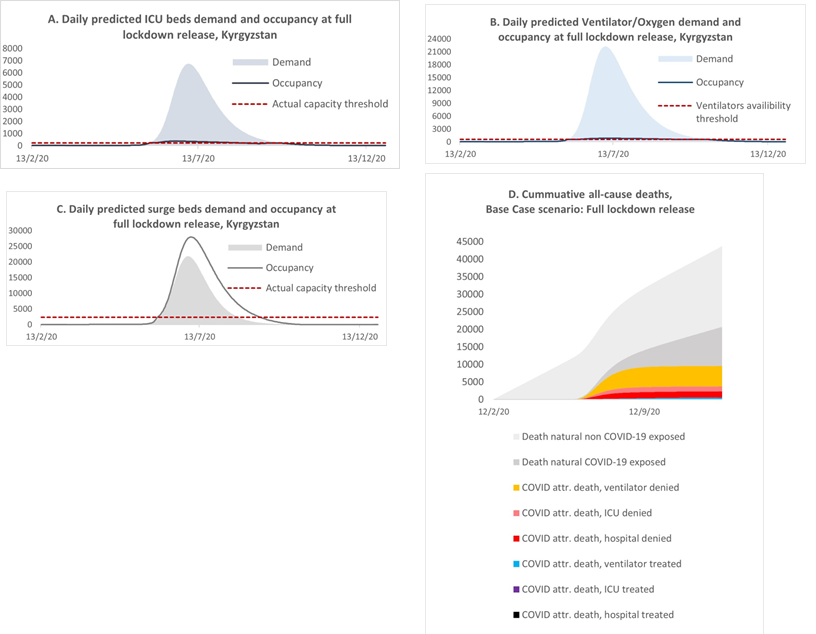
Figure 3: Daily predicted ICU bed (A), ventilator/oxygen (B), and surge bed (C) demand and occupancy and (D) cumulative deaths for the full lockdown release scenario.
With the increased pressure on the existing health system, the model predicted an increase in deaths, which in the baseline scenario would reach 6300 by the end of the simulation period. In Figure 3(D), we stratified the expected cumulative mortality into several categories, to reflect the contribution of deaths attributable to COVID-19 to all-cause mortality and to analyse the level of mortality among patients with severe COVID-19 symptoms who received treatment compared with those who could not access the required treatment and resources. The model predicted that the highest proportion of mortality would be among those individuals who did not have access to oxygen treatment, followed by denial of ICU and surge beds. According to the model, the potential contribution of mortality attributable to COVID-19 to all-cause mortality was not as high as in countries with a larger proportion of older people. In the baseline scenario, deaths attributable to COVID-19 would increase the yearly all-cause mortality statistics by about 22.7%. However, it is important to be aware that the model projections did not account for any interplay between COVID-19 with other diseases or factors; therefore, deaths not attributable to COVID-19 were assumed not to be affected by the COVID-19 epidemic. The actual situation with the health system echoed the predicted full lockdown release scenario. The rapid increase in symptomatic cases put tremendous pressure on the health system, which was not prepared for such a heavy influx of patients with severe symptoms, most of whom required treatment with oxygen [11,14,15]. As predicted by the model, the peak of hospital occupancy occurred in July, with a difference of about two weeks compared with the model’s prediction, and comprised 19,774 patients per day as of July 18, 2020 [14]. In addition, hospitals experienced acute shortages of medical staff, personal protective equipment (PPE) and medicaments. Many of the specialists who were available became infected with COVID-19 during the course of their work. Thus, on August 3, 2020, the MoH reported that medical workers comprised approximately 16.8% of all COVID-19 cases, of whom about 43.7% were nurses or lab technicians and 34.7% were doctors [16]. As a result, many patients could not access hospital treatment or medical resources, which contributed to the increase in the number of deaths. The official statistics reported that there were 1362 deaths during June and July [14]. Available evidence suggests that COVID-19 was estimated to be the third most common cause of death in Kyrgyzstan during 2020, with an average of 22 deaths per 100,000 population nationally and 59 cases per 100,000 population in the capital city, Bishkek, which suffered the most during the epidemic [17]. Most of the deaths attributable to COVID-19 were among individuals with severe symptoms of pneumonia. According to the National Statistical Committee, by the time of the peak of the epidemic in July, deaths from pneumonia exceeded the average annual levels seen in previous years. There were 598, 646 and 626 deaths from pneumonia per year in 2017, 2018 and 2019, respectively, whereas between 1 and 17 July, 2020, there were 610 deaths from pneumonia and a total of 887 deaths from the beginning of the year to July 17 [12].
Based on the above, we consider that the model could predict the approximate timing of increased pressure on the health system, as well as insufficiencies in the number of available surge and ICU beds and ventilators/oxygen equipment during the peak of the epidemic. However, the model predicted a higher magnitude of demand for hospital treatment and occupancy than the officially reported actual situation. Moreover, the model’s flexibility for predicting occupancy for ICU and oxygen treatment was lower compared with the actual occurrence, when the lack of surge beds and oxygen devices was improved by the mobilisation of funds from the public and private sectors.
Discussion
The assessment of the hypothetical full lockdown release scenario against the actual course of the epidemic following the release of the strict measures on May 10, 2020, showed that the timing of the model output prediction of the peak had a difference of two weeks compared with the timing of the actual occurrence of the peak. The model’s estimation of the magnitude of the epidemic peak was a few times higher compared with what actually happened during the outbreak. However, it is important to be aware that the official reports of case numbers remain debatable. Hence, some experts estimate the actual number of new symptomatic cases to be at least ten times higher than that of the official reports [18]. The Republican Scientific Centre on Infection Control, under the MoH, estimated there were 1,860,000 cases by the end of June, 2020 [18]. Considering that almost 20% of cases may develop symptoms, the number of symptomatic cases could have reached 370,000, whereas the official number of new cases was 32,000 by the end of July, which included only those individuals who tested positive by PCR or showed symptoms of pneumonia [14]. According to the model, an extensive increase in new cases would result in the health system being overwhelmed and, as a consequence, high mortality rates, which were also overestimated compared with the official data [18]. However, some experts consider that, as with the number of reported new cases, the actual magnitude of deaths was much higher than the reported statistics. According to some health specialists, during the peak of the epidemic in July, 2020, many people may have died at home and those cases were therefore not included in the official statistics [19]. Finally, the situation with the health system during the peak of the epidemic echoed the outcomes predicted by the model, with many patients unable to access hospital treatment and resources as a result of the acute shortages in surge and ICU beds and oxygen aid facilities and equipment, which also led to an increase in the number of deaths. The circumstances around the shortage of surge beds, oxygen equipment and medicaments have gradually improved as a result of tremendous support from the general population and the private sector, who managed to mobilise funds and resources and establish temporary ambulatory hospitals in hotels, sports centres and schools. As a result, in the capital city Bishkek alone, about 62,300 patients were able to receive ambulatory medical support by the end of July, 2020 [18].
Thus, based on the above, we can be confident that the model’s predictions could accurately reflect the actual timing of the epidemic curve, the magnitude of the epidemic peak and the pressure on the health system. However, there are some limitations of this model, associated with a number of uncertainties and assumptions about this novel disease and the effects of related interventions, that must be taken into account. One such limitation is that the model reflected the medium-term projection of the epidemic, where seasonality was not considered due to the limited evidence for this at the beginning of the year. Moreover, contrary to the model’s predictions, Kyrgyzstan experienced a second wave of the epidemic during October and November, as a result of nationwide protests and mass gatherings against the results of parliamentary elections. There were also some methodological limitations. The model was visually fitted, as part of the simulation process, through a web-based application. The particle filtering method has only recently became available, which we plan to apply for further simulations of the epidemic in Kyrgyzstan. Accordingly, it remains unclear whether the visual fitting was appropriate for forecasting the epidemic. However, it is important to note that the primary function of the model was to support real-time decision-making, which urgently required evidence and tools to address the constantly changing situation with regards to the epidemic. Thus, in this use case, the model was fit for purpose, from a qualitative point of view, with its predictions matching the observed outcomes of the decision to release the lockdown in Kyrgyzstan.
References
- Stop COVID KG. COVID-19 Kyrgyzstan (2020).
- CoMo Con The COVID-19 International Modelling Consortium (2020).
- Aguas R, Hupert N, Shretta R, et al. COVID-19 pandemic modelling in context: uniting people and technology across nations. BMJ Global Health (forthcoming).
- KLOOP.
 .
. - Kucharski AJ, Klepac P, Conlan AJK, et al. Effectiveness of isolation, testing, contact tracing, and physical distancing on reducing transmission of SARS-CoV-2 in different settings: a mathematical modelling study. Lancet Infect Dis 20 (2020): 1151-1160.
- Day M. Covid-19: identifying and isolating asymptomatic people helped eliminate virus in Italian village. BMJ 368 (2020): m1165.
- Day M. Covid-19: four fifths of cases are asymptomatic, China figures indicate. BMJ 369 (2020):
- Oran DP, Topol EJ. Prevalence of Asymptomatic SARS-CoV-2 Infection?: A Narrative Review [Internet]. Vol. 173, Annals of internal medicine. NLM (Medline) (2020): 362–7.
- Davies NG, Klepac P, Liu Y, et al. Age-dependent effects in the transmission and control of COVID-19 epidemics. Nat Med 26 (2020).
- COVID-19 Community Mobility Reports (2020).
- Radio Azzattyk
 .
. - NSC KR. Mortality from pneumonia, 2019-2020 [Internet]. National Statistical Committee of the Kyrgyz Republic (2020).
- MoH KR. MoH Prikaz #181 on health system preparedness for the COVID-19 epidemic (2020).
- Akipress.
 .
. - MoH KR. Ministry of Health of the Kyrgyz Republic /
 .
. - Kabar.
 .
. - Kaktus.
 .
. - Radio Azattyk.
 .
. - Radio Azattyk.
 .
. - Otto AM. COVID-19 update: Transmission 5% or less among close contacts [Internet]. The Hospitalist (2020).
- Disaster Response Coordination Unit in the Kyrgyz Republic. Press Centre /
 .
. - Prem K, Cook AR, Jit M. Projecting social contact matrices in 152 countries using contact surveys and demographic data. PLoS Comput Biol 13 (2020):
- National Statistical Committee of the Kyrgyz Republic (2020).
- Linton N, Kobayashi T, Yang Y, et al. Incubation Period and Other Epidemiological Characteristics of 2019 Novel Coronavirus Infections with Right Truncation: A Statistical Analysis of Publicly Available Case Data. J Clin Med 9 (2020):
- Khalili M, Karamouzian M, Nasiri N, et al. Epidemiological Characteristics of COVID-19: A Systemic Review and Meta-Analysis. medRxiv (2020).
- Bi Q, Wu Y, Mei S, et al. Epidemiology and Transmission of COVID-19 in Shenzhen China: Analysis of 391 cases and 1,286 of their close contacts. medRxiv (2020).
- Mizumoto K, Kagaya K, Zarebski A, et al. Estimating the Asymptomatic Proportion of 2019 Novel Coronavirus onboard the Princess Cruises Ship, 2020 [Internet]. medRxiv. Cold Spring Harbor Laboratory Press (2020).
- Novel coronavirus disease 2019 (COVID-19) pandemic: increased transmission in the EU/EEA and the UK – sixth update (2020).
- Verity R, Okell LC, Dorigatti I, et al. Estimates of the severity of coronavirus disease 2019: a model-based analysis. Lancet Infect Dis 20 (2020): 669-677.
- Richardson S, Hirsch JS, Narasimhan M, et al. Presenting Characteristics, Comorbidities, and Outcomes among 5700 Patients Hospitalized with COVID-19 in the New York City Area. JAMA - J Am Med Assoc 323 (2020): 2052-2059.
- Petrilli CM, Jones SA, Yang J, et al. Factors associated with hospitalization and critical illness among 4,103 patients with COVID-19 disease in New York City. medRxiv (2020).
- Zhou F, Yu T, Du R, et al. Clinical course and risk factors for mortality of adult inpatients with COVID-19 in Wuhan, China: a retrospective cohort study. Lancet 395 (2020): 1054-1062.
- Wang Z, Ji J, Liu Y, et al. Survival analysis of hospital length of stay of novel coronavirus (COVID-19) pneumonia patients in Sichuan, China. medRxiv (2020).
- World Population Prospects: Population Division (2020).
- Handwashing. Royal Pharmaceutical Society of Great Britain (2020).
Situation
The number of cases of COVID-19 continues to increase in the Kyrgyz Republic. The first three cases were reported among travellers returning from a pilgrimage to Saudi Arabia on 16 March 2020.
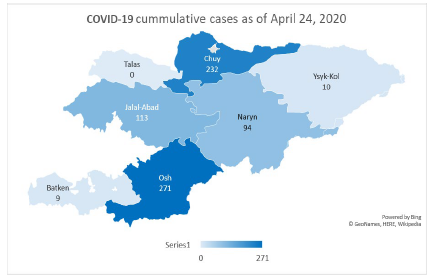
By 24 April, the number of cases had reached 729 (MoH, 2020a). The
majority of cases (393) are concentrated in the south of the country (Osh and Jalalabad provinces), followed by Bishkek (180) and the remote Naryn province (94).
Unlike international trends, 71% of cases have occurred among those aged 20 to 60 years, while cases among those aged more than 60 years accounted for just 12% of cases. The distribution between the sexes is almost equal, with slightly higher rates among females (54%). Health workers account for 26% of cases. As of April 24, 2020, the Ministry of Health of Kyrgyz Republic (MoH KR) has reported eight deaths, mainly among elderly people aged more than 65 years or individuals with pre-existing health conditions. Thus, the case fatality rate (CFR) is 1.1% (MoH, 2020a).
The available data points to a decrease in imported cases but an increase in local transmission, despite the current lockdown and quarantine measures. More evidence is needed to determine the effectiveness of various interventions in the context of Kyrgyzstan. It is possible that the increased detection of cases may be due to improved diagnostic capacity and availability of testing resources.
According to the World Health Organization, different countries exhibit variations in the rates of disease severity, mortality and hospital admissions. In China, about 15% to 20% of cases required hospitalization, of whom 15% had severe symptoms and 5% required ventilation and other intensive care manipulations. In Italy and Spain, between 40% and 55% of positive cases were admitted to hospital, with between 7% and 12% needing intensive care (WHO, 2020b). These variations may be driven by factors such as population structure, efficiency of prevention and control measures, and preparedness and capacity of health systems.
MoH KR has developed a plan for the preparation of hospital capacity and reorganised existing hospitals to treat COVID-19 patients. In total, more than two thousand hospital beds, including 226 in intensive care units (ICUs) will be set up, in several stages (MOH Order #181, March 23, 2020). The current stock of respiratory ventilators is 625 devices, 74 of which require maintenance (MoH, 2020b).
The government responded rapidly to the COVID-19 pandemic and introduced emergency measures in two major cities (Bishkek and Osh) and in the affected Osh and Jalalabad provinces on 22 March, 2020, with a closure of borders; a travel ban; testing, isolation and quarantining; physical distancing; and health communication. In response to the growing rates of infection, the country declared a state of emergency from 25 March to mid-April and later extended the lockdown to the beginning of May. Stricter measures, including curfews, checkpoints and the closure of all businesses except essential ones (e.g. grocery stores, pharmacies and gas stations), were rolled- out under the state of emergency. As lockdowns can affect people’s wellbeing, and socio-economic challenges increase, there is an urgent need for clear evidence to inform the country’s next steps to tackle the pandemic, while acknowledging the wider health, social and economic consequences of any steps taken.
Alternative interventions/scenarios
In response to the current situation, the Kyrgyz modelling group, in cooperation with the international COVID-19 Modelling Consortium (CoMo Consortium) and the Soros Foundation in the Kyrgyz Republic, projected possible courses of the pandemic in the country, through modelling several scenarios with varying interventions. The team applied the mathematical modelling framework developed by the Oxford Modelling Group for Global Health (OMGH) in collaboration with the CoMo Consortium. The model can be used to estimate the impact of potential intervention strategies on the course of COVID-19 epidemics in individual countries and help to inform policy decisions. We included three levels of potential disruption to the social and economic situation in Kyrgyzstan (Table 1) and projected five scenarios with various interventions and timelines, to address the following questions:
- What would be the scale of the epidemic if lockdown is fully lifted after 10 May, 2020?
- What would be the impact of ‘low disruptive interventions’ after lifting the lockdown on 10 May, 2020?
- What would be the impact of ‘medium disruption interventions’ after lifting the lockdown on 10 May, 2020?
- What would be the impact of ‘high disruptive interventions’ after lifting the lockdown on 10 May, 2020?
Table 1. Level of disruption of intervention scenarios on social life and the economy.
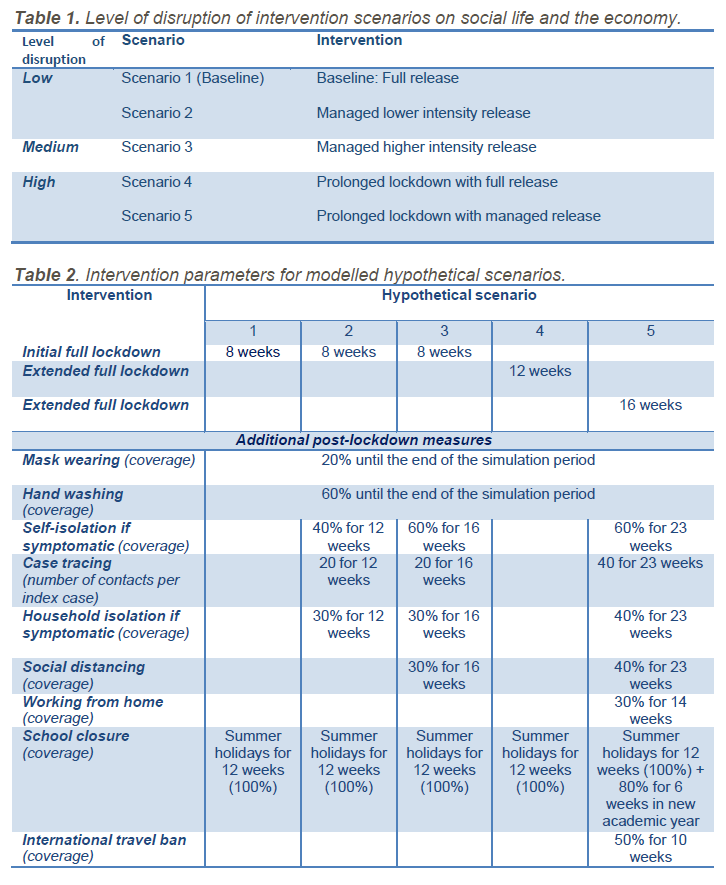
Table 2. Intervention parameters for modelled hypothetical scenarios.
Limitations
- We need to take into account uncertainties about the virus and its epidemiology, as well as assumptions regarding current intervention coverage and efficacy affected by social, cultural and economic The model outputs will change as we learn more about the disease and the impact of interventions on the nature of the disease and as we receive more reliable data on intervention intensity and coverage.
- The current model did not include vaccination as a pharmaceutical intervention for the prevention of COVID-19 infection, although this option was foreseen and the modelling tool includes the assumption of its availability at a later
- We have not included seasonality due to a lack of evidence on whether this virus will exhibit a seasonal pattern and, if it does, whether this will be a similar pattern to that seen with influenza.
- Another important limitation of this projection is that it did not include an analysis of the effect of high rates of COVID-19 infection among healthcare workers on the health system’s capacity to respond to the epidemic.
Assumptions
- The model is based on the epidemiological data available as of April 24, 2020 (MoH, 2020a). There is a need to continually update the simulations with new data/evidence.
- Due to the unavailability of direct values for intervention coverage, adherence and efficacy, the related model assumptions were based on other existing proxy data and information, including Google Maps analysis of community mobility in countries (Google Map, 2020), the EpiCOVID online survey in Central Asia (EpiCOVID, 2020) and weekly reports of the Disaster Response Coordination Unit in the Kyrgyz Republic (DRCU, 2020).
- The currently accepted global evidence on the nature of COVID-19 disease, which is yet to be updated, was used for the disease parameters (CDC China, 2020; Korean Society of Infectious Diseases et al., 2020; Liu et al., 2020; Riou et , 2020; WHO, 2020a).
- The demographics parameter values for the population age structure were based on United Nations (UN) data for 2019 (UN, 2020).
- The social contact matrices projection for 152 countries (Prem et , 2017) was used to estimate the contact patterns between different age groups in Kyrgyzstan.
Thus, the following outputs should be interpreted in light of the above assumptions and limitations.
Projected model outcomes
There could be unintended consequences of the options chosen, as these projections are for COVID-19 only and do not account for any interplay among other factors or diseases and their impact on vulnerable populations.
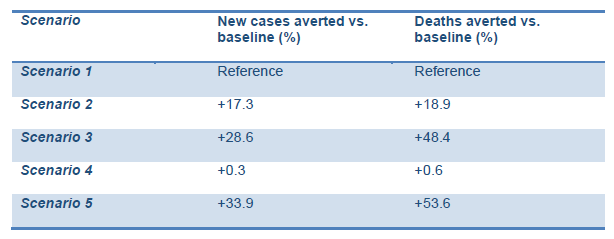
The model predicted comparatively higher rates of new cases and deaths averted compared with the baseline in Scenarios 2 and 3 (lower and higher intensity managed lockdown releases). This includes the lockdown being lifted as planned on 10 May and followed up with:
- self-isolation of symptomatic cases;
- case tracing;
- voluntary quarantine of those who had contact with COVID-19 positive cases;
- social distancing;
- hand hygiene and mask
The ‘highly socially disruptive scenario’, with lockdown extended for 16 more weeks (scenario 5), was predicted to result in the highest percentage of averted new cases and deaths. However, this may result in adverse consequences for the social and economic life of the country and have unintended implications for people’s mental health. It is interesting to note that the extension of the current lockdown without any follow-up interventions may have very little impact on the prevention of new cases and deaths (scenario 4).
Decisions on the strategy should be made with caution given the uncertainty around COVID-19 epidemiology (Graphs 1,2).
Graph 1. Projected impact of intervention scenarios on COVID-19 cases.
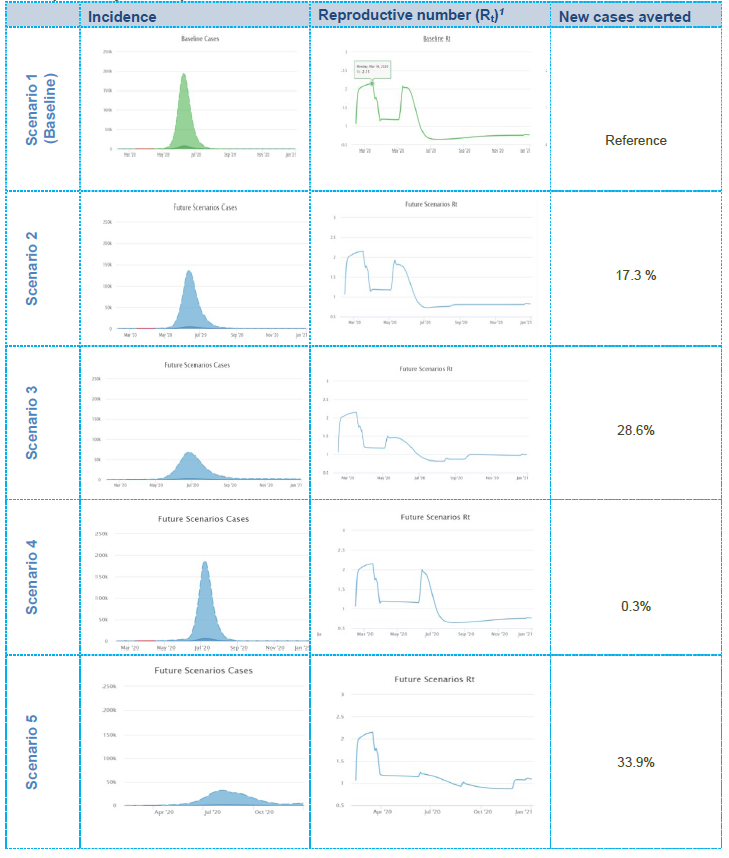
1Note: the reproductive number is an epidemiological value indicating the level of contagiousness of the infection, i.e. it is the expected number of cases generated by one infected person during the period of their disease. If Rt = 1, the epidemic is stabilised; if Rt > 1, the epidemic is increasing; if Rt < 1, the epidemic is decreasing.
- In Scenario 1, the simulation predicts that the epidemic curve may sharply increase after the relaxation of the lockdown and that about 82.7% of the population may become infected in the ensuing months. It should be noted, however, that the majority of individuals may experience mild or no symptoms. Moreover, the reproductive number (Rt), currently balanced at the level of 1.2 to 1.3, may increase to about 2.1 immediately following the relaxation of lockdown then gradually decrease along with increasing immunity within the population as the virus is transmitted (i.e. achieving herd immunity). Note that Scenario 1 is referred as the ‘baseline scenario’ against which the other scenarios will be
- In Scenario 2, the model predicts that, compared with the baseline scenario, the peak may decrease by around 20% and about 17.3% more new cases are likely to be averted. In total, about 65.0% of the population may get infected during the course of the epidemic (the majority with mild or no symptoms). Although an increase in the Rt value after the relaxation of lockdown may still be observed, its trend may be slightly lower compared with the baseline scenario due to the extension of current interventions focussed on those who have symptoms or are diagnosed as COVID-19-positive and those who have had contact with positive cases.
- In Scenario 3, the model predicts that, compared with the baseline scenario, the peak may decrease by 70% and about 28.6% new cases are likely to be In total, about 54.1% of the population may get infected during the course of the epidemic (the majority with mild or no symptoms). Although a slight increase in Rt after the relaxation of lockdown may still be observed, it may decrease to 1.5, with a further decrease over time due to extended (19 weeks) and intensified interventions, focussed mainly on social distancing and those who have symptoms or are diagnosed positive and those who have had contact with positive cases.
- In Scenario 4, the model predicts that the peak may remain as high as in the baseline scenario, but the epidemic curve may move forward to a period roughly equivalent to the extension timeline (an additional 4 weeks). In total, about 82.4% of the population may get infected during the course of the epidemic (the majority with mild or no symptoms). The Rt value may increase to the value equivalent to the baseline scenario and reach about 0 immediately after the relaxation of the lockdown, then gradually decrease as the virus is transmitted throughout the population (i.e. achieving herd immunity).
- Scenario 5 is likely to be the most effective in terms of epidemiological implications, but at the same time it includes highly disruptive interventions being extended for a longer time (an additional 8 weeks) after the initial In this scenario, the model predicts that the peak will be flattened by 90% compared with the baseline option, and about 33.9% more new cases are likely to be averted. Moreover, the Rt value will remain low, indicating a stabilised epidemic throughout the year. In total, about 48.8% of the population may get infected during the course of the epidemic (the majority with mild or no symptoms).
Graph 2. Projected impact of intervention scenarios on cumulative deaths and projected requirements/needs for hospital and ICU beds and ventilation.
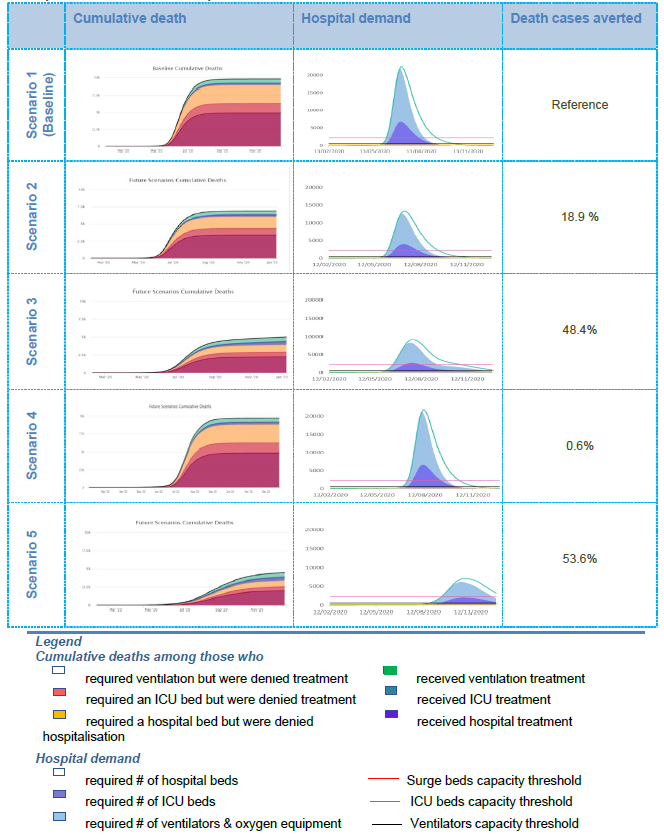
- In Scenario 1, the simulation predicts that, considering relevant interventions and planned hospital beds in general wards, ICU beds and ventilators, the health system will be overwhelmed with the influx of patients during the peak of the As shown in Graph 2 (‘hospital demand’ column), the peak in the number of patients requiring medical assistance will significantly exceed the health system capacity (threshold lines), which will increase the possibility of denying necessary hospital support to many patients. As a result, the number of deaths among those who needed hospitalisation and intensive care support (including lung ventilation), but did not receive the necessary medical assistance, may become significant (refer to the ‘cumulative death’ column). Note that Scenario 1 is referred to as a ‘baseline scenario’, against which the other intervention options will be compared.
- In Scenario 2, the model predicts that the health system will still be highly overwhelmed by the influx of patients during the peak of the However, the number of potential deaths among those who would be denied hospitalisation in the general ward or ICU or who would not be treated with lung ventilation will decrease slightly (‘hospital requirements/needs’ column). This may be due to the decrease in patients as a result of continued interventions focussed on limiting the spread of the infection from positive cases.
- In Scenario 3, the model predicts that the health system will be less burdened compared with the burden in the previous scenarios, although the number of surge and ICU beds and particularly ventilators will still be This can be seen from the ‘cumulative deaths’ in Graph 2, where the number of people in need of ventilators but who have been denied necessary treatment is still high. The lower burden on the health system may be due to fewer patients as a result of continued and intensified interventions focussed on limiting the spread of the infection from positive cases.
- In Scenario 4, the simulation predicts that the health system will be overwhelmed at the same level as in the baseline scenario. As a result, the number of cases and deaths among those who need hospitalisation and intensive care support, including lung ventilation, but do not receive the necessary medical assistance, may become as significant, as in the baseline
- Scenario 5, as the simulation predicts, is the most effective in terms of epidemiological implications, with the least burden on the health system and the lowest number of deaths among those who might have been denied relevant hospital However, as mentioned earlier, this scenario involves the most disruptive interventions for a long period of time (an additional 8 weeks for lockdown plus other low disruptive interventions throughout the year), which is not feasible to implement in Kyrgyzstan.
Conclusion 1: Prevention is essential
It is critical to combine a phased transition after lockdown with key epidemiological prevention interventions, such as quarantine for those who have contact with positive cases, self-isolation if symptomatic, screening (testing), and social distancing to reduce transmission of the infection. Hand hygiene and mask wearing should remain an integral part of any set of measures. Rapid development of an effective, responsive and tailored risk communication strategy, including motivational strategies to encourage adherence to the key preventive interventions among the population, is important.
Conclusion 2: Rapidly scale-up screening and hospital capacities
The model predicts the need for two approaches to be pursued simultaneously: prevention and health system preparedness. A high level of prevention activities may reduce the burden on the health system, but the health system needs to ensure sufficient capacity to accept and treat all patients. Sufficient capacity in the health system for responding to increased demand in COVID-19 testing, contact tracing, quarantine and treatment are crucial for saving lives and reducing risks. A substantial focus on infection prevention control (IPC) is critical to address increasing rates of infected healthcare workers.
Conclusion 3: Uncertainty and updates
All results of the modelling should be used with caution, due to the limited evidence available about the spread of COVID-19 and its epidemiology. The model and its projections should constantly be updated as more evidence becomes available. It is also important to be aware of potential unintended consequences of the options chosen, as the model projections are for COVID-19 only and do not account for any interplay with other factors or diseases and the impact on general and vulnerable populations.
Acknowledgements
We would like to thank the team and all of the contributors and organisations who helped with this project: Ministry of Health of the Kyrgyz Republic, Department of Disease Prevention and Surveillance under the Ministry of Health of the Kyrgyz Republic, Soros Foundation in the Kyrgyz Republic, Public Fund “Institution of Social Development” in the Kyrgyz Republic, and USAID Mission in the Kyrgyz Republic.
Disclaimer: The views expressed in this publication are those of the authors and do not necessarily reflect those of the Oxford Modelling Group for Global Health (OMGH), the COVID-19 Modelling Consortium (CoMo Consortium), the United States Agency for International Development, the United States Government, or the Soros Foundation of the Kyrgyz Republic and/or their funders.
References
CDC China. (2020). The Epidemiological Characteristics of an Outbreak of 2019 Novel Coronavirus Diseases (COVID-19) — China, 2020. China CDC Weekly. https://doi.org/10.46234/CCDCW2020.032
EpiCOVID. (2020). EpiCOVID: Round One.
https://ee.humanitarianresponse.info/x/#YKvCaTJf Google Map. (2020). COVID-19 Community Mobility Report.
Korean Society of Infectious Diseases, Korean Society of Pediatric Infectious diseases, Korean Society of Epidemiology, Korean Society for Antimicrobial Therapy, Korean Society for Healthcare-associated Prevention, & Korea Centers for Disease Control and Infection Control and Prevention. (2020). Report on the Epidemiological Features of Coronavirus Disease 2019 (COVID-19) Outbreak in the Republic of Korea from January
19 to March 2, 2020. Journal of Korean Medical Science, 35(10). https://doi.org/10.3346/jkms.2020.35.e112
Liu, T., Hu, J., Kang, M., Lin, L., Zhong, H., Xiao, J., He, G., Song, T., Huang, Q., Rong, Z.,
Deng, A., Zeng, W., Tan, X., Zeng, S., Zhu, Z., Li, J., Wan, D., Lu, J., Deng, H., … Ma,
- (2020). Transmission dynamics of 2019 novel coronavirus (2019-nCoV). BioRxiv, 2020.01.25.919787. https://doi.org/10.1101/2020.01.25.919787
Prem, K., Cook, A. R., & Jit, M. (2017). Projecting social contact matrices in 152 countries using contact surveys and demographic data. PLoS Computational Biology, 13(9), e1005697. https://doi.org/10.1371/journal.pcbi.1005697
Riou, J., Hauser, A., Counotte, M. J., & Althaus, C. L. (2020). Adjusted Age-Specific Case Fatality Ratio During the COVID-19 Epidemic in Hubei, China. MedRxiv PrePrint. https://doi.org/10.1101/2020.03.04.20031104
- (2020). World Population Prospects - Population Division - United Nations. https://population.un.org/wpp/Download/Standard/Population/
WHO. (2020a). COVID19 Situation reports. https://www.who.int/emergencies/diseases/novel- coronavirus-2019/situation-reports/
WHO. (2020b). Health Systems Respond to COVID-19 Technical Guidance #2 Creating surge capacity for acute and intensive care Recommendations for the WHO European Region (6 April 2020). http://www.euro.who.int/ data/assets/pdf_file/0006/437469/TG2- CreatingSurgeAcuteICUcapacity-eng.pdf
MoH. (2020a). Daily COVID-19 situation report as of April 24, 2020
MoH. (2020b). MoH report on health system preparedness for the COVID-19 epidemic.
DRCU.(2020) Weekly update of Disaster Response Coordination Unit in the Kyrgyz Republic, as of 17 April, 2020
S2 Appendix. Parameters and visual fitting charts
Part I. Model base indicators
General
|
Description |
Value |
Resource |
|
Probability of infection given contact: (0 to 0.2) |
0.033 |
Visually calibrated and based on: [20] |
|
Percentage of all asymptomatic infections that are reported: |
0 |
Assumed based on: [1] |
|
Percentage of all symptomatic infections that are reported: |
12 |
Visually calibrated and based on: [1,13,21] |
|
Percentage of all hospitalisations that are reported: |
90 |
Assumed based on: [1,21] |
|
Social contacts data (country): |
Kyrgyzstan |
[22] |
|
Mean household size: |
4.2 |
[23] |
|
Mean number of infectious migrants per day: |
10^{-5} |
Assumed based on: [21] |
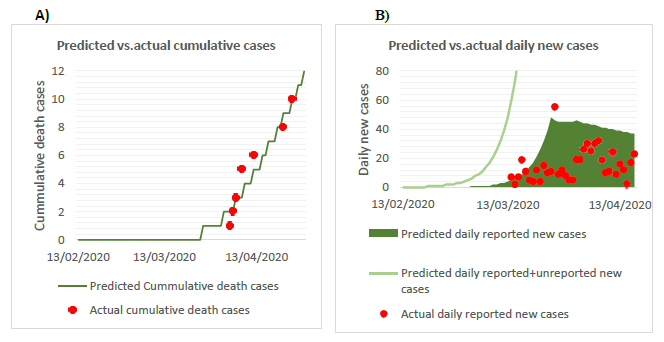
Figure S2. Visual fitting of the projected epidemic curve against actual reported cumulative deaths and daily new cases of COVID-19 (B) as of April 24,B)
B. Disease parameters
|
Description |
Value |
Resource |
|
Average incubation period: (1 to 7 days) |
3.5 |
[24–26] |
|
Average duration of symptomatic infection period: (1 to 7 days) |
4.5 |
[24] |
|
Month of peak infectivity of the virus: (1, 2, …, 12) |
0 |
NA (disabled parameter) |
|
Annual variation in infectivity of the virus: |
0 |
NA (disabled parameter) |
|
Average duration of immunity: (0.5 to 150) |
150 |
NA (disabled parameter) |
|
Probability upon infection of developing clinical symptoms: |
0.55 |
[7,27,28] |
|
Probability upon hospitalisation of requiring ICU admission: |
0.50 |
[29–31] |
|
Probability upon admission to the ICU of requiring a ventilator: |
0.75 |
[30] |
C. Hospitalisation
|
Description |
Value |
Unit |
Resource |
|
Maximum number of hospital surge beds |
2200 |
beds |
[13] |
|
Maximum number of ICU beds without ventilators |
226 |
beds |
[13] |
|
Maximum number of ventilators |
551 |
ventilat ors |
[13] |
|
Relative percentage of regular daily contacts when hospitalised: |
15 |
% |
Estimated in consultation with local clinical hospitals |
|
Scaling factor for infection hospitalisation rate: (0.5 to 4) |
1 |
NA (disabled parameter) |
|
|
Probability of dying when hospitalised (not requiring oxygen): |
5 |
% |
Estimated in consultation with MoH, local clinical hospitals |
|
Probability of dying when hospitalised if requiring oxygen: |
15 |
% |
Estimated in consultation with MoH, local clinical hospitals |
|
Probability of dying when denied hospitalisation (not requiring oxygen): |
20 |
% |
Estimated in consultation with MoH, local clinical hospitals |
|
Probability of dying when denied hospitalisation if requiring oxygen: |
40 |
% |
Estimated in consultation with MoH, local clinical hospitals |
|
Probability of dying when admitted to ICU (not requiring oxygen): |
30 |
% |
Estimated in consultation with MoH, local clinical hospitals and based on: (31) |
|
Probability of dying when admitted to ICU if requiring oxygen: |
55 |
% |
Estimated in consultation with MoH, local clinical hospitals and based on: (31) |
|
Probability of dying when admission to ICU denied (not requiring oxygen): |
70 |
% |
Estimated in consultation with MoH, local clinical hospitals |
|
Probability of dying when admission to ICU denied if requiring oxygen: |
75 |
% |
Estimated in consultation with MoH, local clinical hospitals |
|
Probability of dying when ventilated: |
70 |
% |
Estimated in consultation with MoH, local clinical hospitals and based on: (31) |
|
Probability of dying when ventilator denied: |
95 |
% |
Estimated in consultation with MoH, local clinical hospitals |
|
Duration of hospitalised infection: (1 to 30) |
14 |
days |
Estimated in consultation with MoH, local clinical hospitals and based on: [24,25,32,33] |
|
Duration of ICU infection: (1 to 30) |
20 |
days |
Estimated in consultation with MoH, local clinical hospitals and based on: [24,25,32,33] |
|
Duration of ventilated infection: (1 to 30) |
24 |
days |
Estimated in consultation with MoH, local clinical hospitals and based on: [24,25,32,33] |
D. Age-based fatality rate and infections that lead to hospitalisation
|
Age category/resource (years) |
Age-based relative fatality rate in a well-resourced scenario (%) |
Age-stratum-specific hospitalisation (proportion of all (asymptomatic + symptomatic) infections that lead to hospitalisation) (%) |
|
[29] |
[29] |
|
|
0–4 |
0.0016 |
0 |
|
5–9 |
0.0016 |
0 |
|
10–14 |
0.007 |
0.04 |
|
15–19 |
0.007 |
0.04 |
|
20–24 |
0.031 |
1.1 |
|
25–29 |
0.031 |
1.1 |
|
30–34 |
0.26 |
3.43 |
|
35–39 |
0.26 |
3.43 |
|
40–44 |
0.48 |
4.25 |
|
45–49 |
0.48 |
4.25 |
|
50–54 |
0.6 |
8.2 |
|
55–59 |
0.6 |
8.2 |
|
60–64 |
1.9 |
11.8 |
|
65–69 |
1.9 |
11.8 |
|
70–74 |
4.3 |
16.6 |
|
75–79 |
4.3 |
16.6 |
|
80–84 |
7.8 |
18.4 |
|
85–89 |
7.8 |
18.4 |
|
90–94 |
7.8 |
18.4 |
|
95–99 |
7.8 |
18.4 |
|
100+ |
7.8 |
18.4 |
E. Population structure, birth and death rates
|
Age category |
Population |
Number of births per person (i.e. 0.5* births per woman) per day |
Deaths per person per day |
|
[34] |
[34] |
[34] |
|
|
0–4 |
760,255 |
0.0 |
0.0000101605 |
|
5–9 |
769,195 |
0.0 |
0.0000007304 |
|
10–14 |
600,626 |
0.0 |
0.0000009053 |
|
15–19 |
500,075 |
0.0000448688 |
0.0000015779 |
|
20–24 |
514,389 |
0.0002696000 |
0.0000022355 |
|
25–29 |
568,551 |
0.0002296603 |
0.0000027381 |
|
30–34 |
572,187 |
0.0001459984 |
0.0000038920 |
|
35–39 |
442,518 |
0.0000888265 |
0.0000059593 |
|
40–44 |
361,459 |
0.0000250881 |
0.0000095105 |
|
45–49 |
324,976 |
0.0000012351 |
0.0000134190 |
|
50–54 |
295,973 |
0.0 |
0.0000201361 |
|
55–59 |
285,462 |
0.0 |
0.0000270330 |
|
60–64 |
220,069 |
0.0 |
0.0000408832 |
|
65–69 |
143,755 |
0.0 |
0.0000581985 |
|
70–74 |
78,619 |
0.0 |
0.0001209308 |
|
75–79 |
32,595 |
0.0 |
0.0004064232 |
|
80–84 |
32,507 |
0.0 |
0.0004353677 |
|
85–89 |
15,592 |
0.0 |
0.0004875172 |
|
90–94 |
4,435 |
0.0 |
0.0005742387 |
|
95–99 |
897 |
0.0 |
0.0006177715 |
|
100+ |
56 |
0.0 |
0.0098953750 |
Part II. Intervention indicators
A. Intervention adherence/efficacy
|
Category |
Description |
Value |
Resource |
|
Self-isolation if symptomatic |
Adherence: |
50 |
Assumed following consultations with local experts |
|
Screening (index tracing) |
Overdispersion: (1, 2, 3, 4 or 5) |
4 |
Assumed following consultations with local experts and based on [13] |
|
Test sensitivity: |
80 |
Based on: [13] and consultations with local experts |
|
|
Household isolation (when symptomatic) |
Days in isolation for an average person: |
14 |
Assumed following consultations with local experts and based on: [21] |
|
Days to implement maximum quarantine coverage: (1 to 5) |
2 |
Assumed following consultations with local experts |
|
|
Decrease in the number of other contacts when quarantined: |
10 |
Assumed following consultations with local experts |
|
|
Increase in the number of contacts at home when quarantined: |
100 |
Assumed following consultations with local experts |
|
|
Social distancing |
Adherence: |
100 |
Based on the assumption that all following social distancing will have been doing it with 100% efficacy. Therefore, in hypothetical scenarios, this parameter will only count for such people |
|
Handwashing |
Efficacy: (0–35%) |
5 |
Assumed following consultations with local experts and based on [35] |
|
Mask wearing |
Efficacy: (0–25%) |
5 |
Assumed following consultations with local experts |
|
Working at home |
Efficacy: |
80 |
Assumed following consultations with local experts |
|
Home contact inflation due to working from home: |
10 |
||
|
School closures |
Efficacy: |
80 |
Assumed following consultations with local experts |
|
Home contact inflation due to school closure: |
10 |
||
|
Shielding the elderly |
Efficacy: |
95 |
Assumed following consultations with local experts |
|
Minimum age for shielding the elderly: (0 to 100) |
70 |
||
|
International travel ban |
Efficacy: |
80 |
Assumed following consultations with local experts and based on: [21] |
