Contamination Indices and Heavy Metal Concentrations in Soils in Okpoko and Environs, Southeastern Nigeria
Article Information
Nwankwoala HO1* and Ememu AJ2
1Department of Geology, University of Port Harcourt, Nigeria
2Department of Geology, Gregory University Uturu, Abia State, Nigeria
*Corresponding Author: Nwankwoala HO, Department of Geology, University of Port Harcourt, Nigeria
Received: 01 April 2018; Accepted: 22 April 2018; Published: 22 April 2018
Citation: Nwankwoala HO, Ememu AJ. Contamination Indices and Heavy Metal Concentrations in Soils in Okpoko and Environs, Southeastern Nigeria. Journal of Environmental Science and Public Health 2 (2018): 77-95.
View / Download Pdf Share at FacebookAbstract
This study is carried out to assess the soil and ground water quality in Okpoko and Environs in Anambra State. Fifteen soil and groundwater samples were collected and analyzed for physico-chemical, heavy metals and hydrocarbon content. Soils were sampled at 15cm and 30 cm depth. Heavy metals in soil and groundwater were analyzed using Atomic Absorption Spectrometer. Grain size analysis shows that top-soils (0-15 cm) and sub-soils (15-30 cm) in the area are predominantly sands (>70%), and soil classification scheme based on SAR (<13), pH (<8.5) and EC (>4 μS/cm) shows that the soils are saline. Apart from Ni, all the other metals show concentrations that decrease with depth. Total Petroleum Hydrocarbons (TPH) ranges from 109.43 to 2112.64 mg/kg and 105.57 to 1747.82 mg/kg in topsoil and sub-soils in the area. The average TPH content is 654.01 ± 582.12 and 568.27 ± 502.11 mg/kg in topsoil and sub-soils respectively, and 54.43 and 16.63 mg/kg at control site. The TOC content is higher in the vicinity of the fuel filling and service station than at the control site which is an indication of anthropogenic influences. The TPH content generally decreases with depth and is lower at the control than at the vicinity of the fuel filling and service station. Apart from Fe and Mn, all other metal concentration exceeds those of the control. The metal concentrations were within DPR regulatory limits for safe agricultural soils. Assessment of anthropogenic influences on the soil quality in the area with the control site as baseline was accomplished using soil quality models including: Contamination Index (CI), Pollution Load Index (PLI), Modified Contamination Degree (mCD), Geo-accumulation Index (Igeo), and Nemerov Integrated Pollution Index (NIPI) which shows that the soils are heavily polluted from the activities at the fuel filling and service stations in the area. Regular soil and groundwater assessment is recommende
Keywords
Soil, Heavy metals, Contamination, Pollution, Hydrocarbon content, Okpoko
Soil articles Soil Research articles Soil review articles Soil PubMed articles Soil PubMed Central articles Soil 2023 articles Soil 2024 articles Soil Scopus articles Soil impact factor journals Soil Scopus journals Soil PubMed journals Soil medical journals Soil free journals Soil best journals Soil top journals Soil free medical journals Soil famous journals Soil Google Scholar indexed journals Heavy metals articles Heavy metals Research articles Heavy metals review articles Heavy metals PubMed articles Heavy metals PubMed Central articles Heavy metals 2023 articles Heavy metals 2024 articles Heavy metals Scopus articles Heavy metals impact factor journals Heavy metals Scopus journals Heavy metals PubMed journals Heavy metals medical journals Heavy metals free journals Heavy metals best journals Heavy metals top journals Heavy metals free medical journals Heavy metals famous journals Heavy metals Google Scholar indexed journals Contamination articles Contamination Research articles Contamination review articles Contamination PubMed articles Contamination PubMed Central articles Contamination 2023 articles Contamination 2024 articles Contamination Scopus articles Contamination impact factor journals Contamination Scopus journals Contamination PubMed journals Contamination medical journals Contamination free journals Contamination best journals Contamination top journals Contamination free medical journals Contamination famous journals Contamination Google Scholar indexed journals Pollution articles Pollution Research articles Pollution review articles Pollution PubMed articles Pollution PubMed Central articles Pollution 2023 articles Pollution 2024 articles Pollution Scopus articles Pollution impact factor journals Pollution Scopus journals Pollution PubMed journals Pollution medical journals Pollution free journals Pollution best journals Pollution top journals Pollution free medical journals Pollution famous journals Pollution Google Scholar indexed journals Hydrocarbon content articles Hydrocarbon content Research articles Hydrocarbon content review articles Hydrocarbon content PubMed articles Hydrocarbon content PubMed Central articles Hydrocarbon content 2023 articles Hydrocarbon content 2024 articles Hydrocarbon content Scopus articles Hydrocarbon content impact factor journals Hydrocarbon content Scopus journals Hydrocarbon content PubMed journals Hydrocarbon content medical journals Hydrocarbon content free journals Hydrocarbon content best journals Hydrocarbon content top journals Hydrocarbon content free medical journals Hydrocarbon content famous journals Hydrocarbon content Google Scholar indexed journals Okpoko articles Okpoko Research articles Okpoko review articles Okpoko PubMed articles Okpoko PubMed Central articles Okpoko 2023 articles Okpoko 2024 articles Okpoko Scopus articles Okpoko impact factor journals Okpoko Scopus journals Okpoko PubMed journals Okpoko medical journals Okpoko free journals Okpoko best journals Okpoko top journals Okpoko free medical journals Okpoko famous journals Okpoko Google Scholar indexed journals soil articles soil Research articles soil review articles soil PubMed articles soil PubMed Central articles soil 2023 articles soil 2024 articles soil Scopus articles soil impact factor journals soil Scopus journals soil PubMed journals soil medical journals soil free journals soil best journals soil top journals soil free medical journals soil famous journals soil Google Scholar indexed journals land disposal of wastes articles land disposal of wastes Research articles land disposal of wastes review articles land disposal of wastes PubMed articles land disposal of wastes PubMed Central articles land disposal of wastes 2023 articles land disposal of wastes 2024 articles land disposal of wastes Scopus articles land disposal of wastes impact factor journals land disposal of wastes Scopus journals land disposal of wastes PubMed journals land disposal of wastes medical journals land disposal of wastes free journals land disposal of wastes best journals land disposal of wastes top journals land disposal of wastes free medical journals land disposal of wastes famous journals land disposal of wastes Google Scholar indexed journals groundwater articles groundwater Research articles groundwater review articles groundwater PubMed articles groundwater PubMed Central articles groundwater 2023 articles groundwater 2024 articles groundwater Scopus articles groundwater impact factor journals groundwater Scopus journals groundwater PubMed journals groundwater medical journals groundwater free journals groundwater best journals groundwater top journals groundwater free medical journals groundwater famous journals groundwater Google Scholar indexed journals food articles food Research articles food review articles food PubMed articles food PubMed Central articles food 2023 articles food 2024 articles food Scopus articles food impact factor journals food Scopus journals food PubMed journals food medical journals food free journals food best journals food top journals food free medical journals food famous journals food Google Scholar indexed journals
Article Details
1. Introduction
Soil is the thin layer of organic and inorganic materials that envelopes the Earth's rocky surface. The organic portion, which is got from the decayed remains of plants and animals, is concentrated in the dark uppermost topsoil. The inorganic portion made up of rock fragments, was formed over thousands of years by physical and chemical weathering of bedrock. Productive soils are important for agriculture in order to supply the world with more of it [1].
Man’s activity in the environment has led to the pollution of soil mostly by chemical contaminants. Currently in developing countries like Nigeria where estimates have been made that; there is large number of illiteracy in the country, lack of awareness on how to exterminate the problem of soil pollution. The level of heavy metals in soil can affect the quality of food, groundwater, microorganism’s activity, plant growth etc. [2].
Heavy metal contamination of urban topsoil has been of great concern as regards to their harmfulness, persistence and non-degradability in the environment [3-6]. Unfavorable effects of high concentrations of heavy metals to soil functions, soil microbial community composition and microbial growth have long been distinguished under both field and laboratory conditions [7]. Heavy metal contamination of urban topsoil is usually deduced from man-made sources such as emissions from automobile exhaust, waste incineration, land disposal of wastes, use of agricultural inputs, emissions from industrial processes and wet or dry atmospheric deposits [4].
There has been little attention given to surrounding of automobile-workshops and fuel filling stations, which are also liable to pollution arising from gasoline combustion exhausts, lubricating oil spills, and other chemical inputs to automobile operations. Since the activity of auto-mechanics and fuel filling stations are major routes for entry of heavy metals into the environment to cause heavy metal contamination of soil and drinking wells and crops, monitoring heavy metal contamination of soils is therefore imperative.
2. The Study Area Description
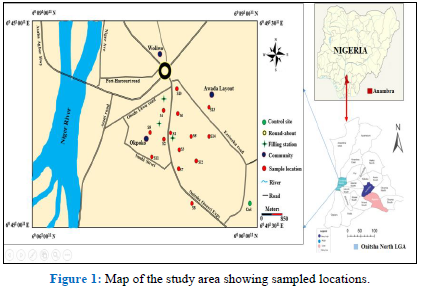
The area of study is located in Onitsha North Local Government Area of Anambra State and bounded geographically by longitudes 6 6 N to 6 9 N and latitudes45 6 to 6 49 3 igure1). Communities situated within the study area include Woliwo and Awada layout on the eastern part of the area. The town within which the site is located is thickly populated. Several fuel filling and service stations are cited at very close proximities. The major station in the area is located along Onitsha-Owerri Expressway at about 20 m from the main road, about 30 m from Power Holding Company of Nigeria (PHCN). High Tension cable, about 50 m from residential buildings, about 200 m from New motor parts dealers market, about 540 m from St. Lwangas Hospital
and Maternity, School of Health and Technology, about 300 m from Sako Oil and Gas ltd fuel filling station at the left hand side of the road, and about 400m from Lake Side Petroleum filling station on the right hand side of the road. Generally, the study area has very good road network and link roads. Two major rivers are responsible for draining the area which includes the Niger River and its major tributary, Ulasi River. However, there are local creeks and ponds all over the vicinity of the area [8].
The Anambra Basin which includes the study area is located at the southwestern extreme of the Benue Trough formed after the Santonian tectonic depression, dating back to 84 MYA [9]. It is a Cretaceous sedimentary domain partly bounded between the southern Benue Trough below and the Niger Delta Basin above. 1t originated following the subsidence of a platform in the southern Benue Trough, concurrent with the lateral translocation of the depocentres during the Santonian thermotectonic event that folded and was also elevated the Abakaliki region [10].
The basin is believed to have been formed as a direct impact of the stresses generated by the movement along the fracture zones. It is bounded to the west by the Precambrian basement complex rocks of the Western Nigeria and on the east by the Abakaliki Anticlinorium. At the Southern part, the boundary is at Onitsha, which is the northern-most limit of the Niger delta basin. The northern boundary of the Anambra basin is not well defined. The basin is connected with the NW-SE trending Bida Basin. Before the Santonian period, the south-western area of its rift valley was the tectonically stable Anambra platform. The Santonian compressional event was followed by magmatism, folding and faulting, which led to the formation of the Abakaliki Anticlinoruim. To the west and southward areas of the Anticlinorium was the depocentre, creating the Anambra and the Afikpo basins respectively [11]. Subsidence in these basins continued after the Santonian compression [12]. The 1sostatic response to the Early Cretaceous Crustal thinning and post drift thermal relaxation of the lithosphere was believed to be due to the accelerated subsidence that continued till the Eocene.
3.1 Soil sampling and analysis
Soil sampling was done at randomly selected sites in Okpoko and Environs, Southeastern Nigeria. A total of thirty soil samples were collected from fifteen (15) locations at 0 – 15 cm and 15-30 cm with the aid of a hand auger and measuring tape. Care was taken to wash and clean the auger before sampling each location in order not to contaminate the samples. Over one kilogram of soil sample was collected at each sampled depth in pre-labelled polythene bags, after which they were transported to the laboratory for digestion and analysis.
Soil pH values were determined in CaCl2 solutions using a Mettler Toledo Seven Easy pH Meter. The conductivity meter was used to take soil conductivity measurements. Total Organic Carbon of the soil samples were determined by the Walkley-Black Titrimetric Method while Dumas method was used for nitrogen. Heavy metal contents of each digest were determined by an Atomic Absorption Spectrometer (Perkin-Elmer A analyst, 200).
3.2 Heavy metals determination
Heavy metals were determined using an Atomic Absorption Spectrophotometer as described in APHA-AWWA-WPCF [13]. This involved direct Aspiration of the sample into an air/acetylene or nitrous oxide/acetylene flame generated by a hollow cathode lamp at a specific wavelength peculiar only to the metal programmed for analysis. For every metal investigated, standards and blanks were prepared and used for calibration before samples were aspirated. Concentrations at specific absorbance displayed on the data system monitor for printing. Limit of detection was set at <0.001 mg/L. All the metals determined from soil samples are; As, Cu, Ni, Fe, Pb, Zn, Cr, Cd and Mn and were reported in mg/kg (soil samples).
3.3 Soil pollution indices
Pollution assessment models are indicators used to assess the presence and intensity of anthropogenic contaminant deposition on soils. In this study, the following pollution assessment models were employed: Contamination Index (CI), Pollution Load Index (PLI), Modified Contamination Degree (mCD), Geo-accumulation Index (Igeo), Nemerow Integrated Pollution Index (NIPI) and anthropogenicity (APn%).
3.3.1 Contamination index (CI): The contamination factors were derived by using the CI equation as defined by

Where Cn = measured metal concentration and Bn = background concentration from control site. The CI classification scheme is presented in Table 1.
3.3.2 Pollution load index (PLI): The PLI gives a generalized assessment on the level of soil contamination. The PLI is obtained using Tomlinson (1980) approach as follows:

where, CF= contamination factor; and n = number of metals.
The PLI classification scheme is presented in Table 1.
3.3.3 Geo-accumulation index (Igeo): The Igeo enables the assessment of contamination by comparing the present heavy metals concentrations and the original pre-industrial concentrations in the soils. It is computed by the following the Muller (1969) equation:

where, Cn= measured metal concentration and Bn= background/control values of that metal obtained from the control site. The constant 1.5 is introduced by Lu et al. to minimize the effect variations in the background concentrations which may be attributed to lithologic differences. The Igeo classification scheme is presented in Table 1.
3.3.4 Modified contamination degree (mCD): The mCD is an empirical assessment of the overall degree of contamination by pollutants in an area. The mCD was calculated as defined by Hakanson [15] as follows:

where Cf = contamination factor, n = number of analyzed metals, and is th metal.
3.3.5 Nemerow integrated pollution index (NIPI): The NIPI was also employed to assess the overall pollution integrity of the area. NIPI was calculated as defined by Nemerow (1985) as:

Where Imean=average concentration of all pollution indices considered, and Imax= maximum pollution index. The NIPI classification scheme is presented in Table 1.
3.3.6 Anthropogenicity (Apn%): Anthropogenicity (Apn%) measures directly the anthropogenic influence on the metal concentrations in terms of percentage. It is calculated as follows:

Where, µ = measured concentration, while Bn=background value. The background values used for the calculation of anthropogenicity are world average shale values in mg/kg adopted from Edori and Kpee, (2017). The values are Fe = 47200, Zn = 95, Pb = 20, Cu = 45, Ni = 68, Mn= 850 and Cd = 0.3.
4. Results and Discussion
4.1 Soil composition
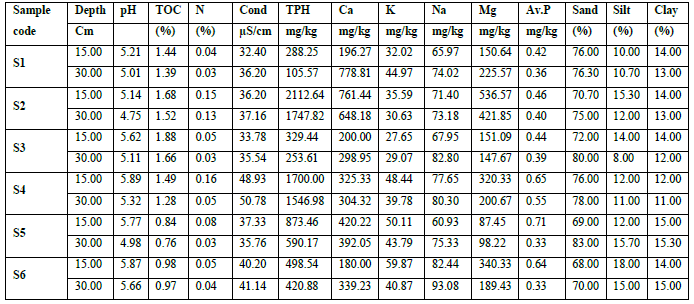
The soil in the area is predominantly alluvium composed of predominantly sands which is brownish in color with some dark patches. The sand composition in the area ranges from 68 to 82% in the top-soil (15 cm depth) and 70 to 85% in the sub-soil (30 cm depth) (Table 1). The average sand composition is lower in the top-soil (74.5%) than in the sub-soil (79.45%) while at the control site 4km away, sand content is relatively higher at in the top-soil (80.20%) than at the sub-soil (76.5%). The average composition of silt is higher than clay in the study area including the control site. The sandy nature of the soil of the study area aids infiltration of contaminants and increases the pollution pathway for contaminants.
The pH of soil in the area ranges from 5.14 to 6.21 in the top-soil and 4.75 to 6.19 in the sub-soil. The average pH in the top-soil is 5.77 ± 0.30 and 5.51 ± 0.43 in the subsoil. This shows that the soils in the area are predominantly acidic and the acidity decreases with depth, whereas, at the control site, the soil acidity generally increases with depth (5.35 in top-soil, 4.75 in sub-soil). Although plants have begun to thrive under varying pH conditions, the optimum pH for most agricultural soils is between 5.5 - 7.5 (Queensland Department of Environment and Heritage Protection, 2017).
 |
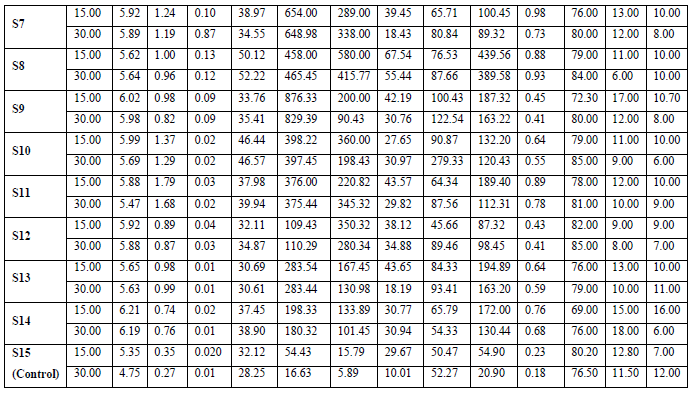 |
Table 1: Results of physicochemical, hydrocarbons and sieve analysis for soils from the study area.
 |
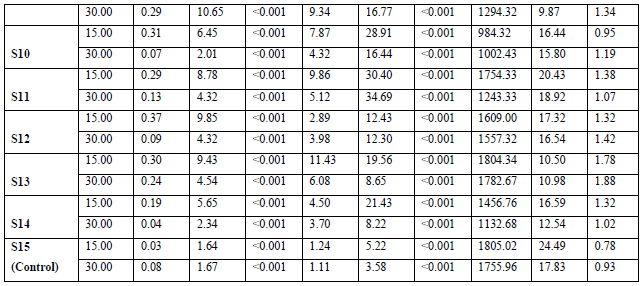 |
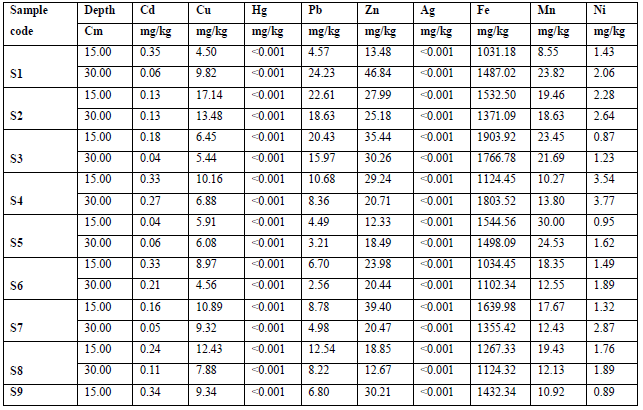
Table 2: Results of heavy metal concentration in soils from the study area.
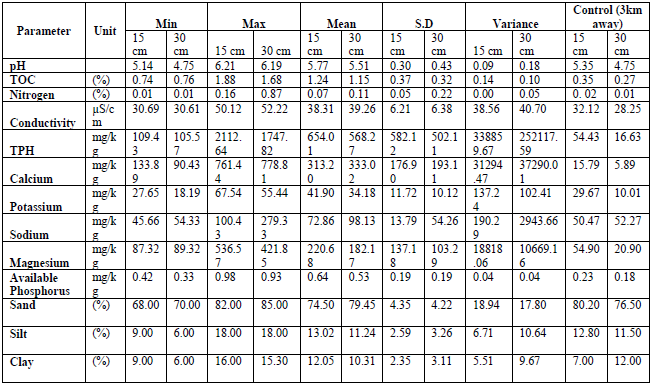
Table 3: Summary of univariate statistical analysis for soils in the study area.
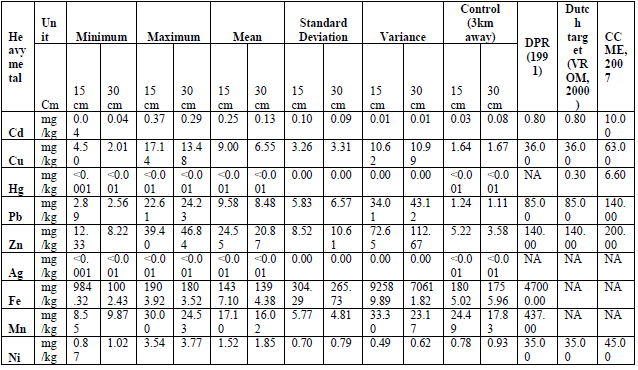
Table 4: Summary of univariate statistical analysis for heavy metals in soils from the study area.
The average pH values in the topsoil are within this range while pH of the subsoil slightly deviates from this range. As soils becomes increasingly acidic, important nutrient like Phosphorus becomes less available to plants which results in reduced crop yield. Available Phosphorus in the topsoil ranges from 0.42 to 0.98 mg/kg with an average value of 0.64 ± 0.19 mg/kg, and 0.33 to 0.93 mg/kg with an average of 0.53 ± 0.19 mg/kg in subsoil. Generally available Phosphorus decreases with depth. The value of Phosphorus is lower at the control site and also decreases from the top-soil (0.23 mg/kg) to the sub-soil (0.18 mg/kg). Nitrogen concentration decreases with depth, and ranges from 0.01 to 0.16% and 0.1 to 0.87% in the top-soil and sub-soil respectively. The concentration of nitrogen is lower at the control site and generally increases with depth. The presence of Nitrogen and Phosphorus are indicators of agrochemical usage on the soil.
Total Organic Carbon (TOC) is generally very low in both topsoil (average 1.24%), subsoil (average 1.15%) and at the control site. The TOC content is higher in the vicinity of the fuel filling and service station than at the control site which is an indication of anthropogenic influences. Total Petroleum Hydrocarbons (TPH) ranges from 109.43 to 2112.64 mg/kg and 105.57 to 1747.82 mg/kg in topsoil and sub-soils in the area. The average TPH content is 654.01 582.12 and 568.27 ± 502.11 mg/kg in topsoil and sub-soils respectively, and 54.43 and 16.63 mg/kg at control site. The TPH content generally decreases with depth and is lower at the control than at the vicinity of the fuel filling and service station. TPH are usually derived from petroleum products such as diesel, kerosene, engine oil, etc. Hence, the high concentrations are an indication of contribution from activities at the filling station.
Electrical conductivity (EC), calcium (Ca), magnesium (Mg), sodium (Na) and potassium (K) concentrations are relatively higher in the vicinity of the fuel station than at the control site in both the topsoil and the subsoil respectively. Average concentration of potassium is 41.90 and 34.18 mg/kg in topsoil and subsoil while 29.67 and 10.01 mg/kg at the control. Average Mg content is 220.68 and 182.17 mg/kg in topsoil and subsoil respectively, whereas, 54.90 and 20.90 mg/kg at the control. The average concentration of potassium and magnesium is higher in the topsoil than subsoil in both the vicinity of the fuel station and the control site. Average Na content is 72.86 and 98.13 mg/kg in topsoil and subsoil, whereas 50.47 and 52.27 mg/kg at control site. These results show that Na generally increases with depth in the area. Calcium concentration ranges from 133.89 to 761.44 mg/kg, with mean and SD of 313.20 ± 176.90 mg/kg in topsoil, and 90.43 to 778.81 mg/kg, with mean and SD of 333.02 ± 193.11 in subsoil. The concentration of calcium increases with depth at the vicinity of the fuel filling and service station and decreases with depth at the control site.
4.2 Heavy metal content
In order of decreasing magnitude, the average heavy metal content in top-soils and sub-soils of the study area are as follows; Fe (1437.10 and 1394.38 mg/kg) > Zn (24.55 and 20.87 mg/kg) > Mn (17.10 and 16.02 mg/kg) > Pb (9.58 and 8.48 mg/kg) > Cu (9 and 6.55 mg/kg) > Ni (1.52 and 1.85 mg/kg) > Cd (0.25 and 0.13 mg/kg). Apart from Ni, all the other metals show concentrations that decrease with depth. Apart from Fe and Mn, all other metal concentration exceeds those of the control. The average concentration of all the metals were compared with DPR (2002) regulatory limits for agricultural soils, and the results shows that there were all within these guidelines (Figure 2 and 3). Also, comparing the results of this study with Canadian soil quality guidelines [16] and Netherlands target values for agricultural soils (VROM) [17], showed that there were safe for agricultural purposes.
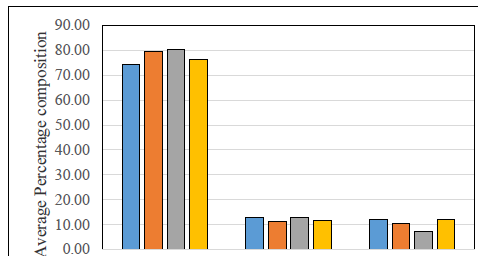
Figure 2: Average soil grain size composition in the study area compared with the control site.
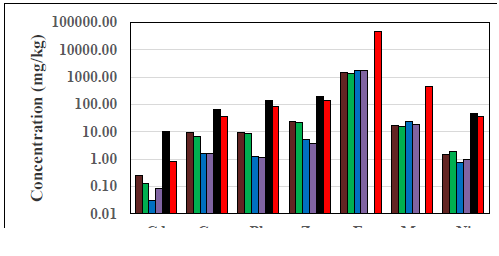
Figure 3: Average heavy metal composition in soil compared with the control, DPR (2002) and CCME (2007).
4.3 Soil classification
Sodium Adsorption Ratio is a widely accepted index for characterizing soil sodicity, which describes the proportion of sodium to calcium and magnesium in soil solution. SAR values obtained ranged from 0.48 to 1.22, with mean of 0.82 ± 0.20 in the topsoil and 0.55 to 3.84, with mean value of 1.18 ± 0.82. The SAR values obtained from this study are lower than those at the control, with values of 1.34 in topsoil and 2.25 in subsoil. Although the SAR values obtained in this study are relatively very low, it generally increases with depth. Higher values of SAR indicate loamy sand, clay loam and clay soil. However, values of SAR in this study indicate that the textural class was neither of the above class. This agrees with the textual class established through particle size distribution in this study. Soil classification based on SAR, EC and pH as adopted from Scherer (1996), shows that soils in the area belong to the saline soil class, having EC values >4 µS/cm, pH values <8.5 and SAR values <13.
4.4 Pollution assessment
4.4.1 Contamination index (CI): The results of contamination index for the top-soils in location S1, S4, S9, S10 and S13 showed that the soils are moderately contaminated to very severe polluted with heavy metals (Table 5). Cadmium is the main contributor to the soil pollution in all these locations. Top-soils in location S2 and S3 are very severely polluted to extremely polluted, whereas in location S7 and S14, the soils are severely contaminated to severely-polluted. Soils in location S5 are very slightly contaminated to moderately-polluted. Similar status exists in location S6 and S12, where the top-soils are slightly contaminated to very severely-polluted with heavy metals. The sub-soil status shows that location S5, S6, S7, S8 and S13 shares similarity in their quality, having slightly contaminated to slightly polluted soils. Location S2 and S11 is composed of very slightly contaminated to very slightly polluted soils. The sub-soils in S1 are slightly contaminated to extremely polluted, while in S14, the soils are moderately contaminated to moderately-polluted. The results of contamination index show that the quality of soil in the study area is entirely deteriorated with respect to the control site.
4.4.2 Modified contamination index (mCD): The result shows that the top-soils in the area moderately contaminated to highly contaminated, whereas, the sub-soils range from uncontaminated to highly-contaminated with heavy metals. The top-soils in location S1, S5, S12 and S14 are moderately contaminated with heavy metals while at the remaining locations, the top-soils are highly polluted with heavy metals (Table 5). In the sub-soil, S1, S2 and S3 are highly contaminated, while soils in S10 show low degree of contamination, and S14 is uncontaminated. Location S4, S5, S6, S7, S8 and S9 has soils that are moderately contaminated with heavy metals (Figure 4).
4.4.3 Pollution load index (PLI): The results of PLI shows that apart from top-soils in S2, S3, S4, S8, S11 and sub-soils in S1 and S2 which shows highly polluted status, all other sampled depth and location shows that the soils are generally moderately polluted with heavy metals (Tables 5 and 6) and (Figures 4 and 5). Based on PLI, all the soils in the study area are gravely deteriorated with respect to the control site which acts as a normalizer.
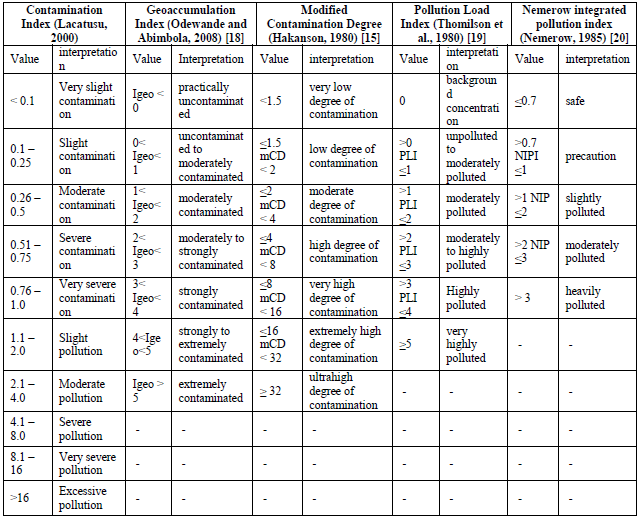
Table 5: Soil pollution models classification schemes utilized in this study.
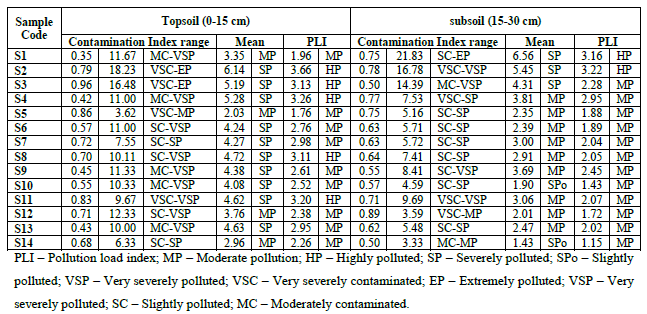
Table 6: Results of Contamination Index and Pollution Load Index for soils in the study area.
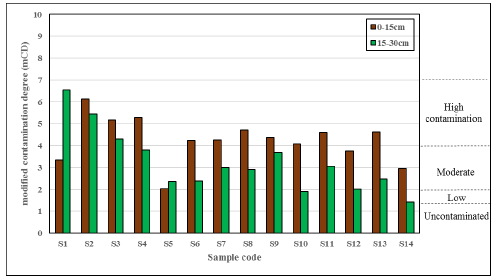
Figure 4: Modified Contamination Degree classification for soils in the area.
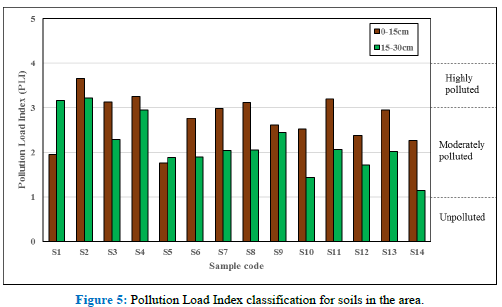
4.4.4 Geoaccumulation index (Igeo): Geoaccumulation Index (Igeo), also an indicator used to assess the intensity of anthropogenic contamination ranged from uncontaminated to moderately strong contaminated top-soils in location S1, S4, S6, S7, S8, S9, S10, S13 and S114, whereas uncontaminated to strongly contaminated in location S2, S3 and S12 (Table 7). In location S5, the top-soils are uncontaminated to moderately-contaminated. In order of decreasing magnitude, the heavy metals responsible for the high geo-accumulation in the top-soil are Pb > Cu > Cd Zn > Ni > Fe and Mn. In the sub-soils, Igeo ranges from uncontaminated to moderately severe contamination in location S4, S8, S9 and S11. Location S1, S2 and S3 shows uncontaminated to strongly contaminated soils while S5, S6, S7, S10, S12, S13 and S14 shows uncontaminated to moderately contaminated soil status with respect to heavy metals. The heavy metals responsible for the geo-accumulation increase in the sub-soils are as follows: Pb > Zn > Cu > Ni > Cd > Fe and Mn. Increasing anthropogenic activities causes increased geo-accumulation of these metals in the soil. Therefore, measure needs to be put in place to reduce anthropogenic activities in the area, because, these metals are very hazardous to health of humans, plants and animals when in high concentrations.
4.4.5 Anthropogenicity (APn%): Anthropogenicity, which is a measure of the percentage or extent of anthropogenic input on the environment showed that Cd and Pb have the highest percentage in both the top-soil and sub-soils in the area (Table 8). In order of decreasing magnitude, the heavy metal concentrations most influenced by man-made activities in the soils are Cd > Pb > Zn > Cu > Fe > Ni > Mn. Cadmium, lead, zinc and copper are common metals that are associated with activities done at fuel filling and service stations and mechanic workshops. Hence, the activity in the area needs to be regulated in order to decrease the percentage contribution of these metals on the soils.
4.4.6 Nemerow integrated pollution index (NIPI): The results of NIPI showed that the soils are dominantly highly polluted with heavy metals. Only top-soils at location S5 and sub-soils at location S5, S10, S12 and S13 are moderately polluted with heavy metals, whereas, location S14 is severely polluted. All other locations are composed of soils that are highly polluted. NIPI is an integrated approach for analysis of pollutants in soils because it takes input from all other pollution indices. Therefore, NIPI was utilized to generate an overall pollution map for the study area. The map clearly shows that the region surrounding the fuel filling and service station are the most deteriorated, and the soil quality improves away from the station (Figure 7). It is worthy of mention at this point that, although anthropogenic analysis has revealed that the soils are polluted with respect to the control site which acts as a baseline, the soil quality in the area are generally safe for agriculture as proven by DPR [21] and other international standards for soil quality. Table 7 shows the results of pollution assessment models and their interpretation for soils while Table 8 is the results of Anthropogenicity (APn%) for soils in the study area.
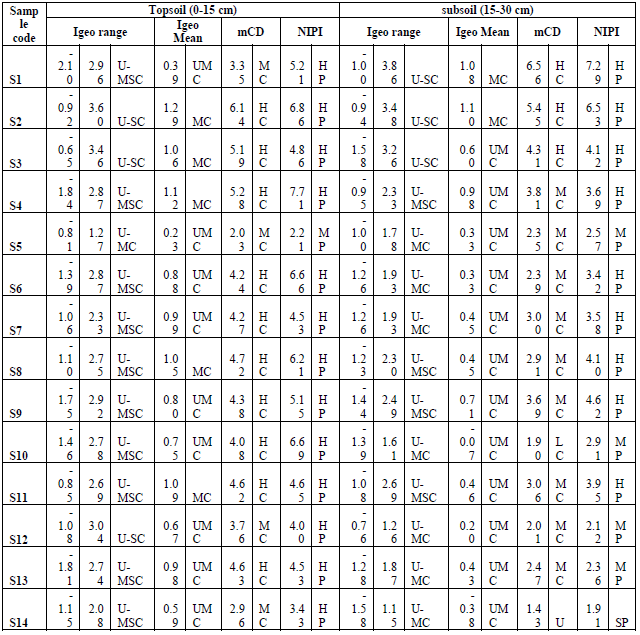
U – uncontaminated; MSC – Moderately strongly contaminated; MC – Moderately contaminated; HC – Highly contaminated; SC – Strongly contaminated; UMC – Uncontaminated-Moderately contaminated; HP – Highly polluted; SP – Severely polluted; LC – Low contamination; mCD – modified contamination degree; Igeo – geo-accumulation index; NIPI - Nemerow Integrated Pollution Index.
Table 7: Results of pollution assessment models and their interpretation for soils in the area.
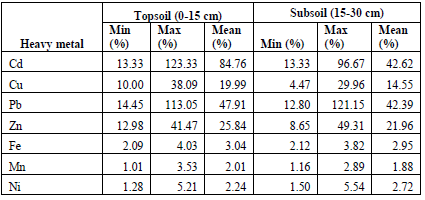
Table 8: Results of Anthropogenicity (APn%) for soils in the study area.
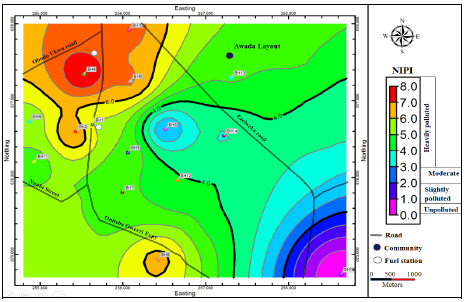
Figure 7: A map showing Nemerow Integrated Pollution Index for soil variations across the area.
5. Conclusion
Physicochemical parameter, hydrocarbon content and heavy metals were analyzed in both the soils and groundwater. The parameters analyzed from the soil samples includes; grain size, pH, EC, N, TOC, TPH, Ca, Mg,
K, Na, Zn, Pb, Cu, Cd, Fe, Ni, Mn, Ag and Hg. Grain size analysis shows that the top soils (0-15 cm) and the sub soils (15-30 cm) in the area are predominantly sandy, composed of over 70% sand. The sandy nature of the soils could aid infiltration and increases the pathway for contaminants into the subsurface waters. Soil classification based on SAR (<13), pH (<8.5) and EC (>4 µS/cm) shows that the soils are saline soils.
The average concentration of P, N, TPH and Mg decreases with depth whereas Na and Ca increase with depth. The concentrations of most of the physicochemical parameters, heavy metals and hydrocarbons are higher at the vicinity of the fuel filling stations than at the control site which is an indication of anthropogenic influences. Also, the concentrations of all the heavy metals are within DPR (2002) regulatory limits for safe agricultural soils.
Assessment of anthropogenic influences on the soil quality in the area with respect to the control site was accomplished using various soil quality models. The results of all the models including Contamination Index (CI), Pollution Load Index (PLI), modified Contamination Degree (mCD), geo-accumulation Index (Igeo), Nemerow Integrated Pollution Index (NIPI) shows that the soils are heavily polluted from the activities at the various fuel filling and service stations in the area which includes pollution arising from gasoline combustion exhausts, lubricating oil spills, and other chemical inputs to automobile operations. The anthropogenic percentage contribution of each metal are in the order; Cd > Pb > Zn > Cu > Fe > Ni > Mn. Cadmium, lead, zinc and copper are the major contributors to soil pollution in the area, and are usually associated with activities done at fuel filling and service stations and mechanic workshops. Hence, the activity in the area needs to be regulated in order to decrease the percentage contribution of these metals on the soils.
The soils are excellent for agricultural purposes but are being deteriorated by activities related to the fuel filling and service stations in the area. Also, the groundwater in the area has been declared unfit for drinking, unless treated for pH, iron and nickel, but excellent for irrigation purposes. There should be strong legislation governing the location and activities done at fuel filling and service stations to prevent environmental degradation. Perhaps ‘polluter pay principle’ and good practice should be adopted. This study revealed that Nemerow Integrated Pollution Index (NIPI) is a more effective tool over every other soil pollution model for the assessment of soil quality in any given area because it takes input from every other pollution index and produces a single quality status for the area.
References
- Emilola O, Oluwatoyin A. Impact of assessment of dumpsites on quality of nearby soil and underground water. A case study of an abandoned and a functional dumpsite in Lagos, Nigeria. International Journal of Science, Environment and Technology 3 (2014): 1004-1015.
- Antoaneta E. Determination of heavy metals in soil using XRF technique. Rom Jown Phys 55 (2010): 815-820.
- Al-Chalabi AS, Hawker D. Distribution of vehicular lead in road side soils of major roads of Brisbane , Australia, water air soil pollut 118 (2000): 299-310.
- Onianwa PC. Monitoring Atmospheric Metal Pollution. A review of the use of masses as indicators. Environmental Monitoring and Assessment 71 (2001): 13-50.
- Ameh GE. A Preliminary Assessment of Soil Samples around a Filling Station in Diobu, Port-Harcourt, Rivers State, Nigeria. Research Journal of Environmental and Earth Sciences 6 (2014): 57-65.
- Dauda MS, Odoh R. Heavy metals assessment of soil in the vinicity of fuel filling station in some selected local government areas of Benue State, Nigeria. Der Chemica Sinica 3 (2012): 1329-1336.
- American Public Health Association (APHA). Standard methods for examination of water and wastewater (17th Edn.). Washington DC (1989).
- Ezenwaji EE, Orji MU, Enete CI, et al. The effect of climatic change on the communities of Ogbaru wetland of south west Anambra State, Nigeria. IOSR Journal of Engineering (IOSEJEN) 4 (2014): 61-67.
- Nwajide CS, Reijers TJA. Geology of the Southern Anambra Basin. In: Reijers TJA. Geology, SPDC, Warri (1996): 133-148.
- Okogbue CO. Hydrocarbon Potentials of the Anambra Basin. Great AP Express Publishers Ltd, Nsukka (2006).
- Nwajide CS. Geology of Nigeria’s Sedimentary Basins. CSS Press, Lagos, Nigeria (2013).
- Ojoh KA. Evolution des Bassins Albo-Santoniens du Sudouest du fosse de la Benoue (Nigeria). Apports a la connaissance du domaine Equatorial de IIAtlantique Sud. Thesis Doctorate, Universite Aix-Marseille Ill. (1988).
- American Public Health Association (APHA). American Water Works Association (AWWA) and Water Pollution Federation (WPCF) Standard Methods for the Examination of Water and Waste water (16th Edn). Washington D.C (1985): 1260-1268.
- Lacutusu R. Appraising levels of soil contamination and pollution with heavy metals In Heinike HJ, Eckselman W, Thomasson AJ, et al. Land information systems for planning the sustainable use of land resources. European Soil Bureau Research Report No. 4. Office of Official Publication of the European Communities, Luxembourg (2000): 393-402.
- Hakanson L. Ecological risk index for aquatic pollution control. A sedimentological approach. Water Research 14 (1980): 975-1001.
- Canadian Council of Ministers of the Environment (CCME). Canadian soil quality guidelines for the protection of environmental and human health: Summary tables. Updated September, 2007. In: Canadian environmental quality guidelines, 1999, Canadian Council of Ministers of the Environment, Winnipeg (2007).
- VROM. Circular on Target Values and Intervention Values for Soil Remediation. Annex A, Dutch Ministry of Housing Spatial Planning and Environment (VROM), The Hague, The Netherlands (2000).
- Odewande AA, Abimbola AF. Contamination indices and heavy metal concentrations in urban soil of Ibadan metropolis, southwestern Nigeria, Environ Geochem Health 30 (2008): 243-254.
- Thomilson DC, Wilson DJ, Harris CR, et al. Problem in heavy metals in estuaries and the formation of pollution index. Helgol Mar Res 33 (1980): 566-575.
- Nemerow NL. Stream, Lake, Estuary, and Ocean Pollution, Van Nostrand Reinhold Publishing, New York, NY, USA (1985).
- DPR. Environmental guidelines and standards for petroleum industry in Nigeria, Department of Petroleum Resources (1991).
Citation: Nwankwoala HO, Ememu AJ. Contamination Indices and Heavy Metal Concentrations in Soils in Okpoko and Environs, Southeastern Nigeria. Journal of Environmental Science and Public Health 2 (2018): 77-95.
